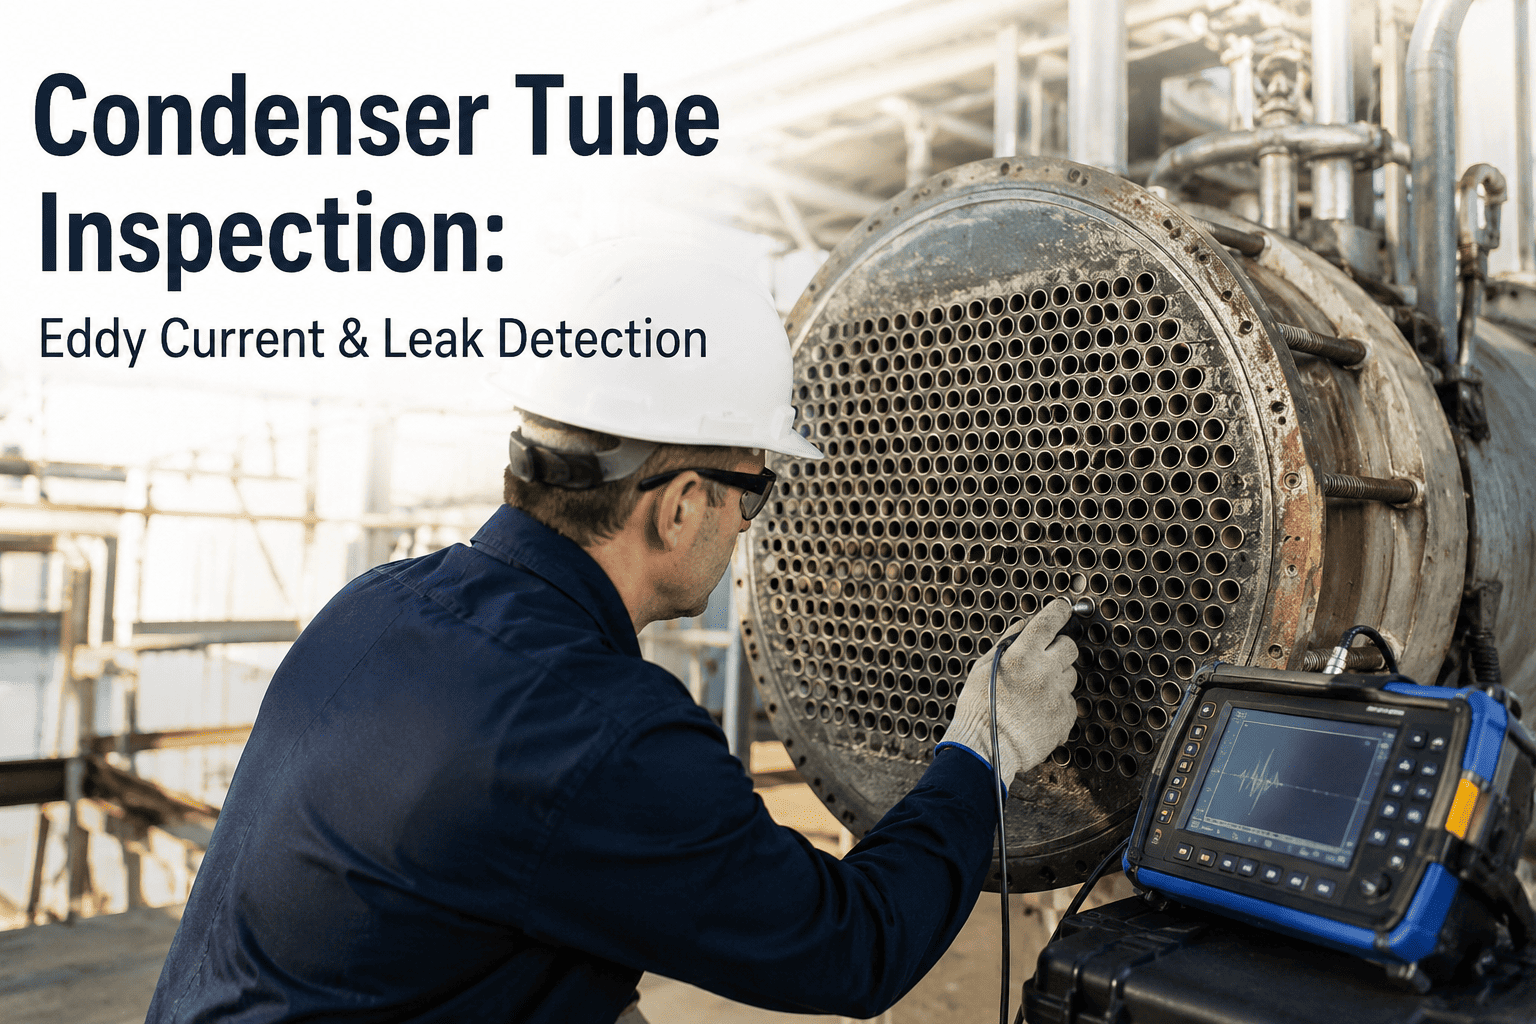
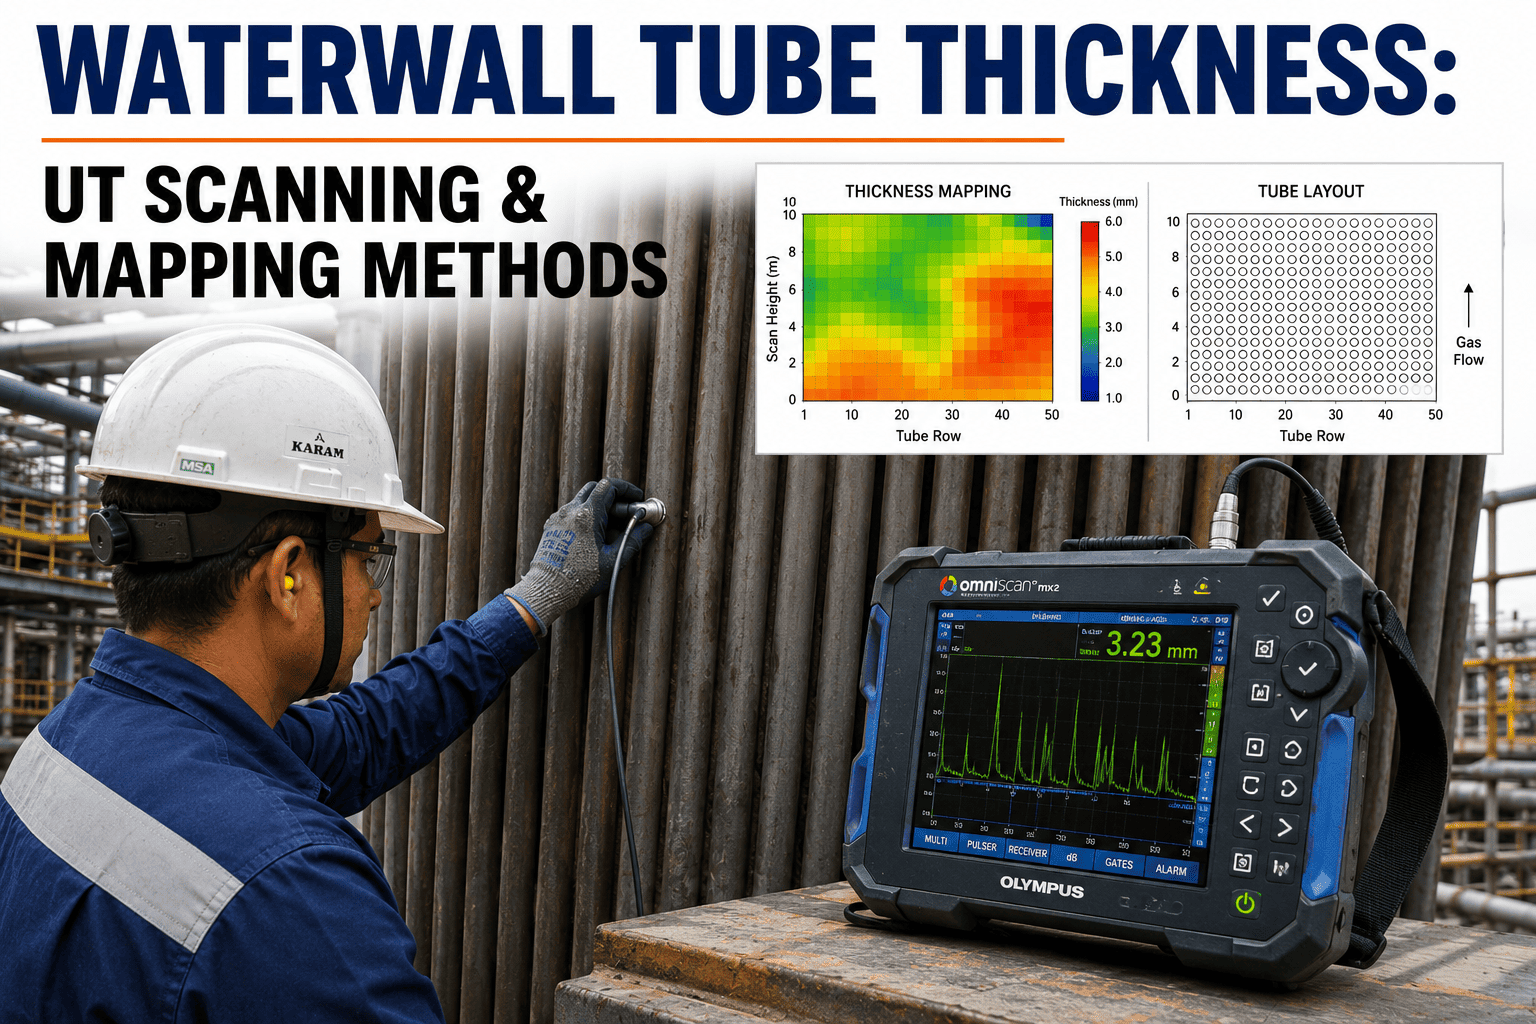
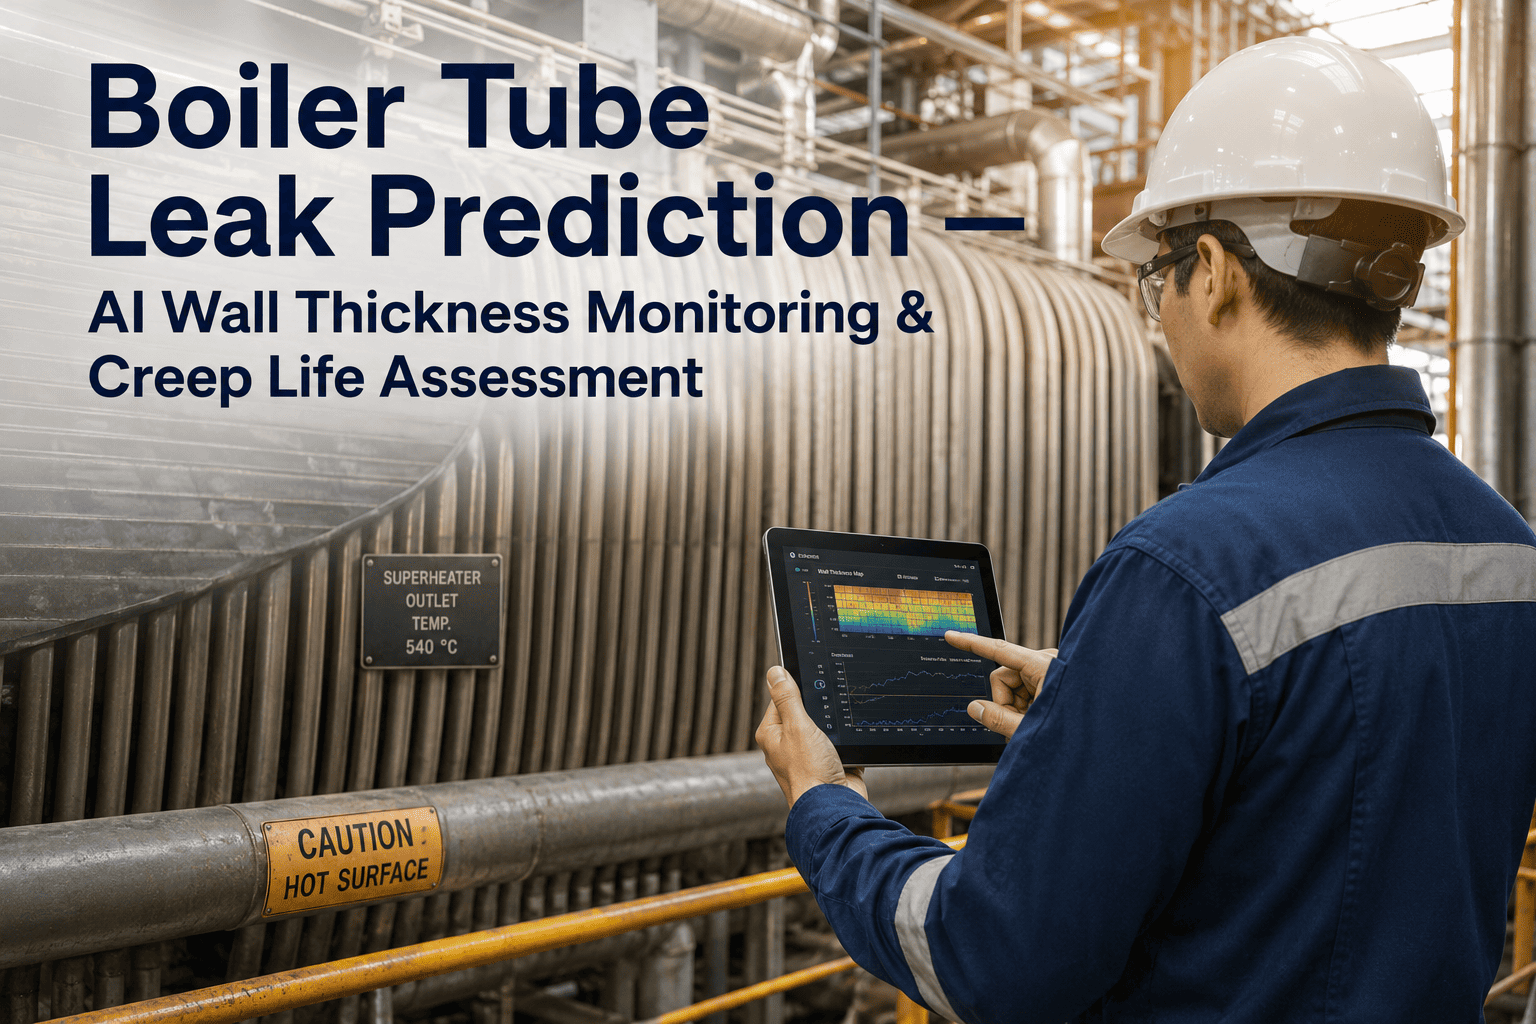
Eddy current testing has been the workhorse non-destructive method for condenser and feedwater heater tube inspection for decades, and for good reason — it inspects thousands of tubes per outage day, requires no couplant or radiation permits, and reliably characterizes wall loss, pitting, and cracking in nonferrous tubing without cutting a single tube out of service. But the technique's real limitation was never the physics of induced eddy currents — it's what happens to the inspection result after the probe comes back out of the tube. A phase-angle signal that took a skilled analyst thirty seconds to characterize routinely ends up as a static PDF, disconnected from the CMMS that dispatches the plugging crew, invisible to the trending system that should be projecting when the unit crosses its retubing threshold. iFactory's condenser and heat exchanger reliability team connects ECT inspection data directly into structured, trendable asset records that actually drive maintenance decisions.
Power Generation · Non-Destructive Testing
Eddy Current Testing for Condenser and Heater Tube Inspection
Probe selection, calibration standards, and defect characterization methodology for rapid, accurate condenser and feedwater heater tube inspection — and why the inspection result only creates value once it's connected to a system that actually tracks wall loss trends and triggers the plugging work order automatically.
Why ECT Matters
6,000+
forced outages annually from condenser tube leaks in U.S. plants
10.6 MW
lost per hour from a 1 psia backpressure rise on a 1M lb/hr unit
5–8%
plug count threshold where retubing typically becomes justified
Why ECT Is the Default Method
What Eddy Current Testing Actually Measures and Why It Fits Tube Bundles
Eddy current testing works by inducing an alternating current in the tube wall through a coil-carrying probe, then reading how that induced field changes as the probe encounters wall thinning, pitting, cracking, or other conductivity-affecting defects. Because it's an electromagnetic technique rather than a mechanical or acoustic one, ECT doesn't require couplant, doesn't need direct surface contact in the way ultrasonic methods do, and can be automated with a probe driver to push a probe through thousands of tubes in a single outage window — which is exactly the throughput condenser and feedwater heater inspection requires when a unit might have anywhere from several thousand to tens of thousands of individual tubes.
The technique's fit for nonferrous condenser and heat exchanger tubing specifically comes down to conductivity and permeability. Copper alloys, admiralty brass, titanium, and stainless steel — the common condenser and feedwater heater tube materials — all respond predictably to eddy current excitation without the magnetic saturation issues that complicate ECT on ferromagnetic tubing. That's why standard bobbin-coil ECT remains the primary NDT method specified in tube mill certification testing and outage inspection programs for condensers, feedwater heaters, and balance-of-plant heat exchangers across the power generation industry.
What ECT delivers, when done correctly, is more than a pass-fail result. A properly calibrated multi-frequency inspection characterizes defect type, estimates depth as a percentage of wall thickness, locates the indication relative to support plates and tubesheet, and distinguishes between benign signal sources — support plate proximity, dents, deposits — and actual wall loss that needs to be tracked toward a plugging decision. That level of characterization is what makes ECT valuable as a predictive tool, not just a screening test, and it's also exactly the kind of structured data that gets lost when the inspection output is a PDF report instead of a queryable record.
The Inspection Methodology
The Four-Stage ECT Inspection Workflow
A rigorous condenser or feedwater heater ECT program follows a consistent sequence from tube preparation through final reporting. Each stage has specific technical requirements that directly affect the reliability of the final defect characterization, and skipping or rushing any stage is the most common reason ECT results end up disputed or unusable for trending.
01
Tube Preparation and Cleaning
Tubes are cleaned — typically by hydro jetting at high pressure — before probe insertion. Cleaning adequacy is verified by passing a dummy probe or rod through the tube to confirm it's clear of scale and deposits that would produce false signals or obstruct the actual ECT probe.
02
Calibration Against a Reference Standard
Before any tube is tested, the probe and instrument are calibrated against a reference standard containing known artificial defects — ASME-type flat-bottom holes of varying depths, saw-cut notches, or similar reference discontinuities matched to the tube material and wall thickness of the unit being inspected.
03
Data Acquisition
The probe is driven down and back through each tube using an automated probe driver, with data uploading in real time from the acquisition crew to the analysis crew. Probe speed, frequency selection, and coil type are held constant across the inspection scope to keep results comparable tube-to-tube.
04
Data Analysis and Reporting
The analysis crew scrutinizes every signal for quality and completeness, evaluating and recording the condition of each tube — location, depth, and degradation characteristics. Preliminary reports are typically issued daily during the outage so plugging decisions can be made before the unit needs to return to service.
See Structured Inspection Data in Action
Watch ECT Results Turn Into a Live Tube-Sheet Map and Plugging Work Order
Book a walkthrough with iFactory's reliability engineering team and see how per-tube ECT findings — wall loss depth, defect classification, location — flow directly into a digital tube map with automatic plugging thresholds and CMMS work order generation.
Probe Selection
Choosing the Right Probe and Technique for the Application
Probe selection is the single variable with the most influence on inspection resolution and defect detection capability. The choice depends on tube material, expected defect type and location, and whether the inspection needs to resolve circumferential cracking near the tubesheet — one of the most challenging geometries in tube inspection. The table below summarizes the main probe technologies used across condenser and feedwater heater inspection programs.
| Probe Type |
Best Suited For |
Limitation |
Typical Standard |
| Differential Bobbin Coil |
General wall thinning, pitting, high-speed screening |
Reduced sensitivity to gradual, long-length wall loss |
ASTM E243 |
| Absolute Bobbin Coil |
Gradual wall loss and long, shallow degradation |
More susceptible to lift-off and fill-factor noise |
ASTM E243 |
| Eddy Current Array (ECA) |
Circumferential cracking near tubesheet and roll transitions |
Slower acquisition, higher data volume per tube |
ISO 15548-1 |
| Remote Field Testing (RFT) |
Ferromagnetic tubing, wall thinning from corrosion or erosion |
Lower resolution on small, localized defects |
ASTM E2096 |
| Multi-Frequency Bobbin |
Discriminating true defects from support plate and deposit signals |
Requires more complex calibration and analyst training |
ASME Section V |
Frequency selection compounds the probe choice. As a general rule, more frequencies produce more conclusive data because each frequency responds differently to defect depth and to nuisance signal sources like support plates and tube dents — running multiple frequencies simultaneously and mixing the signals lets the analyst suppress the nuisance response while preserving the true defect indication. The tradeoff is data volume and analysis time, which is exactly why multi-frequency inspection results benefit enormously from software that can process and trend the data automatically rather than relying on manual chart review alone.
Defect Characterization
What ECT Signals Actually Tell You About Tube Condition
The value of eddy current testing is in what the phase angle and amplitude of the signal reveal about defect type and severity — not just whether a signal exists. The categories below are the defect types every condenser and feedwater heater ECT program is built to characterize.
D1
General Wall Thinning
Gradual loss of tube wall from erosion or corrosion, typically detected as a smooth phase angle shift over an extended tube length. Depth estimated as a percentage of nominal wall thickness against the calibration curve, and tracked over multiple inspection cycles to project remaining life.
D2
Localized Pitting
Sharp, isolated signal response indicating point corrosion, often from stagnant water conditions or under-deposit attack. Pitting depth is harder to size precisely than general wall loss and often requires the sharper resolution of an eddy current array probe near critical zones.
D3
Circumferential Cracking Near Tubesheet
One of the most challenging defect geometries to characterize, occurring at the roll transition where the tube meets the tubesheet. Standard bobbin probes often miss or misclassify this defect type — multiplexed eddy current array probes with full 3D imaging are purpose-built for this specific location.
D4
Support Plate Wear and Fretting
Wear damage at the location where the tube passes through intermediate support plates, caused by flow-induced vibration over time. Analysis must distinguish the wear signal from the benign support plate proximity signal, which is why separate calibration curves for mid-span and support plate locations are standard practice.
D5
ID and OD Damage
ECT excels at detecting damage on both the inside diameter and outside diameter of the tube, which matters because condenser and feedwater heater tubes are exposed to different degradation mechanisms on the process side versus the cooling water side of the wall.
D6
Dents and Mechanical Deformation
Physical deformation from foreign object impact, tube-to-tube contact, or installation damage. Dents produce a distinct signal signature from wall loss defects and must be classified separately so they don't get miscounted toward the plant's plugging threshold calculation.
The Manual Gap
Where the Inspection Result Currently Goes to Die
The technical rigor of ECT methodology means nothing if the resulting per-tube data doesn't make it into a system that actually drives maintenance action. This is the gap that costs plants the real value of their inspection investment, and it plays out in a consistent pattern across the industry.
G1
The Result Lands as a PDF
Per-tube findings — location, depth, degradation characteristics — are compiled into a static report. The structured data that made the analysis rigorous gets flattened into a document that has to be manually re-read by someone else to extract action items.
G2
No Automatic Connection to the Plugging Decision
A tube that crosses the plant's plugging threshold doesn't automatically generate a plugging work order — someone has to read the report, check it against the threshold policy, and manually create the work order before the outage window closes.
G3
Tube-Sheet Maps Live Outside the CMMS
The digital tube-sheet map showing which tubes are plugged, which are flagged, and which passed clean typically lives in a separate system from the CMMS that tracks maintenance history — so the two records drift apart across successive outages.
G4
No Cross-Cycle Trending on Individual Tubes
Without structured data, comparing this outage's wall loss reading against the same tube's reading from three outages ago requires manually pulling two PDFs and eyeballing the difference — which means the trend that predicts retubing timing almost never gets calculated in practice.
G5
Plug Count Threshold Tracking Is Manual
Retubing decisions typically become justified once plugged tubes exceed roughly five to eight percent of total tube count, but without a live plug count against total, plants routinely discover they've crossed the threshold well after the fact, missing the capital planning window for retubing.
Closing the Gap
What Structured ECT Data Actually Enables
When per-tube ECT results are captured as structured data attached to the specific tube asset — rather than as a PDF — the inspection result stops being a compliance artifact and starts driving the maintenance program directly. The capabilities below are what becomes possible once the data gap is closed.
S1
Automatic Plugging Work Orders
When a tube's characterized wall loss crosses the plant's defined plugging threshold, a plugging work order generates automatically — assigned, prioritized, and ready for the outage crew — without anyone needing to manually cross-reference the report against the policy.
S2
Cross-Cycle Wall Loss Trending
Every tube's cumulative wall loss history is tracked across multiple inspection cycles automatically, enabling genuine remaining-life projection per tube instead of a fresh, disconnected snapshot every outage.
S3
Live Plug Count Against Retubing Threshold
A running plug count against total tube count means the plant sees the retubing threshold approaching well before it's crossed, preserving the lead time capital planning needs to budget and schedule a retubing project properly.
S4
Digital Tube-Sheet Map Connected to CMMS
The tube-sheet map — showing plugged, flagged, and clean tubes — lives inside the same system that tracks maintenance history, work orders, and outage records, eliminating the drift between separate inspection and maintenance systems.
Field Perspective
"
Every plant I've worked with has good ECT technicians and a rigorous inspection procedure — that part of the industry is mature and well-standardized. What's not mature is what happens to the data afterward. I've seen outages where the ECT vendor delivered a beautifully detailed report on the last day of the window, and by the time anyone had read it carefully enough to identify every tube crossing the plugging threshold, the outage was already closing out and half those tubes got pushed to next cycle instead of getting plugged now. That's not an inspection failure — the inspection was excellent. It's a data-handling failure, and it's completely avoidable. Once you get per-tube ECT results flowing into a system that automatically flags threshold crossings and builds the work order in real time during the outage, you stop losing tubes to the review lag. The technicians were already doing the hard part correctly. The software just needs to stop losing what they found.
Dorotea Vandermeer-Osei
Power Plant Reliability Engineering Lead · 18 years in condenser and heat exchanger asset management, NDT program development, and CMMS integration
Common Questions
Frequently Asked Questions
How often should condenser and feedwater heater tubes be inspected with ECT?
Inspection frequency is typically driven by unit criticality, historical wall loss rates, and operating hours or steam cycles rather than a fixed calendar interval alone. Many plants inspect condensers on a full or significant sample basis every major outage, with feedwater heaters inspected on a similar or extended cycle depending on prior findings. Units with a history of aggressive wall loss or known chemistry issues warrant tighter inspection intervals. A structured maintenance system that automates inspection scheduling based on operating hours and prior trend data, rather than just calendar dates, catches overdue inspections before a regulator or an unplanned leak does.
Talk to reliability engineering about setting inspection intervals for your specific unit history.
Does eddy current testing replace the need for helium leak surveys or water chemistry monitoring?
No — the three methods answer different questions and are complementary rather than substitutable. Helium leak surveys identify the physical location of an active leak, often at a flange or specific tube. ECT characterizes wall condition across the full tube population, including tubes that haven't leaked yet but are approaching failure. Water chemistry monitoring flags conductivity or other chemistry deviations that indicate a leak is occurring somewhere in the system, without pinpointing location. Mature condenser reliability programs run all three in a connected system so that a chemistry alert, a leak survey result, and an ECT finding on the same unit correlate automatically instead of living in three separate reports.
What plug count typically justifies a full retubing decision?
A common rule of thumb used across the industry is that retubing becomes worth evaluating once plugged tubes exceed roughly five to eight percent of the total tube count, though the exact threshold depends on the specific unit's layout, thermal margin, and how much heat transfer capacity the plant can afford to lose to plugged tubes before efficiency penalties outweigh the capital cost of retubing. Beyond that plug count, the ongoing thermal performance loss from an increasing number of out-of-service tubes typically justifies the capital investment in a full retube over continued incremental plugging. Live plug count tracking against total tube count is what gives capital planning teams the lead time to budget and schedule retubing properly rather than discovering the threshold has been crossed after the fact.
Can eddy current array probes replace standard bobbin coils for routine inspection?
Generally not for full-population screening — ECA probes deliver superior resolution for specific challenging geometries like circumferential cracking near the tubesheet, but that resolution comes with slower acquisition speed and significantly higher data volume per tube, which makes full-bundle ECA inspection impractical within typical outage time windows. The common practice is to run standard bobbin coil ECT across the full tube population for general screening, then apply eddy current array probes selectively at tubesheet and roll-transition zones or on tubes already flagged by the bobbin screening for closer characterization.
Book a demo to see how a tiered inspection strategy maps to your unit's specific risk profile.
How does structured ECT data actually connect to a plugging work order in practice?
Per-tube results — location, defect classification, depth as percentage of wall thickness — are captured as structured fields attached to that specific tube's asset record rather than embedded in a static report. When a tube's characterized depth crosses the plant's defined plugging threshold, the system automatically flags it and generates a plugging work order with the tube location, defect type, and depth already populated, routed to the outage crew for action before the window closes. This eliminates the manual step of a person reading a full inspection report, cross-referencing every finding against policy, and building work orders one at a time under outage time pressure — the step where tubes most commonly get missed or deferred to the next cycle.
From Inspection Data to Maintenance Action
Turn Every ECT Finding Into a Tracked, Trendable Tube Record
iFactory's condenser and heat exchanger reliability platform captures per-tube ECT results as structured data, tracks cumulative wall loss across every inspection cycle, and generates plugging work orders automatically when thresholds are crossed — so the technical rigor of your ECT program actually translates into maintenance decisions instead of getting lost in a PDF.