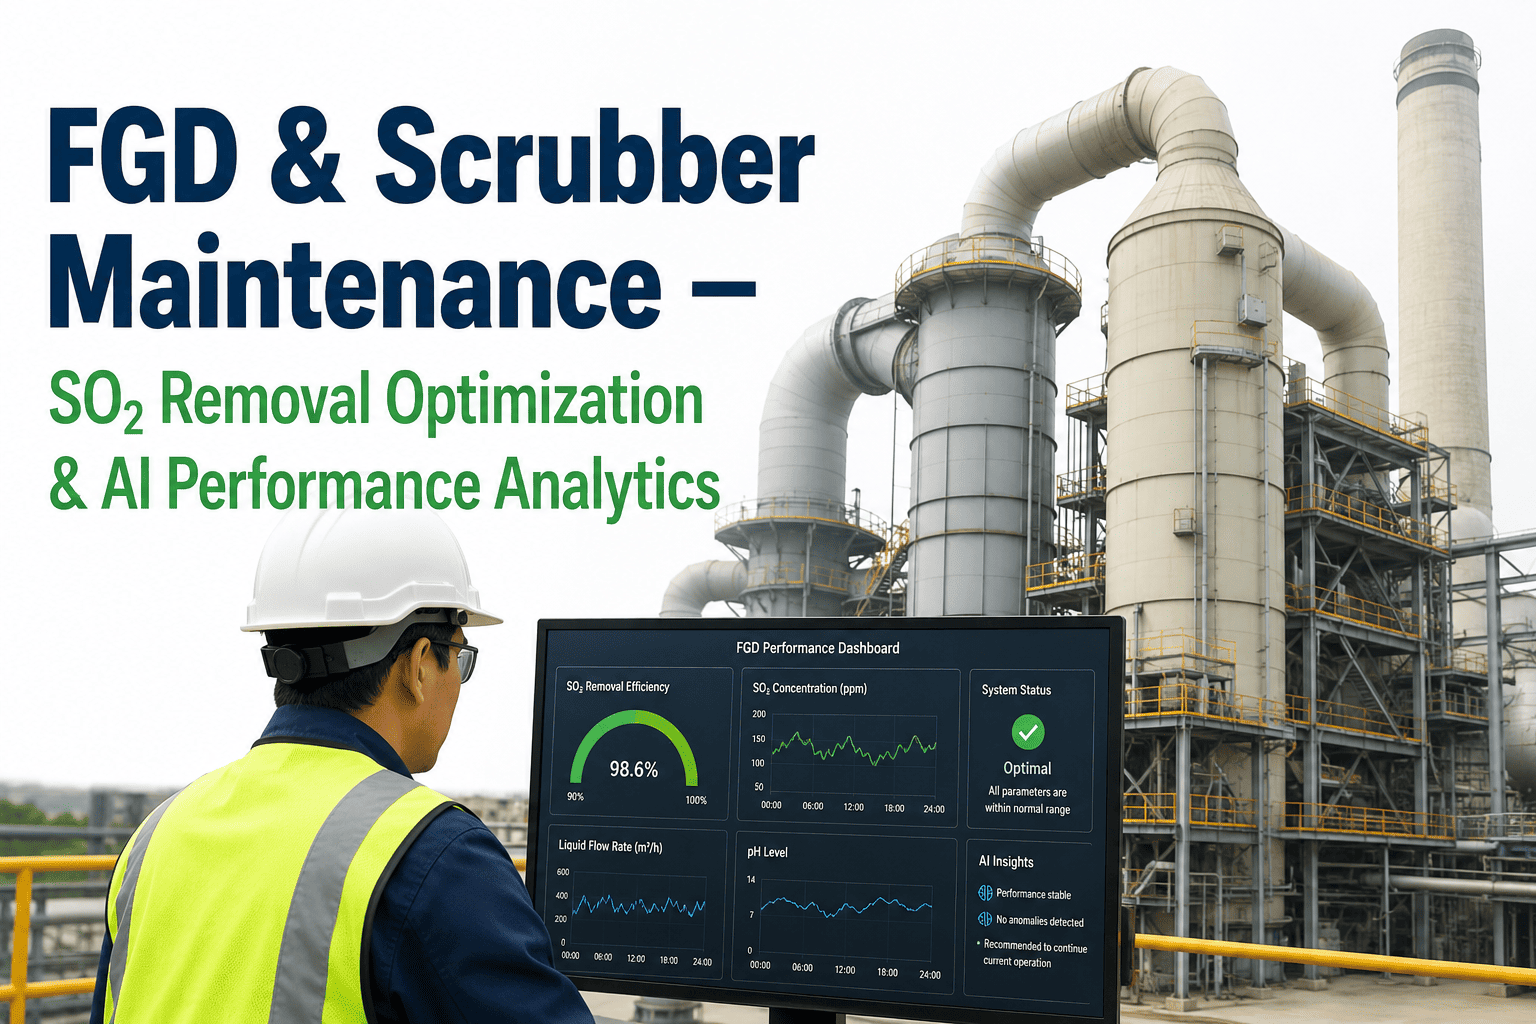
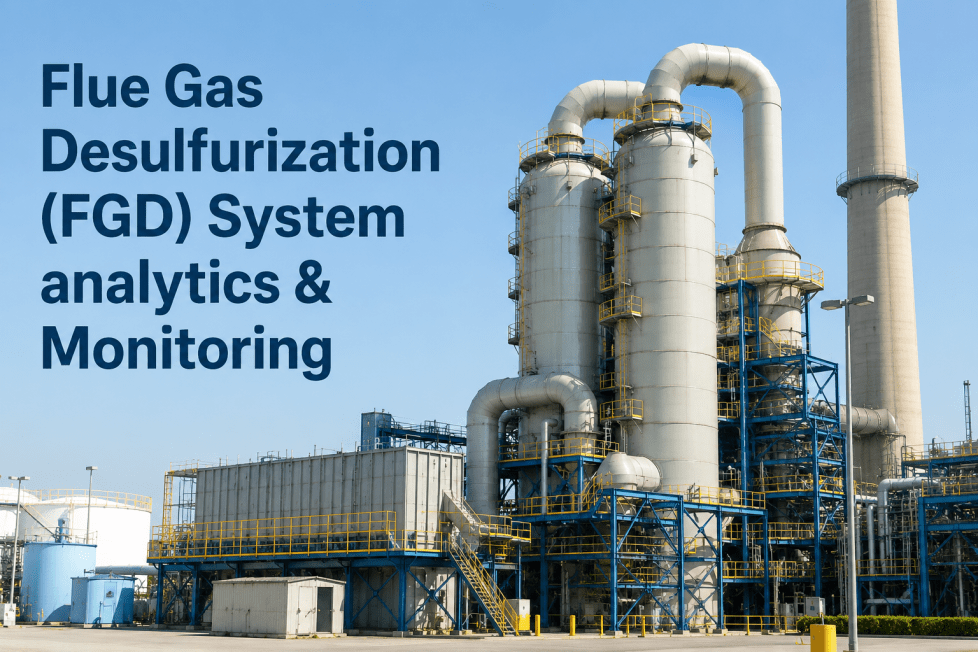
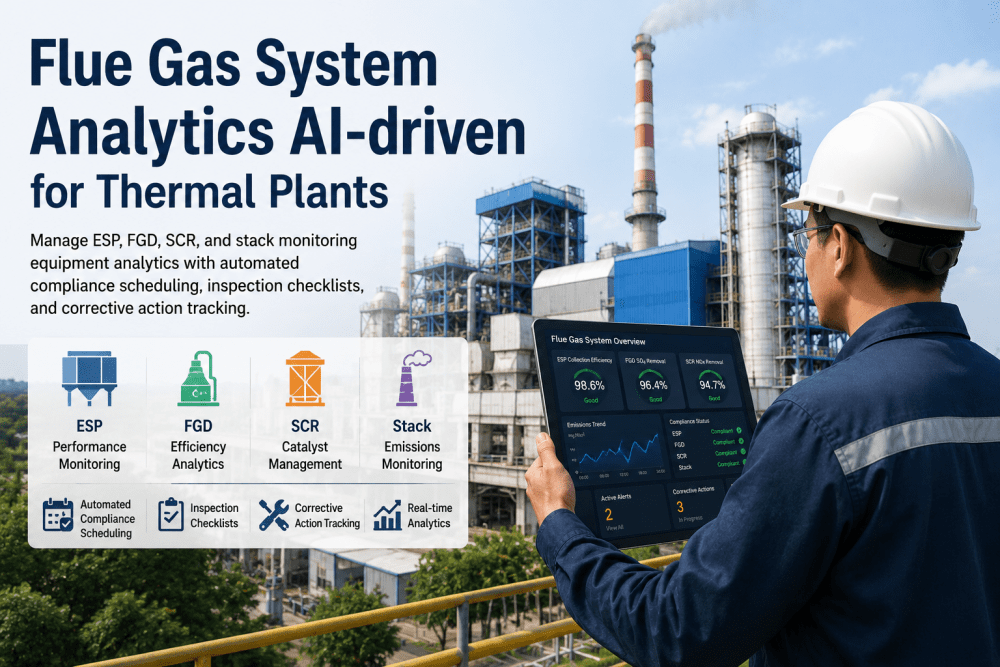
Flue gas desulfurization systems carry the full weight of a coal or oil-fired plant's SO2 compliance obligations, yet most FGD and wet scrubber units are still run on fixed maintenance calendars instead of the real-time chemistry and mechanical signals that actually predict performance loss. A wet limestone scrubber can drift from 97% SO2 removal down toward permit-threatening levels over a matter of weeks, driven by mist eliminator fouling, absorber pH excursions, or worn slurry recirculation pumps, long before a CEMS trend or a quarterly inspection catches it. For EHS managers, that gap between actual scrubber health and what shows up on a maintenance report is where compliance risk, gypsum byproduct losses, and reagent overspend quietly accumulate. iFactory AI Scrubber Performance Analytics closes that gap by continuously reading absorber chemistry, slurry density, and mechanical wear signals side by side with your CEMS data. Book a Demo to see how iFactory keeps your FGD system inside its SO2 removal design envelope, shift after shift.
FGD & Scrubber Performance Analytics
Know Your SO2 Removal Efficiency Before Your CEMS Data Does
AI-powered analytics that read absorber chemistry, slurry density, and mist eliminator condition in real time so your scrubber never drifts toward a permit exceedance unnoticed.
97%+
Sustained SO2 removal efficiency with continuous chemistry monitoring
10-15%
Typical efficiency loss within 90 days of missed FGD maintenance
6 wks
Standard deployment window from data audit to live analytics
Where SO2 Removal Efficiency Quietly Slips Away
Wet FGD systems rarely fail all at once. Efficiency erodes in small, compounding increments between scheduled inspections, and by the time it shows up on a compliance report, weeks of excess SO2 have already gone up the stack.
Week 1-2
Scale and gypsum buildup begins
Fine scale starts coating absorber spray headers and nozzle tips, gradually reducing the liquid-to-gas contact area that drives SO2 absorption. No alarm fires because bulk flow readings still look normal.
Week 3-5
Absorber pH drifts out of band
Limestone feed rate misalignment lets absorber pH slide below the 5.0-5.5 optimal range. SO2 absorption capacity falls sharply even though the reagent feed system appears to be running as designed.
Week 6-8
Slurry pump wear cuts L/G ratio
Recirculation pump impeller wear reduces slurry flow, pushing the liquid-to-gas ratio below design specification. Removal efficiency narrows quietly, with no single alarm triggered along the way.
Week 9-12
Mist eliminator blinding accelerates loss
Blinded mist eliminator sections force stack gas through remaining open passages at higher velocity, re-entraining slurry droplets and pushing SO2 removal toward the edge of permit limits.
What iFactory Continuously Tracks Across Your FGD System
Instead of a monthly grab sample or a reactive inspection, iFactory correlates the mechanical and chemical variables that actually determine SO2 removal performance, every minute of every shift.
01
Absorber pH and reagent stoichiometry
Continuous pH tracking against the optimal absorption band, cross-referenced with limestone feed rate and slurry density to catch stoichiometry drift before it affects removal efficiency.
02
Slurry recirculation pump health
Vibration signatures and flow rate trending on recirculation pumps flag impeller wear, cavitation, or bearing degradation weeks before an L/G ratio shortfall shows up in stack data.
03
Mist eliminator differential pressure
Rising differential pressure across mist eliminator banks is correlated against wash cycle history to distinguish normal loading from scaling that needs an early cleaning intervention.
04
Spray header and nozzle performance
Pattern analysis on spray coverage identifies plugged or eroded nozzles reducing gas-liquid contact area, a leading cause of silent SO2 removal decline in wet limestone scrubbers.
05
Gypsum dewatering and byproduct quality
Oxidation air rate and gypsum purity trends are tracked together, since poor oxidation directly affects both byproduct saleability and absorber slurry chemistry balance.
06
CEMS correlation and compliance margin
Every mechanical and chemistry signal is mapped against live CEMS SO2 output, so your team sees compliance margin narrowing in real time rather than discovering it at quarter end.
Regulatory Frameworks iFactory Reporting Supports
Compliance documentation for FGD and scrubber operations is generated automatically, formatted against the frameworks EHS teams are already accountable to.
EPA 40 CFR Part 60
New Source Performance Standards documentation for SO2 emission limits, with continuous parameter monitoring records mapped directly to absorber operating data for audit-ready submissions.
EPA 40 CFR Part 75
Acid Rain Program and continuous emissions monitoring data validation, cross-checked against FGD operating parameters to explain and support reported SO2 removal rates.
Title V Operating Permits
Ongoing compliance certification support with automated recordkeeping of FGD availability, removal efficiency, and any deviation periods requiring corrective action documentation.
State Implementation Plans
Configurable reporting templates aligned to state-specific SO2 control requirements, reducing manual reformatting work during routine agency reporting cycles.
Reactive Scrubber Management vs. iFactory Predictive Analytics
Stop Finding Out About SO2 Drift From a Stack Test
iFactory connects to your existing DCS and CEMS infrastructure, no new sensors required in most deployments, and surfaces scrubber health signals your team can act on immediately.
Getting Live in Six Weeks: The Deployment Path
iFactory follows a structured six-week rollout for FGD and scrubber analytics, built around your plant's existing DCS, historian, and CEMS infrastructure.
1
Data and Instrumentation Audit
Review existing pH probes, flow meters, differential pressure sensors, and CEMS tags to confirm what data is already available and where gaps exist.
2
DCS and Historian Connection
Establish OPC-UA or Modbus connections to pull live absorber, pump, and CEMS data into the analytics platform without disrupting control system operation.
3
Baseline Modeling
Establish normal operating baselines for your specific scrubber design, fuel sulfur content, and load profile so anomaly detection reflects your actual plant conditions.
4
Alert Threshold Validation
Operations, maintenance, and EHS teams jointly review and calibrate alert thresholds so notifications are actionable rather than noisy.
5
Full Production and Reporting Go-Live
Automated compliance reporting activates alongside real-time dashboards, with ongoing support for threshold tuning as seasonal conditions change.
A Coal Plant EHS Team's Six-Month Result
Case Study — Midwest Coal-Fired Facility
A 580 MW coal-fired plant's EHS team was managing FGD performance through weekly manual chemistry checks and a quarterly deep inspection, with SO2 removal efficiency fluctuating between 94% and 98% in ways the team could not consistently explain. After deploying iFactory's scrubber analytics, the team identified a recurring pattern of absorber pH drift tied to a specific limestone feed control valve, along with early-stage mist eliminator fouling that had gone undetected between wash cycles. Corrective work orders were issued before either issue affected compliance margin, and the plant's SO2 removal efficiency stabilized above 97% for the following six months.
97.4%
Average SO2 removal efficiency sustained over six months
3
Corrective interventions completed before compliance impact
40%
Reduction in manual chemistry check labor hours
What EHS Teams Say
We used to treat FGD performance as something we found out about after the fact, through a stack test or a monthly report. Now we see pH drift and pump wear trending in the same dashboard we already check every shift. Our last compliance review took a fraction of the time it used to, and we have not had a single unexplained efficiency dip since we started using the platform.
EHS Manager
Coal-Fired Generation Facility, Midwest United States
Frequently Asked Questions
Does iFactory require new sensors on our FGD system?
In most deployments, no. iFactory connects to the pH probes, flow meters, differential pressure transmitters, and CEMS data already present on a typical wet scrubber system through your existing DCS or historian. Where genuine instrumentation gaps exist, our team identifies them during the Week 1 audit and recommends the minimum sensors needed.
Talk to Support about reviewing your current instrumentation before deployment begins.
How does the platform distinguish normal chemistry variation from a real problem?
The analytics engine builds a baseline specific to your scrubber design, fuel sulfur content, and load profile during the initial deployment weeks, rather than relying on generic industry thresholds. Alerts are calibrated jointly with your operations and EHS teams so notifications reflect genuine deviations from your plant's own normal operating range rather than routine fluctuation.
Can iFactory generate reports formatted for our specific regulatory obligations?
Yes. Reporting templates are configured to your applicable frameworks, including EPA 40 CFR Part 60 and Part 75, Title V operating permit conditions, and relevant state implementation plan requirements.
Book a Demo to walk through the specific report formats your facility needs.
How long does it take before the EHS team sees actionable insight?
Baseline modeling and initial anomaly detection are typically active within the first two to three weeks of deployment, using historical data alongside live feeds. Most teams see their first actionable maintenance flag, such as an early mist eliminator fouling pattern or pump wear signature, within the first month of full production monitoring.
Does this replace our existing CEMS or environmental monitoring system?
No. iFactory works alongside your existing CEMS rather than replacing it, correlating CEMS output with upstream mechanical and chemistry data so your team understands the operational cause behind any emissions trend. Your CEMS remains the system of record for regulatory emissions reporting, while iFactory adds the predictive layer that explains why removal efficiency is changing.
Keep Your Scrubber Inside Its Design Envelope, Not Just Inside Compliance
iFactory gives EHS and operations teams continuous visibility into the chemistry and mechanical health that actually determines SO2 removal performance, with compliance reporting that writes itself in the background.
Continuous absorber chemistry and pump health tracking
Automated EPA and Title V compliance documentation
Six-week deployment using existing DCS and CEMS data
Early warning before removal efficiency nears permit limits