When a gas turbine trips unexpectedly at 2 a.m. during peak summer demand the immediate question isn't philosophical—it's operational: what failed, why did it fail, and how do we make sure it doesn't happen again before the next dispatch window? Traditional root cause analysis answers that question in days or weeks, after the fact, relying on manual log review witness interviews and engineering intuition built over decades of experience. For a small or mid-size power plant without a dedicated reliability engineering team, that process is slow, incomplete, and expensive.
AI-powered root cause analysis changes that equation fundamentally. By continuously analyzing sensor data streams, maintenance histories, and operational patterns, modern AI diagnostics platforms identify the underlying cause of equipment failures—automatically, in near-real time, and with enough specificity to drive corrective action rather than generic inspection recommendations. This guide explains exactly how AI root cause analysis works in power generation, what it catches that traditional methods miss, and what plant managers should demand from any platform they evaluate.
AI Root Cause Analysis for Power Plant Failures
Automatically identify why equipment fails—before breakdowns repeat. AI-powered RCA platforms reduce diagnostic time from days to hours and drive corrective actions that stick.
Why Traditional Root Cause Analysis Fails at Smaller Power Plants
Root cause analysis has been a standard reliability engineering practice for decades. The problem isn't the methodology—fault tree analysis, fishbone diagrams, and 5-Why frameworks are all sound approaches when applied correctly. The problem is execution. Smaller generation facilities rarely have the staffing, data infrastructure, or historical failure libraries to run rigorous RCA consistently across every equipment event.
Data Scatter
Relevant failure data is split across DCS alarm logs, CMMS work orders, operator shift notes, and paper maintenance records—none of it correlated automatically or searchable at the moment you need it most.
Expertise Bottleneck
Credible RCA requires a reliability engineer who understands the specific failure modes of the equipment involved. Most plants under 300 MW don't have that role on staff, so analysis defaults to whoever is most available—not most qualified.
Repeat Failure Cycles
When RCA is incomplete or delayed, corrective actions address symptoms rather than causes. The same failure mode recurs six months later under different operating conditions, and the cycle repeats indefinitely.
Incomplete Data Windows
Manual RCA typically reviews data from the 30–60 minutes surrounding a failure event. The actual precursor pattern that triggered the failure often began 14–45 days earlier—a window most investigations never examine.
AI-driven root cause analysis addresses each of these constraints directly: it correlates data automatically across all sources, applies pre-built equipment failure knowledge, and begins analyzing precursor patterns weeks before any human investigator would think to look.
Ready to move from reactive investigation to predictive failure prevention? Schedule your plant diagnostic assessment with iFactory's power generation analytics team.
How AI Root Cause Analysis Works: The Diagnostic Chain
AI-powered RCA isn't a single algorithm—it's a layered diagnostic process that moves from raw sensor data to a structured, actionable failure explanation. Understanding each layer helps plant managers evaluate whether a platform is genuinely performing root cause analysis or simply presenting alarm histories in a more organized format.
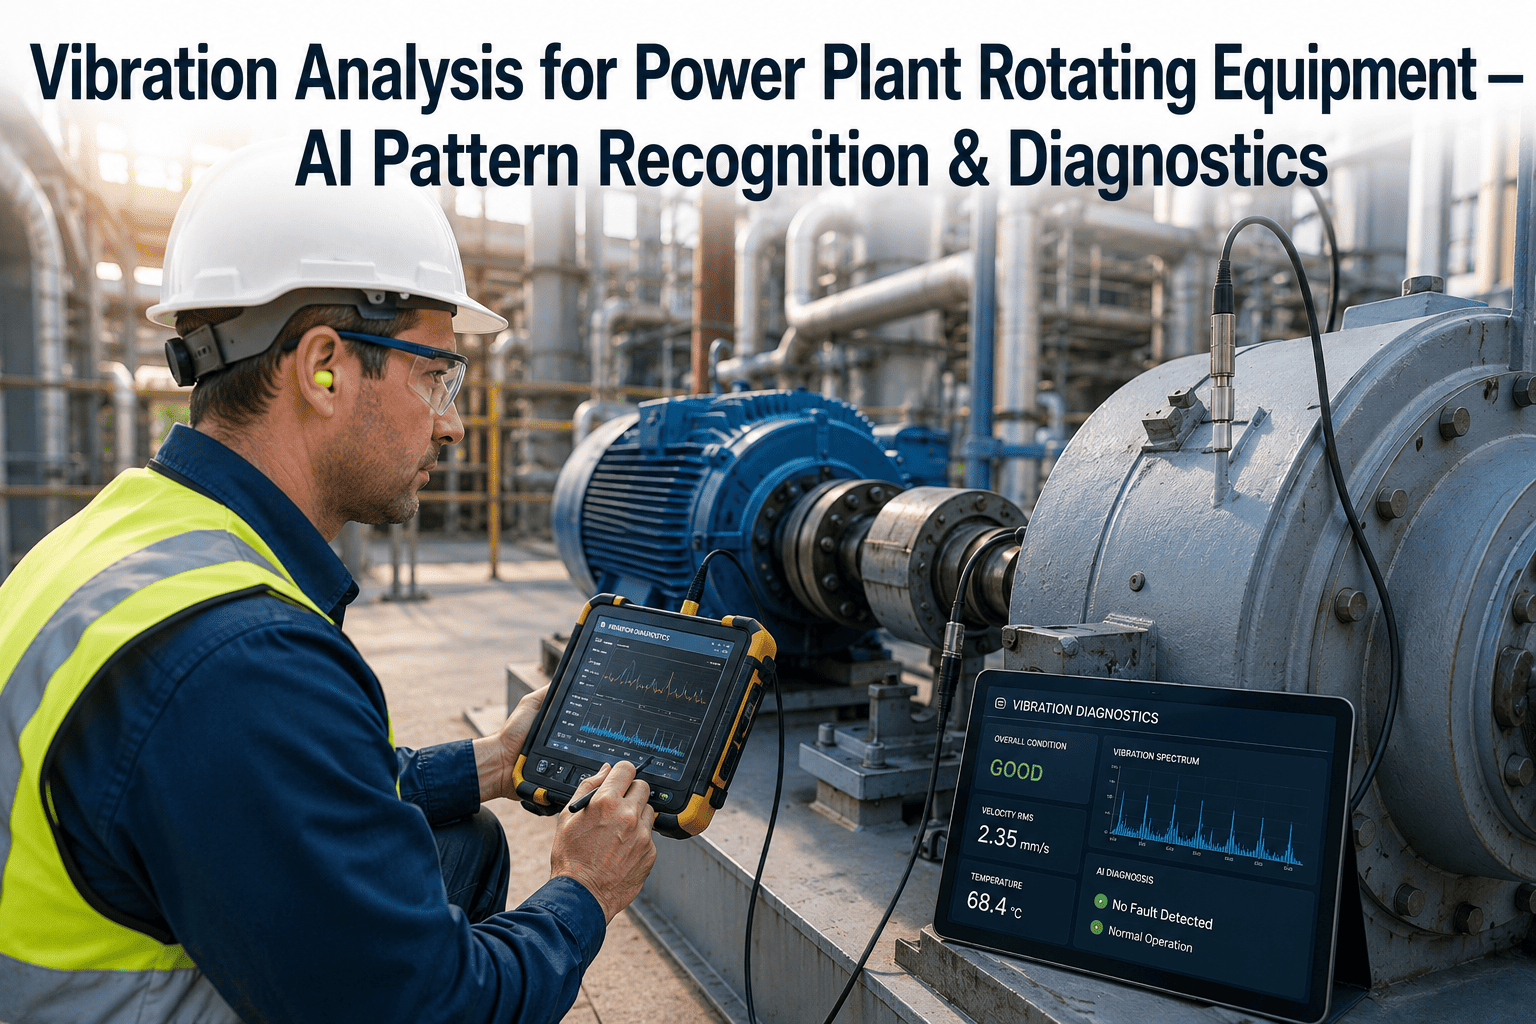
Continuous Multi-Variable Data Correlation
The platform ingests sensor streams from all monitored equipment—vibration, temperature, pressure, flow, current, and position signals—and correlates them against each other in real time. A bearing failure that manifests as a vibration anomaly also creates thermal signatures, current draw changes, and lubrication pressure variations. AI catches all four simultaneously; a threshold alarm catches only the one that crosses a trip setpoint first.
Failure Mode Pattern Matching
Machine learning models trained on thousands of historical failure events across fleet-wide equipment databases match incoming sensor patterns against known failure precursor signatures. When a developing pattern matches a compressor blade erosion signature or a seal degradation profile, the system flags the specific failure mode—not just an anomaly score—with a confidence percentage and expected progression timeline.
Precursor Timeline Reconstruction
Once a failure event occurs or is flagged as developing, the system automatically reconstructs the full precursor timeline—often extending 14 to 45 days back from the point of failure. This timeline identifies the earliest detectable signal, the progression sequence, and the operational conditions that accelerated degradation. This is the layer that transforms a failure investigation from "what broke" to "why it broke and when we first could have caught it."
Contributing Factor Identification
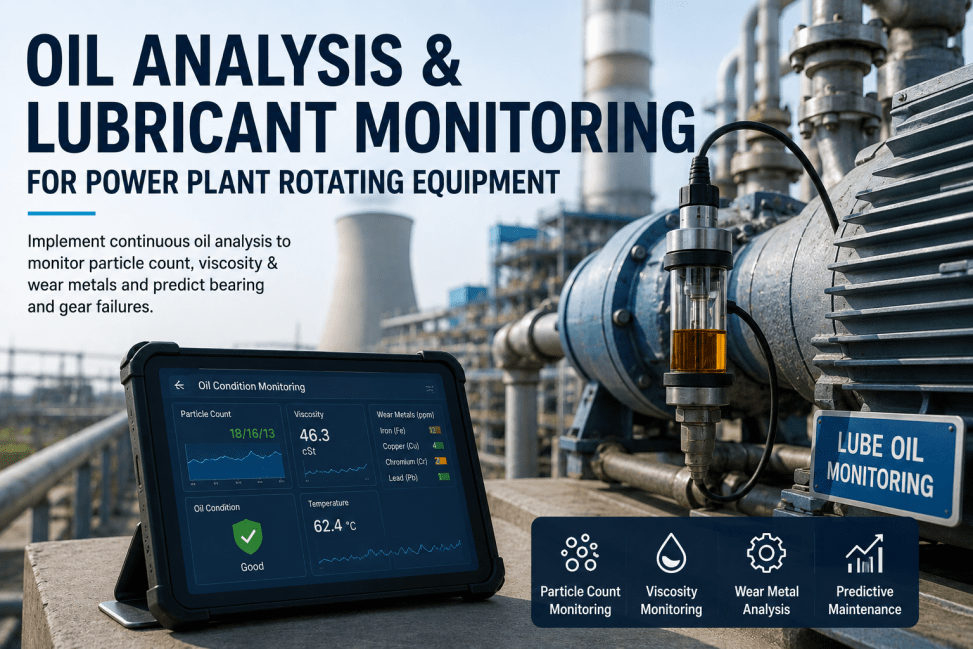
Root cause analysis requires distinguishing the initiating cause from contributing factors. The AI layer correlates operational data with the failure timeline to identify contributing conditions: Was the unit operating above design ambient temperature limits? Was the compressor wash interval overdue by 200 hours? Was the lubricating oil viscosity trending out of specification for three weeks before the event? Each contributing factor is weighted by its correlation strength with the failure mode identified.
Corrective Action Generation
The analysis concludes with structured corrective action recommendations tied directly to the identified root cause and contributing factors—not generic maintenance tasks. If the root cause is compressor fouling accelerated by inadequate inlet filter maintenance, the corrective actions address filter inspection intervals, wash frequency optimization, and inlet air quality monitoring—all with implementation priority scores based on consequence severity and recurrence probability.
Fleet-Wide Learning and Recurrence Prevention
Every confirmed RCA finding updates the platform's failure mode library for your specific equipment. If the same failure mode has appeared at other facilities in the fleet dataset, the system surfaces those cases with their corrective action outcomes—giving your plant the benefit of collective operational experience rather than isolated facility history. Over 12–18 months, facility-specific model precision improves significantly over baseline fleet models.
Want to see AI root cause analysis applied to your specific equipment configuration and failure history? Book a 30-minute diagnostic assessment with iFactory's power generation team.
Failure Modes AI RCA Diagnoses Across Power Plant Equipment
The diagnostic value of AI root cause analysis is proportional to how deeply the platform understands the specific failure modes of power generation equipment. Generic industrial AI platforms with no equipment-specific training produce anomaly scores; purpose-built power generation platforms identify the failure mode, the mechanism, and the corrective action with specificity that engineers can act on immediately.
Ready to move from reactive investigation to predictive failure prevention? Schedule your plant diagnostic assessment with iFactory's power generation analytics team.
AI RCA vs. Traditional Investigation: A Direct Comparison
The performance gap between AI-assisted and traditional manual root cause analysis is most visible in two dimensions: the time from failure event to actionable diagnosis, and the depth of contributing factor identification. Here is how the two approaches compare across every metric that matters to a plant manager operating under time and resource constraints.
Measured Outcomes: What Plants Achieve with AI Root Cause Analysis
The business case for AI root cause analysis rests on a straightforward value chain: better diagnosis leads to more targeted corrective actions, which leads to fewer repeat failures, which leads to lower unplanned outage frequency and duration. The financial impact of that chain compounds over time as the platform accumulates facility-specific failure history and model precision improves.
Expert Review: What a Credible AI RCA Platform Must Deliver
Having supported root cause analysis investigations across more than thirty small and mid-size power generation facilities over two decades, the difference between platforms that actually reduce repeat failures and platforms that merely document them is consistent and identifiable before you sign a contract. Here is the evaluation checklist every plant manager should apply.
Conclusion
Repeat equipment failures are not inevitable—they are the predictable result of root cause analysis that identifies symptoms rather than causes, addresses the wrong contributing factors, and closes out work orders before the corrective action has been validated. AI-powered root cause analysis changes the diagnostic baseline for smaller power plants: automatically correlating data across every sensor channel, reconstructing precursor timelines extending weeks before failure events, and generating corrective actions that trace directly to the identified cause rather than to generic inspection checklists.
The plants that compound the strongest reliability improvements over the next five years will be those that build a systematic failure knowledge base starting now—before the next forced outage, not after it. iFactory's AI RCA platform is designed to accelerate that process: deployable without control system disruption, producing actionable findings within weeks, and improving diagnostic precision continuously as facility-specific failure history accumulates.
Ready to move from reactive investigation to predictive failure prevention? Schedule your plant diagnostic assessment with iFactory's power generation analytics team.
Frequently Asked Questions
Stop Investigating the Same Failures Twice
iFactory's AI root cause analysis platform identifies why equipment fails—automatically, with full sensor evidence, and with corrective actions that prevent recurrence. Purpose-built for power plants under 500 MW, deployable in weeks.