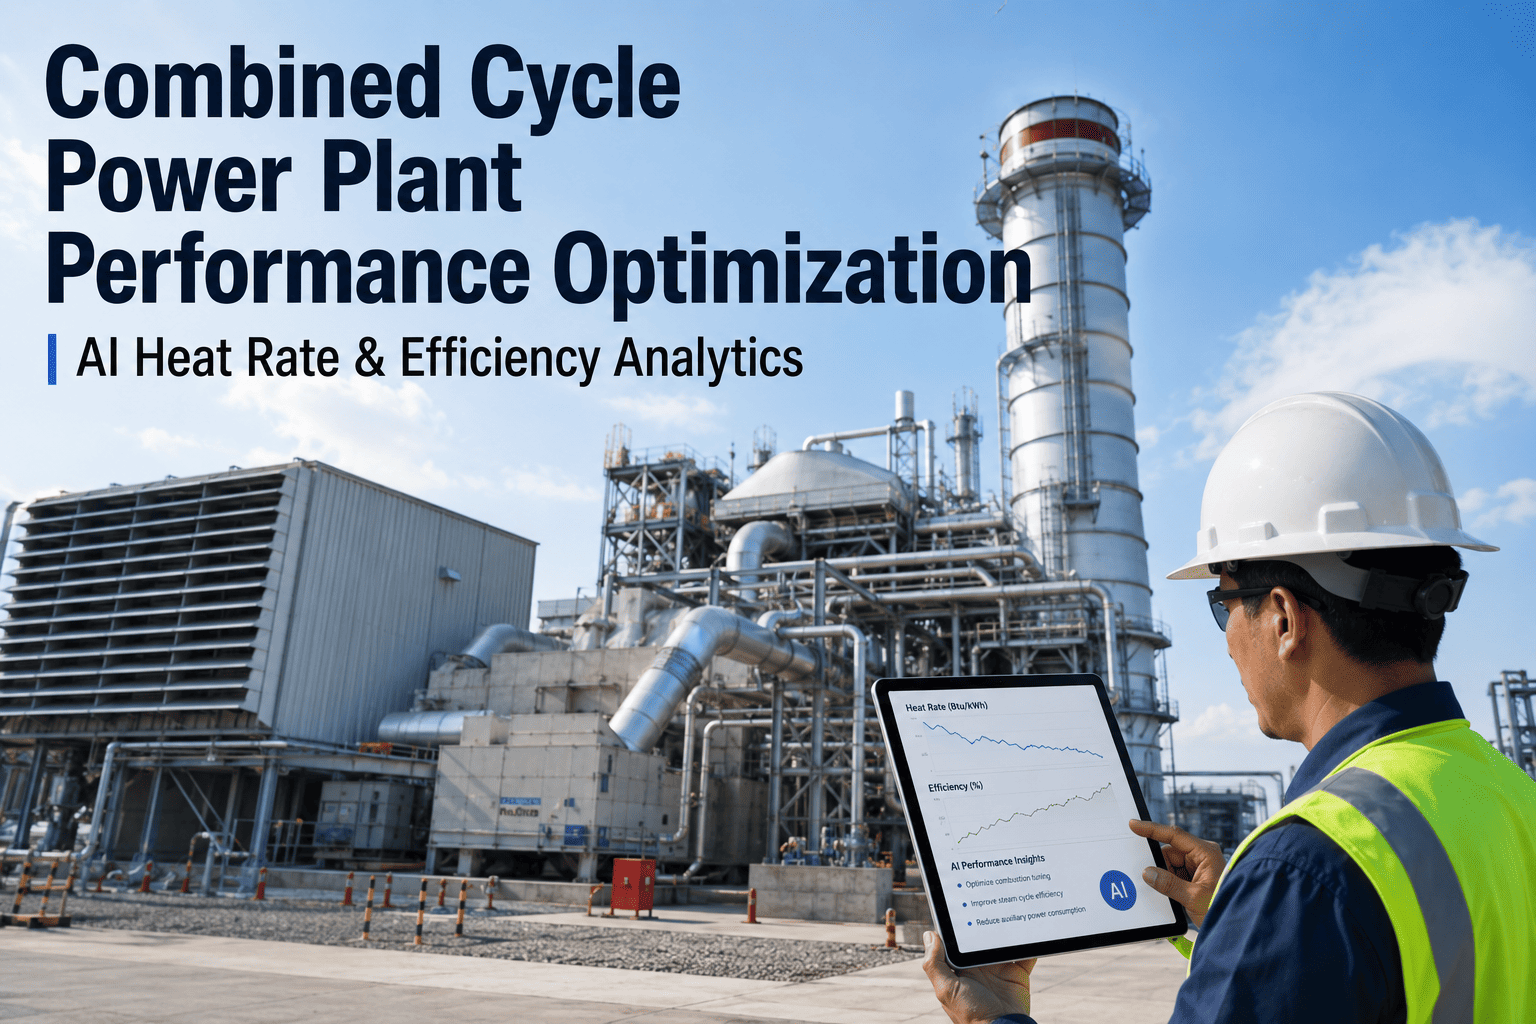
A heat recovery steam generator is the most thermally complex piece of equipment in a combined cycle plant — and, for most operators, the least monitored. Gas turbine health gets the analyst's attention. The steam turbine gets its vibration trending. But the HRSG sits between them silently degrading through tube fouling, flow distribution imbalance, drum chemistry drift, and duct burner degradation, until a forced outage makes the neglect impossible ignore.
The economics of that neglect are significant. A single HRSG tube failure in a 300 MW combined cycle plant can generate $800,000 to $2.4 million in forced outage costs when replacement power, repair mobilization, and lost capacity payments are fully accounted for. Most of those failures are not sudden — they are the predictable endpoint of degradation trend that AI-driven HRSG analytics would have flagged 14 to 45 days earlier. This guide explains exactly what purpose-built HRSG analytics software monitors, how the diagnostic chain works, and what combined cycle operators should demand from any platform they evaluate.
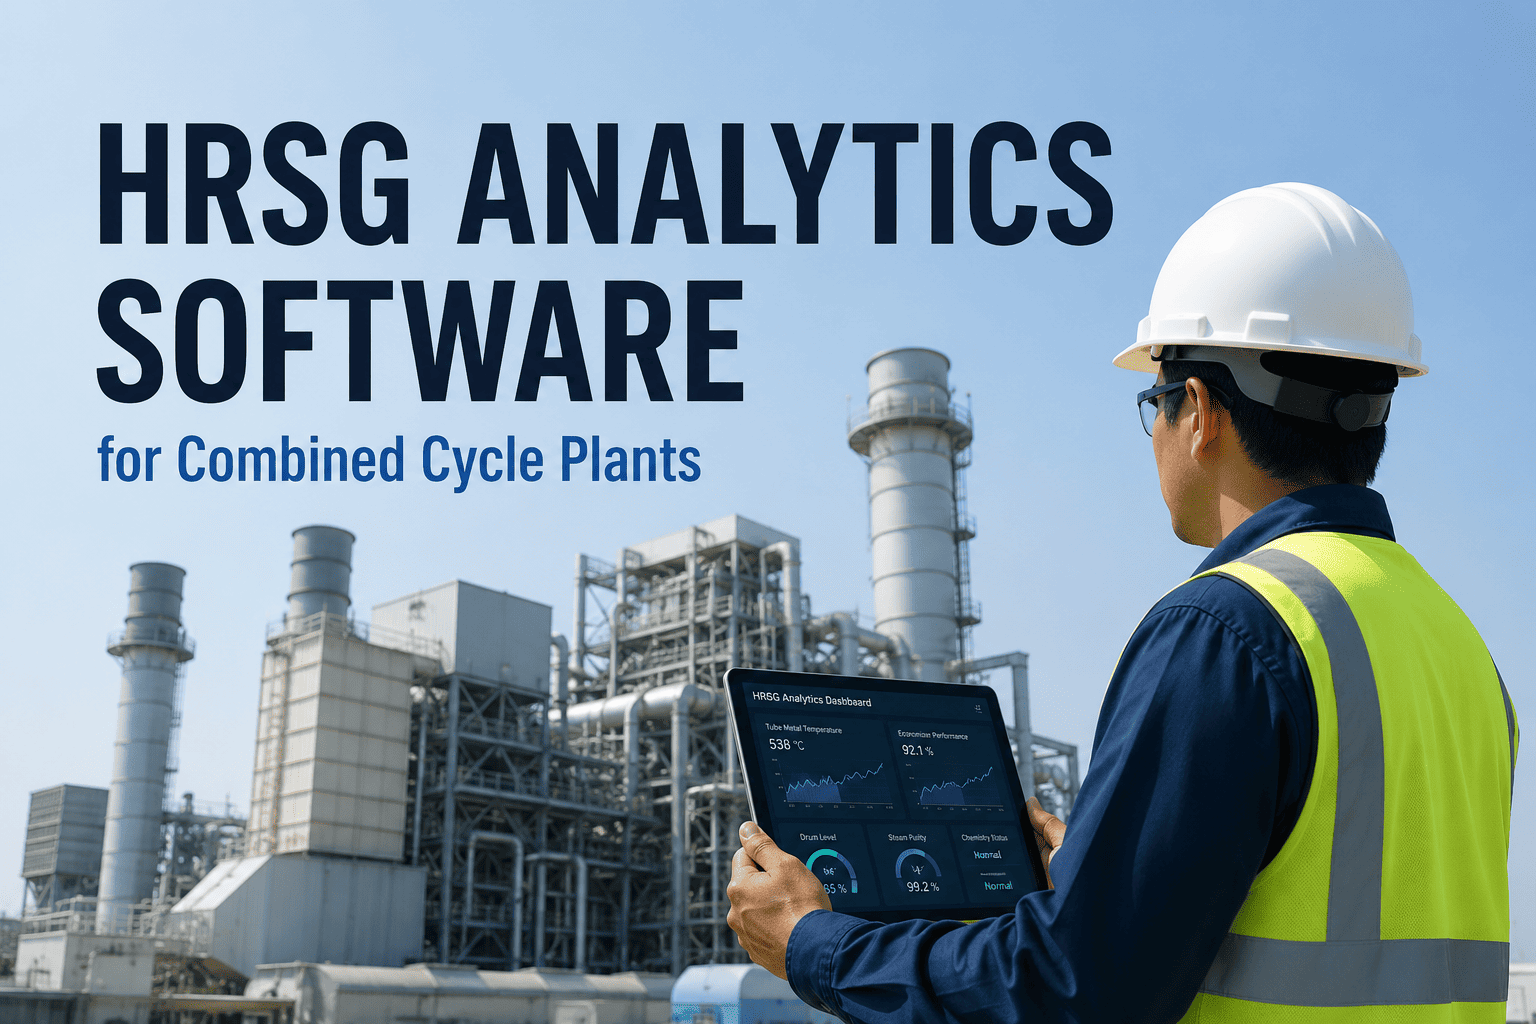
HRSG Analytics Software for Combined Cycle Plants
AI-driven tube failure prediction, economizer trending, and drum chemistry monitoring — purpose-built for HRSGs at combined cycle facilities under 500 MW. Prevent multi-million dollar forced outages before they start.
Why the HRSG Is the Most Undermonitored Asset in a Combined Cycle Plant
Combined cycle plants are monitored at the gas turbine and steam turbine with varying levels of sophistication. The HRSG — which contains hundreds of tube circuits across multiple pressure levels, complex flue gas duct, and a water chemistry system with narrow operating margins — is often managed with little more than approach temperature trending and periodic visual inspection. That monitoring gap exists for three predictable reasons.
Complexity Without Coverage
A typical HRSG has 400 to 800 monitored parameters across high-pressure, intermediate-pressure, and low-pressure sections. Most DCS configurations alarm on individual setpoint violations but do not correlate those signals into system-level degradation patterns.
Slow-Developing Failure Modes
HRSG tube failures rarely occur without weeks of preceding degradation. Flow-accelerated corrosion, oxide scale buildup, and acid dewpoint damage all progress gradually — below the threshold of standard alarm systems but fully detectable by continuous multivariate analysis.
High Consequence, Low Frequency
Because major HRSG failures are relatively infrequent at any individual plant, operators tend to underweight the risk. Fleet-wide data tells a different story: tube failures are the leading cause of forced outages at combined cycle plants over 10 years of operation, with average per-incident costs exceeding $1.2 million.
What HRSG Analytics Software Actually Monitors:
Purpose-built HRSG analytics software is not a general-purpose industrial monitoring platform pointed at steam generator parameters. The highest-value platforms come with pre-built thermodynamic models and failure mode libraries specific to horizontal and vertical HRSG configurations, covering the four systems where degradation has the highest consequence impact.
Tube Health Monitoring and Failure Prediction
Tube failures account for the majority of HRSG-related forced outages and are almost universally preceded by detectable degradation signals. AI analytics correlates tube metal temperatures, flue gas temperature profiles, steam-side differential pressures, and flow imbalance indicators to identify developing tube issues weeks before leak detection or visual evidence becomes available.
- Flow-accelerated corrosion detection via differential pressure trending in LP and IP circuits
- Oxide scale buildup prediction from tube metal temperature exceedance accumulation
- Thermal stratification identification in steam drum inlet and outlet headers
- Early tube leak indication from feedwater flow imbalance between circuits
Economizer Performance and Fouling Detection
The economizer is the first heat transfer surface contacted by flue gas and the most susceptible to external fouling from combustion byproducts. Fouling reduces heat transfer efficiency, increases flue gas exit temperature, and raises heat rate — often by 0.1 to 0.3% before any operator notices a change in approach temperature. AI-driven economizer monitoring tracks these changes continuously and quantifies the financial cost of current fouling levels against cleaning intervention cost.
- Approach temperature tracking corrected for ambient conditions and load factor
- Flue gas exit temperature trending normalized against GT exhaust conditions
- Heat transfer coefficient deterioration rate with cleaning ROI calculation
- Acid dewpoint proximity monitoring for low-load and startup operation
Drum Chemistry Monitoring and Corrosion Prevention
Steam drum water chemistry is the most consequential and most neglected monitoring domain in a combined cycle HRSG. pH excursions, conductivity spikes, and dissolved oxygen ingress all cause corrosion damage that accumulates invisibly until a tube fails or a feedwater heater requires replacement. AI-driven chemistry monitoring tracks all three pressure levels continuously and integrates chemistry data with flow and temperature signals to identify the process conditions driving excursions.
- pH and conductivity trending at HP, IP, and LP drum levels independently
- Dissolved oxygen ingress detection correlated with startup cycling frequency
- Chemistry excursion root cause identification — condensate contamination vs. makeup water quality vs. chemical dosing drift
- Cumulative corrosion damage estimation from integrated out-of-spec time exposure
Duct Burner Performance and Degradation Monitoring
Duct burners are used at combined cycle plants to supplement heat input during peak demand periods or to maintain steam output when the gas turbine is at reduced load. Duct burner degradation — burner tip fouling, flame pattern distortion, and fuel control valve drift — reduces supplemental firing efficiency and can create localized overtemperature conditions in the HRSG that accelerate tube wear in the superheater and reheater sections immediately downstream.
- Flue gas temperature uniformity monitoring across duct cross-section during firing
- Fuel-to-heat output efficiency trending corrected for ambient and GT exhaust conditions
- Combustion control valve position vs. flow anomaly detection for valve drift identification
- NOx emissions impact correlation with burner performance degradation
Want to see how HRSG analytics applies to your specific unit configuration and pressure levels? Book a 30-minute technical assessment with iFactory's power generation team.
HRSG Failure Mode Matrix: What AI Analytics Catches and When
The following table maps the primary HRSG failure modes at combined cycle plants against the specific sensor signals that AI analytics uses to detect them, the typical detection lead time before failure, and the consequence severity without early intervention. This is the analytical core of what separates a monitoring platform from a diagnostic one.
| Failure Mode | Affected Section | Primary AI Detection Signals | Detection Lead Time | Avg. Outage Cost (Undetected) |
|---|---|---|---|---|
| Flow-Accelerated Corrosion | LP Evaporator / Economizer | Circuit differential pressure drop, feedwater flow imbalance, tube wall thickness proxy from heat transfer trending | 21–45 days | $800K–$1.6M |
| Oxide Scale Exfoliation | HP Superheater / Reheater | Tube metal temperature exceedance accumulation, steam purity deterioration, turbine blade erosion precursors | 30–60 days | $1.2M–$3.0M |
| External Fouling | Economizer / Evaporator | Approach temperature creep, flue gas exit temperature rise, heat transfer coefficient decline | 7–21 days | $120K–$400K (performance loss) |
| Acid Dewpoint Corrosion | LP Economizer Inlet | Flue gas temperature vs. dewpoint margin, pH trending in LP circuit, condensate conductivity | 7–30 days | $600K–$1.4M |
| Drum Chemistry Excursion | All Pressure Levels | pH, conductivity, dissolved oxygen multivariate trending across HP / IP / LP circuits | 3–14 days | $200K–$800K (cumulative) |
| Duct Burner Degradation | Superheater / Reheater | Temperature nonuniformity across duct, firing efficiency decline, valve position anomaly | 14–30 days | $300K–$900K |
| Steam Drum Level Instability | HP / IP Drum | Feedwater control valve hunting, level sensor cross-check deviation, BFP performance curve shift | 3–7 days | $400K–$1.0M |
Ready to close the monitoring gap on your HRSG? Schedule your plant assessment with iFactory's combined cycle analytics team.
How AI-Driven HRSG Analytics Works: From Sensor to Corrective Action
The value of AI-driven HRSG analytics is proportional to how much of the diagnostic chain the platform automates — from raw sensor data to a specific, financially quantified recommendation that an operator can act on without a reliability engineer on staff. The following workflow traces that chain for a combined cycle HRSG deployment.
Data Ingestion from Existing Plant Infrastructure
The platform connects to the plant DCS historian via read-only OPC-UA, PI, or direct historian export — no control system modifications, no new sensors required. For a typical combined cycle HRSG, this includes 400 to 800 process tags across all three pressure levels, the flue gas duct, water chemistry analyzers, and BFP / condensate pump systems. Data normalization and bad-actor tag identification are completed within the first 48 hours of connection.
Physics-Based HRSG Performance Baselining
Pre-built thermodynamic models establish expected HRSG performance at given GT exhaust conditions, ambient temperature, and load factor. Approach temperatures, pinch points, heat transfer coefficients, and steam production rates are all calculable from first principles — deviations from those expectations signal actual degradation rather than normal operational variation. This physics-based layer produces useful baselines immediately, before months of operating history accumulate.
Multivariate Anomaly Detection Across All Systems
Machine learning models trained on HRSG failure histories run continuously against normalized sensor streams. When a developing pattern matches a known failure precursor — tube circuit differential pressure creep, chemistry excursion signature, flue gas temperature nonuniformity — the system flags the specific failure mode with a confidence score. Unlike threshold alarms, these models detect the subtle multivariate correlations that precede tube failures weeks before any single parameter crosses a trip setpoint.
Financial Impact Quantification
Detected anomalies are translated directly into financial terms before reaching the operator. A fouling condition on the HP economizer section is expressed as a current heat rate penalty in BTU/kWh, a daily fuel cost increment in dollars, and a projected forced outage cost if left unaddressed. This financial layer connects equipment condition to the operating margin metric that plant owners manage to — making prioritization decisions straightforward even without a dedicated reliability engineer on staff.
Ranked Work Order Generation and CMMS Integration
High-confidence findings automatically generate draft work orders in the connected CMMS — SAP PM, Maximo, or Infor EAM — with failure mode classification, recommended inspection scope, and suggested parts requirements pre-populated. Plant managers see a ranked list of prioritized actions, not a list of anomaly alerts, with the financial case for each action quantified so that outage scheduling decisions can be made based on actual risk, not calendar intervals.
Continuous Model Improvement from Facility Operating History
Every confirmed finding, missed event, and false positive feeds back into model refinement. After 6 to 12 months of operation, facility-specific HRSG models — tuned to the specific GT exhaust profile, fuel type, cycling pattern, and water chemistry characteristics of the plant — outperform generic fleet models on both detection lead time and false positive rate. The diagnostic value of the platform compounds over time as the model learns the operating signature of each specific unit.
Measured Outcomes: What Combined Cycle Plants Achieve with HRSG Analytics
The ROI case for HRSG analytics at combined cycle plants is built on a short list of high-consequence, high-frequency value drivers — not on a long list of marginal improvements. The figures below reflect outcomes reported by U.S. combined cycle facilities under 500 MW operating AI-driven HRSG analytics platforms within their first 18 months of deployment.
Ready to close the monitoring gap on your HRSG? Schedule your plant assessment with iFactory's combined cycle analytics team.
Expert Review: What HRSG Analytics Vendors Rarely Tell You in a Demo
After supporting HRSG analytics implementations at more than fifteen combined cycle plants across the U.S., the evaluation errors that cost plant managers the most time and money are consistent and avoidable. Here is the checklist that separates platforms that actually prevent tube failures from platforms that generate impressive dashboards.
Conclusion
The HRSG monitoring gap at combined cycle plants is not a technology problem anymore — it is a prioritization problem. Purpose-built HRSG analytics platforms with physics-based performance baselines, circuit-level tube monitoring, integrated drum chemistry diagnostics, and AI anomaly detection are deployable in weeks at combined cycle facilities under 500 MW, at cost structures that produce positive ROI within the first year from a single avoided tube failure event alone.
The plants that will generate the strongest reliability returns over the next decade are those that begin monitoring the HRSG with the same analytical rigor currently applied to the gas turbine — not because the risk is greater, but because the detection opportunity is enormous and largely untapped. iFactory's HRSG analytics platform is designed for exactly that gap: deployable without control system disruption, financially quantified from day one, and improving in precision as facility-specific operating history accumulates.
Ready to close the monitoring gap on your HRSG? Schedule your plant assessment with iFactory's combined cycle analytics team.
Frequently Asked Questions
Purpose-Built HRSG Analytics for Combined Cycle Plants
From tube failure prediction to drum chemistry diagnostics, iFactory delivers AI-driven HRSG intelligence sized for facilities under 500 MW — deployable in weeks, with ROI measurable in months.