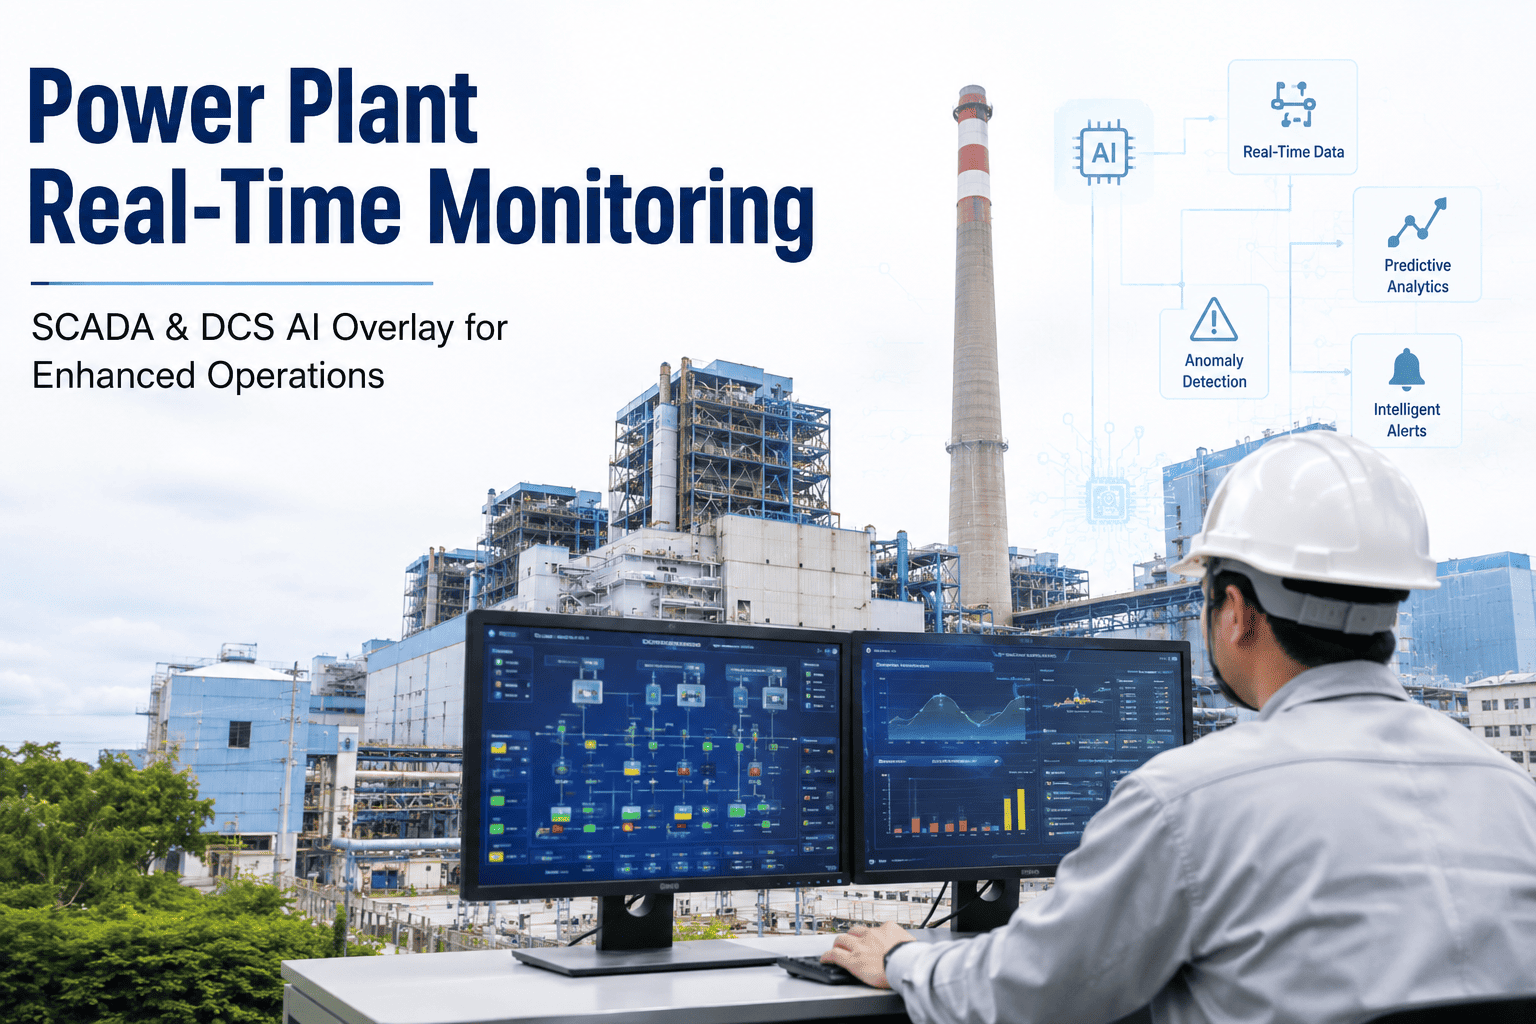
A control room operator watching a 500 MW turbine generator shouldn't need to wait until the next scheduled vibration route — three days from now — to know that the bearing temperature climbed 8°C in the last hour. By the time the vibration analyst arrives with the data collector, the bearing has already degraded past the point where condition-based intervention was possible, and the plant faces a choice between immediate forced outage or continued operation with escalating failure risk. iFactory's real-time equipment monitoring streams sensor data from every critical asset — vibration, temperature, pressure, flow, electrical parameters — into a unified dashboard where AI-driven anomaly detection flags deviations the moment they occur. The three-day data gap that turned predictable degradation into emergency shutdowns now closes to seconds, giving operators and reliability engineers the live visibility needed to intervene before failures develop. Book a demo to see real-time monitoring in action.
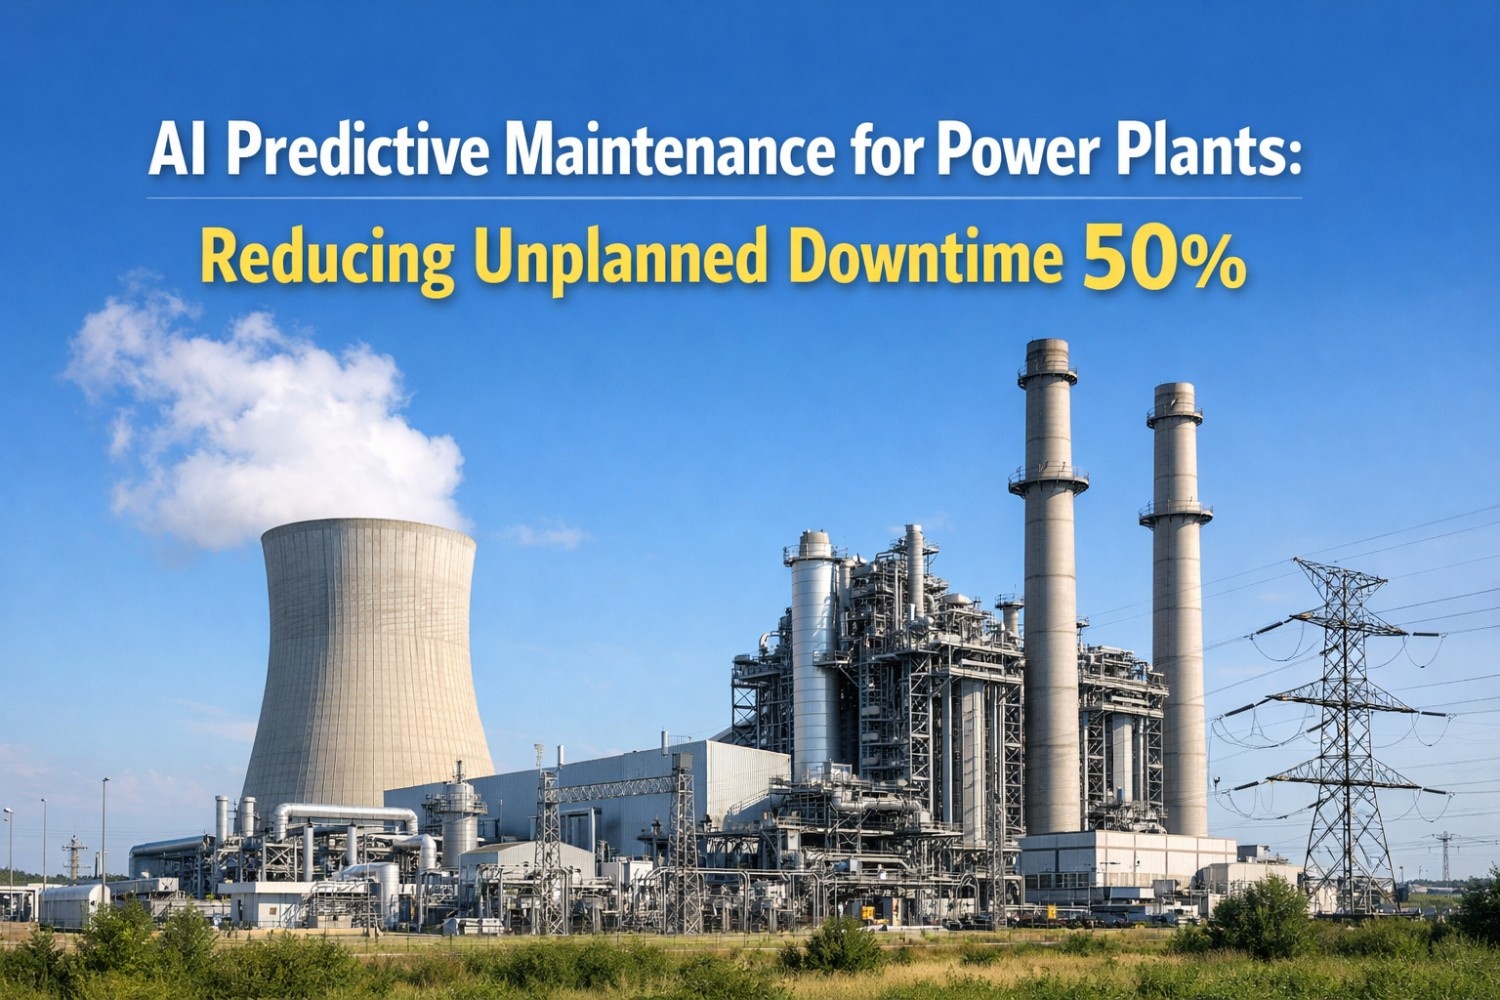
iFactory's real-time equipment monitoring platform continuously ingests sensor data from critical power plant assets — vibration, temperature, pressure, flow, electrical parameters — and applies AI-driven anomaly detection to identify developing faults within seconds of occurrence. Operators receive live dashboard views of equipment health status across the entire plant, with instant mobile alerts when thresholds are breached or degradation patterns emerge. Average result: 82% reduction in time-to-detection for critical faults, 4.7x improvement in predictive maintenance lead time versus periodic monitoring routes.
How Real-Time Monitoring Detects Faults Before Scheduled Routes
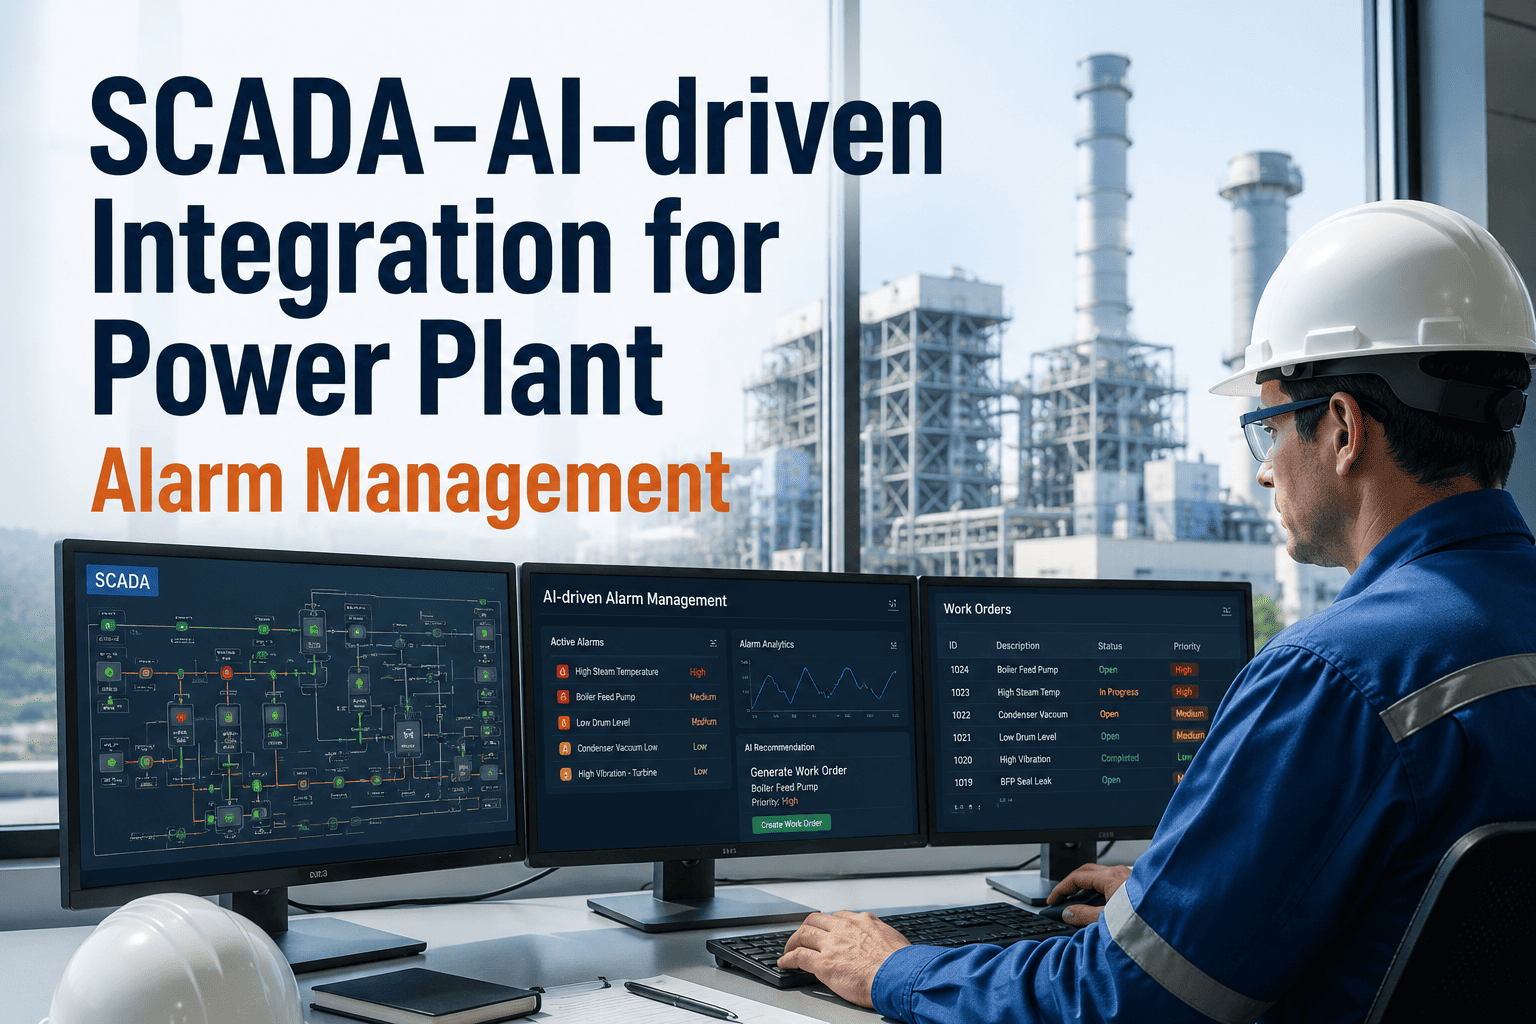
The pipeline below shows the four-stage process iFactory applies to continuous sensor data streams — from raw signal acquisition through anomaly detection, operator alerting, and work order generation.
See how iFactory's continuous monitoring closes the gap between fault onset and detection — giving your team the lead time needed to plan maintenance instead of fighting emergencies.
Monitoring Gaps That Periodic Routes Cannot Close
Every card below represents a failure mode that develops between scheduled monitoring intervals — causing forced outages that real-time monitoring would have prevented. These gaps exist because traditional vibration routes, thermography scans, and oil sampling happen weekly or monthly, while critical faults can develop in hours or days. Talk to an expert about continuous monitoring for your critical assets.
Real-time fix: Continuous vibration monitoring detects elevated bearing frequencies within hours of onset. Alert generated Thursday evening with 11-day RUL forecast, giving maintenance team full week to plan intervention during scheduled outage.
Real-time fix: Continuous monitoring captures transient events regardless of when they occur. Cavitation signature detected during load spike, correlated with process parameters to identify root cause, work order created to adjust suction pressure setpoint.
Real-time fix: Continuous motor current signature analysis detects insulation resistance drop Sunday afternoon. Alert routed to on-call electrical supervisor, motor de-energized remotely before complete failure, emergency repair scheduled for Monday with minimal downtime.
Real-time fix: Operator presses "Report Observation" button on HMI. System correlates observation timestamp with sensor data, confirms elevated vibration trend starting 6 hours earlier, generates inspection work order with objective evidence for day shift follow-up.
Real-time fix: Continuous monitoring builds dynamic baselines across full operating envelope — 40% to 100% load, startup, shutdown, every operating mode. AI learns normal behavior at each condition and flags deviations specific to current operating state, eliminating load-dependent false positives.
Real-time fix: System ingests vibration, pressure, flow, and temperature simultaneously. AI correlates vibration spike with low suction pressure event, identifies hydraulic instability as root cause, routes work order to I&C technician to investigate pressure control valve instead of mechanical bearing inspection.
Real-Time Dashboard — Live Equipment Health Across the Plant
iFactory's control room dashboard provides operators and reliability engineers with a unified view of equipment health status across all monitored assets — updated continuously with color-coded health indicators, active alerts, and trend visualizations.
Monitoring Coverage by Equipment Type
The table below shows the sensor parameters iFactory monitors for each major equipment category in power generation facilities — and the failure modes those parameters detect.
| Equipment Type | Monitored Parameters | Detectable Failure Modes | Update Frequency |
|---|---|---|---|
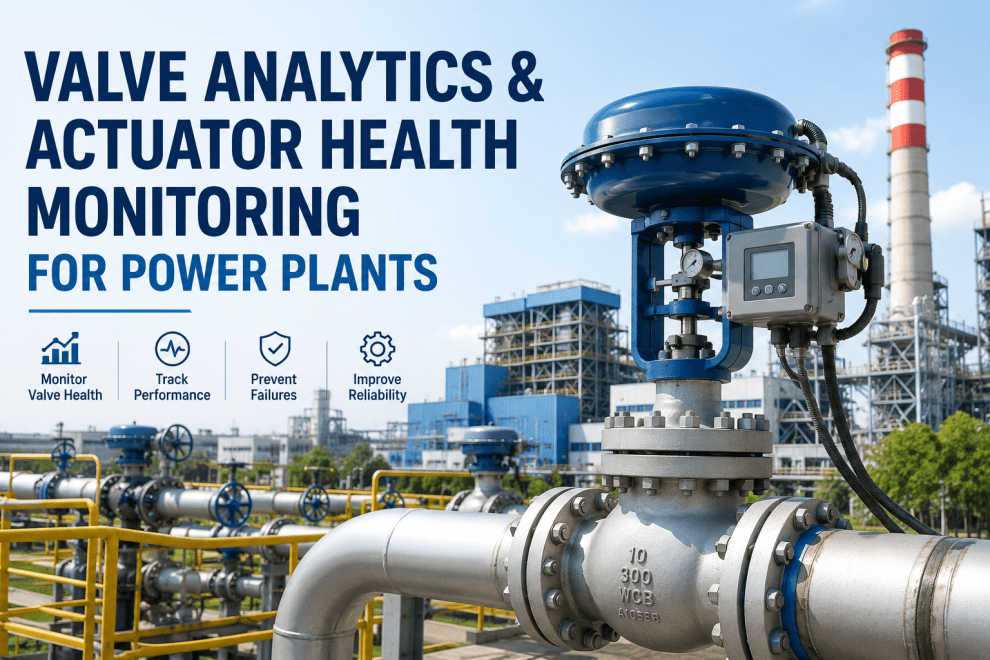
| Pumps (Centrifugal, Positive Displacement) | Vibration (accel/velocity), bearing temp, motor current, discharge pressure, flow rate, suction pressure | Bearing defects, impeller damage, cavitation, misalignment, imbalance, seal leakage, hydraulic instability | 10-60 seconds |
| Steam/Gas Turbines | Vibration (shaft, casing), bearing temp, thrust position, eccentricity, speed, steam/exhaust temp, pressure | Bearing wear, blade fouling, rotor unbalance, rub, thrust bearing failure, blade damage, nozzle blockage | 1-10 seconds |
| Generators | Stator temp, rotor temp, vibration, bearing temp, hydrogen purity, cooling water flow, partial discharge, power output | Stator winding insulation, rotor shorted turns, bearing degradation, cooling system failure, hydrogen seal leaks | 5-30 seconds |
| Motors (Induction, Synchronous) | Motor current (3-phase), voltage, bearing temp, winding temp, vibration, power factor, harmonic distortion | Bearing defects, rotor bar cracks, winding insulation, eccentricity, voltage imbalance, phase loss, overload | 10-60 seconds |
| Compressors (Centrifugal, Reciprocating) | Vibration, discharge temp/pressure, suction temp/pressure, motor current, oil pressure, piston rod drop | Bearing wear, blade damage, surge, fouling, valve leakage, piston ring wear, crosshead bearing failure | 5-30 seconds |
| Transformers | Oil temp, winding temp, load current, dissolved gas (H2, C2H2, CH4, C2H4), bushing temp, partial discharge | Overheating, insulation degradation, arcing, partial discharge, bushing failure, oil contamination | 1-10 minutes |
| Fans/Blowers | Vibration, bearing temp, motor current, airflow, inlet/outlet pressure, damper position | Bearing defects, blade imbalance, blade fouling, misalignment, loose mounting, damper linkage wear | 10-60 seconds |
| Gearboxes | Vibration (high frequency), oil temp, oil pressure, debris (magnetic chip detector), bearing temp, load torque | Gear tooth wear, bearing defects, misalignment, lubrication failure, gear tooth pitting/cracking | 10-60 seconds |
Platform Capability Comparison — Real-Time Monitoring
Traditional SCADA systems provide process monitoring but lack AI-driven anomaly detection. Periodic vibration programs offer predictive diagnostics but miss faults between routes. iFactory combines continuous data acquisition with real-time analytics — closing both gaps simultaneously. Book a comparison demo.
| Capability | iFactory | SCADA/DCS | Vibration Route Program | GE APM | Emerson AMS |
|---|---|---|---|---|---|
| Data Acquisition | |||||
| Continuous sensor streaming | 1-60 sec update rate | Process data only | Weekly/monthly snapshots | Continuous + routes | Continuous + routes |
| Multiparameter correlation | Vibration + process + electrical | Process only | Vibration only | Multi-domain | Multi-domain |
| Dynamic baseline learning | Load-corrected across operating envelope | Static alarm limits | Manual baseline updates | Adaptive baselines | Semi-adaptive |
| Analytics & Detection | |||||
| AI anomaly detection | ML + physics-based validation | Threshold alarms only | Analyst interpretation | AI-driven | AI-driven |
| Transient event capture | All events regardless of timing | Process upsets only | Misses between routes | Full capture | Full capture |
| RUL forecasting | Physics + ML hybrid models | Not available | Expert judgment | Advanced RUL | Basic RUL |
| Operator Interface | |||||
| Unified equipment health dashboard | Plant-wide asset view | Process mimic only | Analyst software only | Health dashboard | AMS Suite overview |
| Mobile alerts with context | Alert + trend + RUL + action | Alarm notification only | Email reports only | Mobile alerts | Mobile alerts |
| Auto work order generation | From alert to CMMS in seconds | Manual WO creation | Manual WO creation | Case management | Work notification |
Based on publicly available product documentation as of Q1 2025. Verify current capabilities with each vendor before procurement decisions.
Measured Outcomes Across Deployed Plants
iFactory's real-time monitoring platform closes the detection gap — streaming sensor data continuously, detecting anomalies within seconds, and alerting operators the moment degradation begins.
From the Field
Frequently Asked Questions
Continue Reading
iFactory's continuous monitoring platform streams sensor data from every critical asset, detects anomalies within seconds of occurrence, and alerts operators instantly — closing the detection gap that turns predictable degradation into emergency failures.