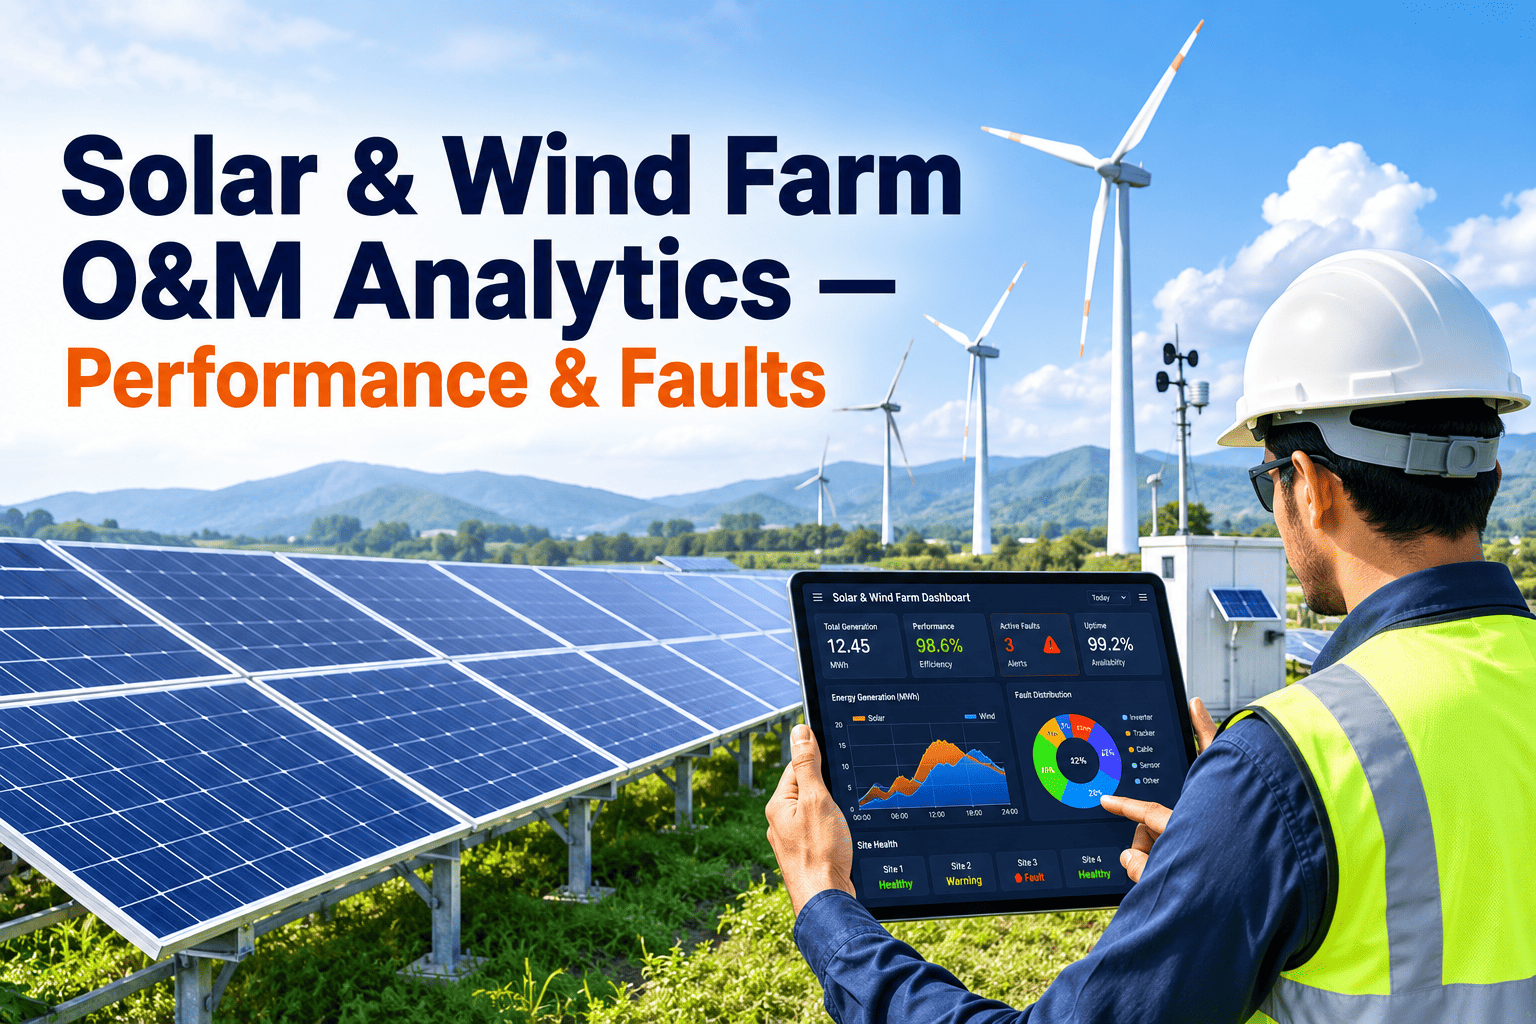
In the rapidly evolving landscape of renewable energy, solar and wind farms represent the cornerstone of global decarbonization efforts. However, maximizing energy yield and minimizing operational costs demands a paradigm shift from reactive maintenance to predictive, AI-driven O&M analytics. This comprehensive guide delves into the technical intricacies of monitoring solar inverter efficiency, wind turbine gearbox health, and farm-level output, leveraging advanced analytics to boost energy yield by 5–8% and reduce O&M costs by up to 20%. For plant managers and CTOs seeking to optimize asset performance, understanding these metrics is non-negotiable. Book a Demo to explore how iFactory's AI platform transforms your renewable energy operations.
Transform Your Solar & Wind Farm O&M
Leverage AI-driven analytics to boost energy yield 5–8% and cut costs 20%.
Critical Metrics for Solar Farm Performance
Solar farm efficiency hinges on real-time monitoring of key performance indicators (KPIs) that directly impact energy yield. Performance ratio (PR) measures actual output against theoretical maximum, typically ranging from 75% to 85% for well-maintained plants. Inverter efficiency—often above 98% for modern units—can degrade due to capacitor aging or IGBT faults. String-level current monitoring detects shading, mismatch, or soiling, while combiner box temperature tracking prevents fire risks. AC cable resistance monitoring identifies loose connections that cause power losses. Tracker motor current analysis reveals mechanical binding or misalignment. By aggregating these data streams, AI models predict failures before they occur, reducing downtime by 30%.
Inverter Efficiency
Track DC-AC conversion efficiency in real time. AI detects deviations >0.5% from baseline, flagging potential MPPT issues or thermal stress.
Target: >98%
PV String Performance
Monitor string currents and voltages at 1-minute intervals. AI identifies soiling, micro-cracks, or bypass diode failures with 95% accuracy.
Avg. PR: 82%
Soiling Detection
Compare clean vs. soiled panel output using irradiance-corrected ratios. AI schedules cleaning only when loss exceeds 3%, saving water and labor.
Yield Gain: 5%
Combiner Box Health
Thermal imaging and current sensors detect hot spots from loose lugs or failed fuses. AI predicts failure 72 hours in advance.
Reliability: 99%
Wind Turbine Gearbox Monitoring
Gearbox failures account for 20% of wind turbine downtime and are the most expensive single component to repair. Vibration analysis at high-frequency sampling (10 kHz) detects early-stage bearing spalling or gear tooth cracks. Oil debris monitoring identifies metallic wear particles, while temperature gradients across the gearbox reveal lubrication starvation. AI models fuse these signals to estimate remaining useful life (RUL) with ±5% accuracy. For example, a 2 MW turbine with a failing intermediate shaft bearing can be scheduled for replacement during low-wind periods, avoiding $150,000 in emergency repair costs. Predictive maintenance reduces gearbox-related O&M expenses by 25%.
| Component | Monitoring Parameter | Threshold | Failure Mode |
|---|---|---|---|
| Gearbox Bearings | Vibration (acceleration) | >10 g | Spalling, cracking |
| Gear Teeth | Vibration (velocity) | >20 mm/s | Tooth breakage, pitting |
| Oil Debris | Particle count | >1000/ml | Bearing wear, gear wear |
| Temperature | Oil sump temp | >85°C | Lubrication starvation |
Wind Turbine Pitch & Yaw Systems
Pitch control systems regulate blade angle to optimize power output and protect against overspeed. Hydraulic pitch actuators require monitoring of pressure, flow, and position feedback. AI detects seal leaks or valve sticking by analyzing response time deviations. Similarly, yaw systems align the nacelle with wind direction; excessive yaw error (>10°) reduces energy capture by 2–3%. Yaw motor current analysis reveals bearing wear or gearbox binding. Predictive models schedule yaw bearing greasing based on cumulative yaw angle, extending life by 40%.
5-8%
Energy Yield Improvement
20%
O&M Cost Reduction
30%
Downtime Reduction
Wind Tower Bolt Tensioning
Bolted connections in wind turbine towers are critical for structural integrity. Over 100 bolts per flange must be tensioned to precise specifications. Ultrasonic bolt tension monitoring measures elongation in real time, detecting loosening due to vibration or creep. AI analyzes trends across all bolts to identify patterns indicative of foundation settlement or flange deformation. A single loose bolt can lead to progressive failure; predictive alerts enable corrective tightening during scheduled maintenance, preventing catastrophic collapse.
Solar AC Cable Resistance
Monitor resistance in AC cables between inverters and transformers. Increase >5% indicates loose connections or corrosion, causing power loss and fire risk.
Tracker Motor Maintenance
Solar tracker motors drive panels to follow the sun. Current spikes indicate binding or gearbox wear. AI predicts failure 500 hours in advance.
Renewable Energy Curtailment
Curtailment occurs when grid cannot absorb excess power. AI forecasts curtailment events 24 hours ahead, enabling battery storage optimization or power purchase adjustments.
Optimize Your Renewable Assets
AI-driven analytics to maximize yield and minimize downtime. Start your digital transformation today.
Solar Farm Drone Inspection Integration
Drones equipped with thermal and high-resolution cameras provide aerial inspection of solar panels, detecting hot spots, cracks, and soiling. AI processes orthomosaic images to generate a digital twin of the farm, mapping each panel's health index. This data feeds into the O&M platform to prioritize cleaning or replacement. For a 100 MW farm, drone inspection reduces manual labor by 80% and identifies 95% of defects. Integration with SCADA systems enables automated work order generation.
Wind Farm Availability Optimization
Availability is the percentage of time a turbine is operational and generating power. Industry average is 97–98%, but top performers achieve 99.5%. AI models predict component failures and optimize maintenance schedules to minimize downtime. For example, scheduling a gearbox oil change during low-wind periods (e.g., 3 AM) avoids curtailment. Real-time availability dashboards provide plant managers with actionable insights, improving overall fleet performance by 1.5%.
Frequently Asked Questions
How does AI improve solar inverter efficiency tracking?
AI algorithms analyze inverter DC input, AC output, and temperature data to detect anomalies such as MPPT drift, capacitor degradation, or IGBT faults. By comparing real-time performance against a baseline model, the system identifies efficiency drops as small as 0.3% and alerts operators. For example, a 500 kW inverter with a 1% efficiency loss wastes 5 kW continuously, costing $2,000 annually. Predictive maintenance restores efficiency within hours. Book a Demo to see how our platform tracks inverter health.
What is the role of vibration analysis in wind turbine gearbox monitoring?
Vibration analysis uses accelerometers mounted on gearbox bearings to measure high-frequency signals (up to 10 kHz). These signals are processed using FFT and envelope analysis to identify characteristic frequencies of bearing faults (e.g., BPFO, BPFI) or gear tooth meshing. AI classifiers distinguish between normal wear and imminent failure, providing 2–4 weeks of advanced warning. For a 2 MW turbine, this can save $100,000 in emergency repair costs. Contact support for integration details.
How does soiling detection work for solar panels?
Soiling detection compares the actual power output of a string to an irradiance-corrected expected output based on a clean baseline. The ratio, called the soiling loss, is calculated every 15 minutes. When loss exceeds a configurable threshold (e.g., 3%), the system triggers a cleaning alert. AI also accounts for seasonal soiling patterns (e.g., pollen in spring) to optimize cleaning schedules. This reduces water usage by 40% and increases annual yield by 2–3%. Book a Demo to learn more.
Can AI predict wind turbine yaw system failures?
Yes, AI monitors yaw motor current, position feedback, and nacelle orientation error. Yaw bearing wear manifests as increased current draw during rotation, while hydraulic yaw brake issues cause position overshoot. AI models classify these patterns and predict remaining useful life. For example, a turbine with 15% increase in yaw motor current over 6 months has a 70% probability of yaw bearing failure within 1 year. Contact support for case studies.
How does farm-level O&M analytics reduce curtailment?
Curtailment occurs when grid operators reduce renewable generation to prevent overloading. AI forecasts curtailment events using weather, grid load, and market data 24–48 hours ahead. Operators can then adjust battery storage dispatch or sell excess power in day-ahead markets. For a 200 MW solar farm, a 5% reduction in curtailment adds 10 GWh annually, worth $500,000 at $50/MWh. Book a Demo to see our curtailment dashboard.
Ready to Transform Your O&M?
Join industry leaders leveraging AI for 5-8% yield improvement. Get started now.
.png)