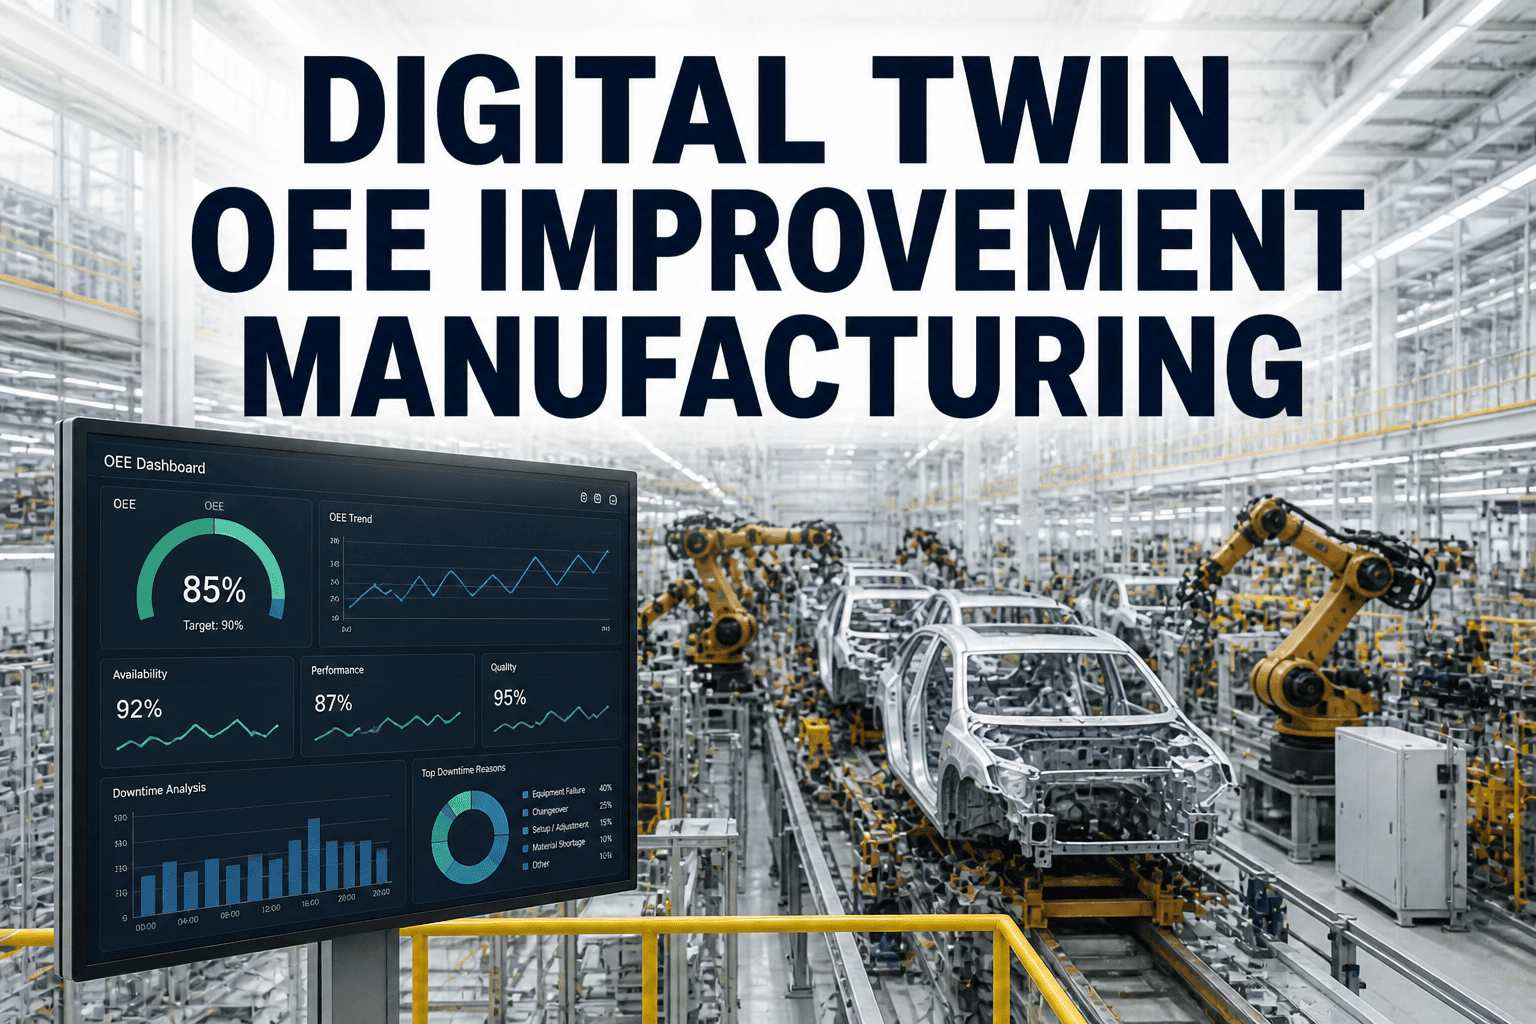
Automotive manufacturing plants operating complex assembly lines with robotic systems, multi-station production flows, and supply chain dependencies lose $4.2 to $18.6 million annually from production bottlenecks reducing throughput 12-28%, increasing cycle time variability 18-35%, and cascading delays through supply chains. Bottlenecks form when workstations, material handling, or robotic systems operate at unequal speeds: a welding station processing parts 5% slower than downstream assembly creates queue buildup, stalled conveyors, and idle labor. Manual bottleneck identification relies on production supervisors observing line flow during shifts, analyzing historical production data weekly, and implementing changes 5-10 days later missing real-time opportunities. iFactory AI Digital Twin Platform eliminates bottlenecks through real-time line monitoring tracking every part location and equipment utilization, machine learning identifying dynamic constraints shifting with production schedules, immediate bottleneck alerts enabling hour-level response vs daily reviews, and automated optimization recommendations increasing throughput 12-28%, reducing cycle time variability 22-35%, and improving overall equipment effectiveness (OEE) from 72% to 88%. Within 8 weeks, automotive manufacturers remove production bottlenecks capturing $1.8 to $6.4 million annual throughput gains, improve supply chain predictability reducing expedited logistics and inventory safety stock, and achieve competitive production efficiency enabling flexible EV and traditional vehicle mixing. Book a demo to see how iFactory digital twins eliminate your production bottlenecks.
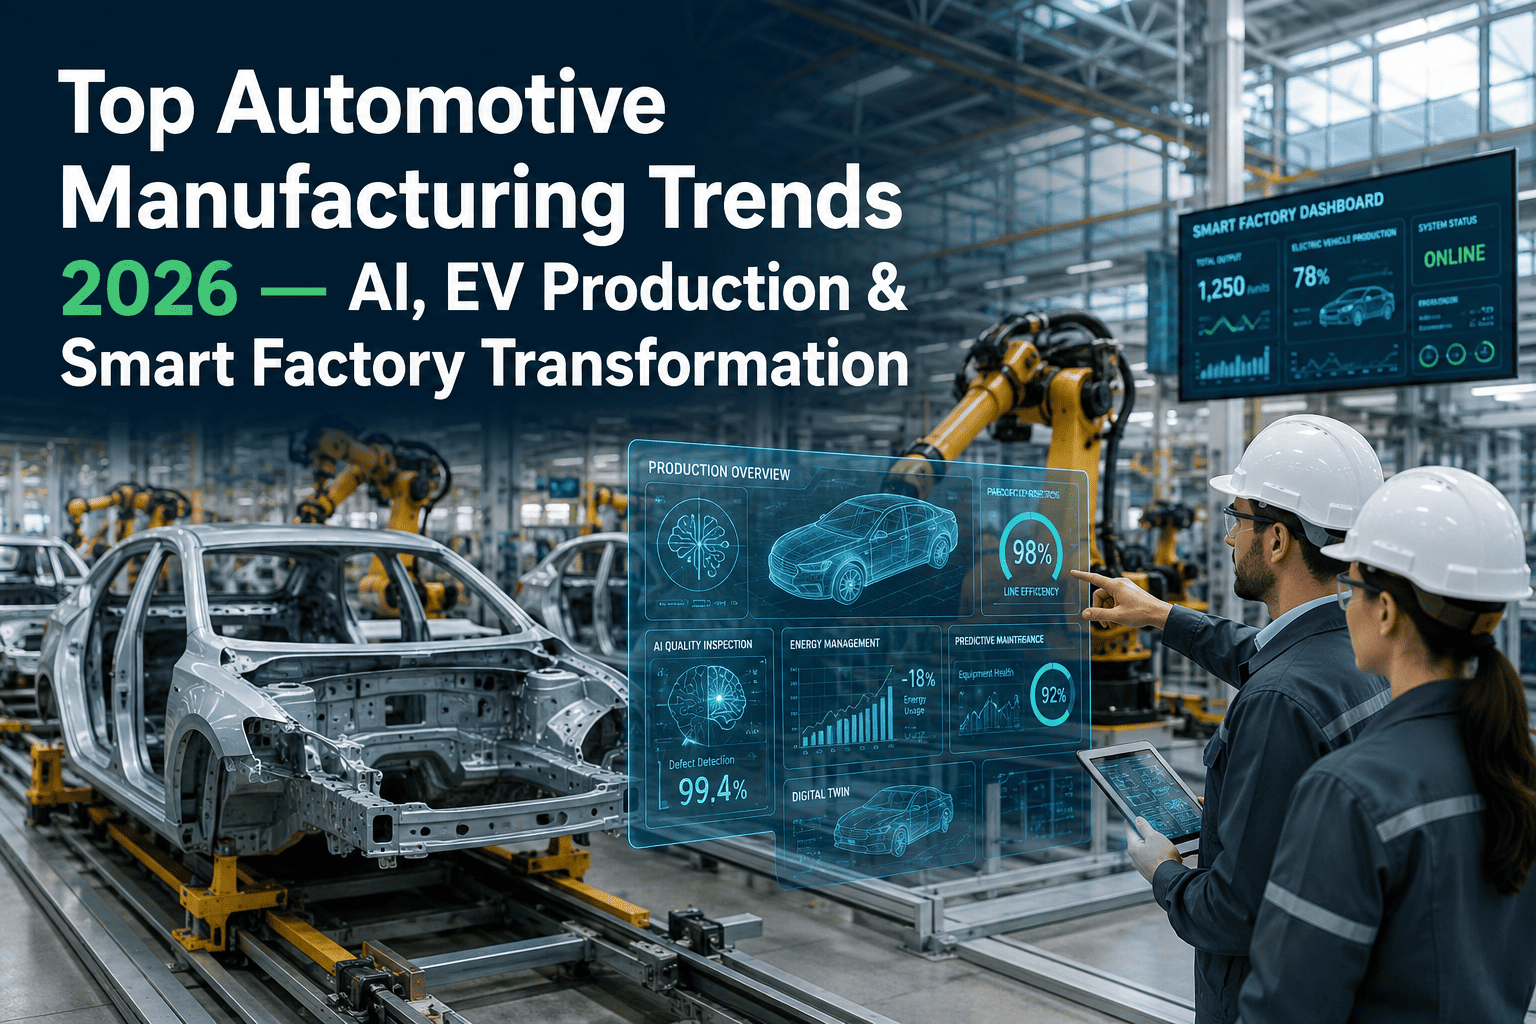
The Automotive Manufacturing Bottleneck Crisis
Automotive assembly plants operate complex multi-station production lines with 200-500+ equipment pieces (welding robots, material handlers, assembly stations, inspection systems, conveyors) moving 500-2,000 vehicles daily through 8-48 hour production cycles. Downtime costs rose 113% since 2019 reaching $22,000 per minute of line stoppage across major OEMs. Production bottlenecks reduce throughput 12-28% compared to theoretical maximum: a plant designed for 2,000 vehicles daily produces only 1,550-1,760 due to constraint workstations limiting flow. Bottlenecks form from multiple sources: robot cycle time drift (robot programmed for 60 seconds but actually 63 seconds due to wear), workstation velocity imbalance (welding: 50 seconds per part, assembly: 48 seconds), material supply delays (parts arriving late creating queue starvation), and equipment downtime (one station failure backs up entire downstream). Current bottleneck management relies on production supervisors observing line performance, compiling data from MES systems showing total production but not WIP (Work-In-Progress) location or equipment utilization, and implementing fixes 5-10 days after identification. A workstation bottleneck discovered Tuesday during shift review isn't optimized until Friday or Monday, losing 3-5 days of potential throughput gain. Bottlenecks shift with production schedules: Model A assembly bottleneck may be different workstation than Model B bottleneck due to process differences. Manual analysis cannot track this dynamic constraint movement, preventing systematic optimization. The compounded effect: $4.2-18.6 million annual bottleneck costs from lost throughput, cycle time variability creating supply chain disruption (downstream suppliers starved for parts, upstream suppliers overwhelming with inventory), and increased inventory carrying costs (12-18% higher safety stock required to buffer unpredictable throughput).
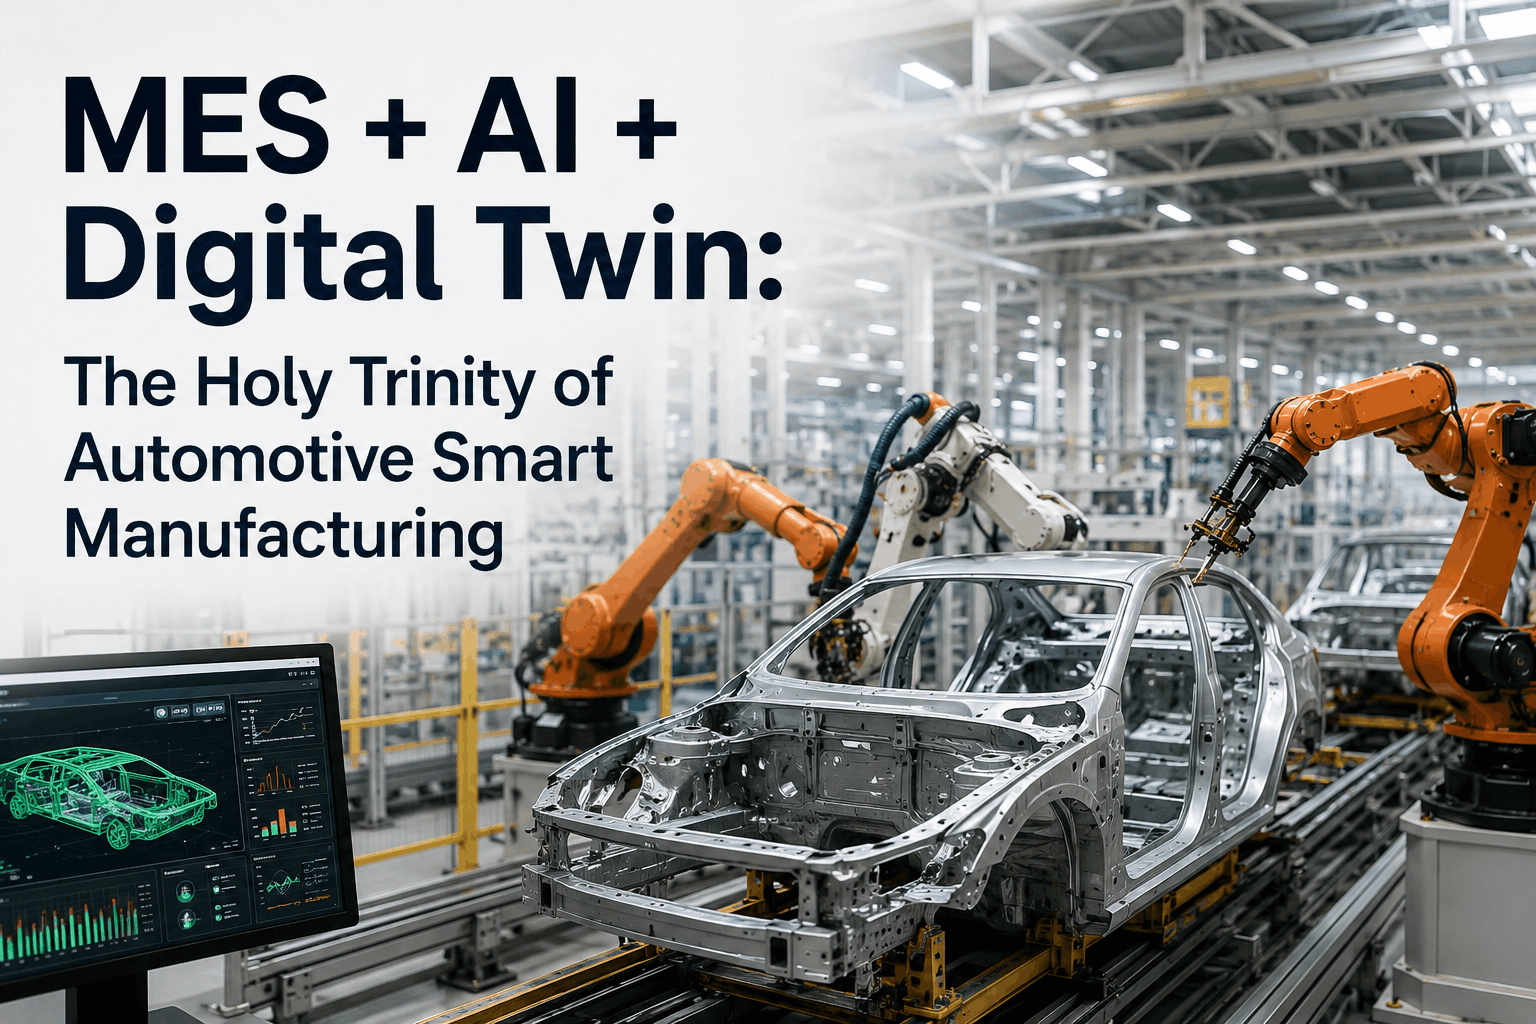
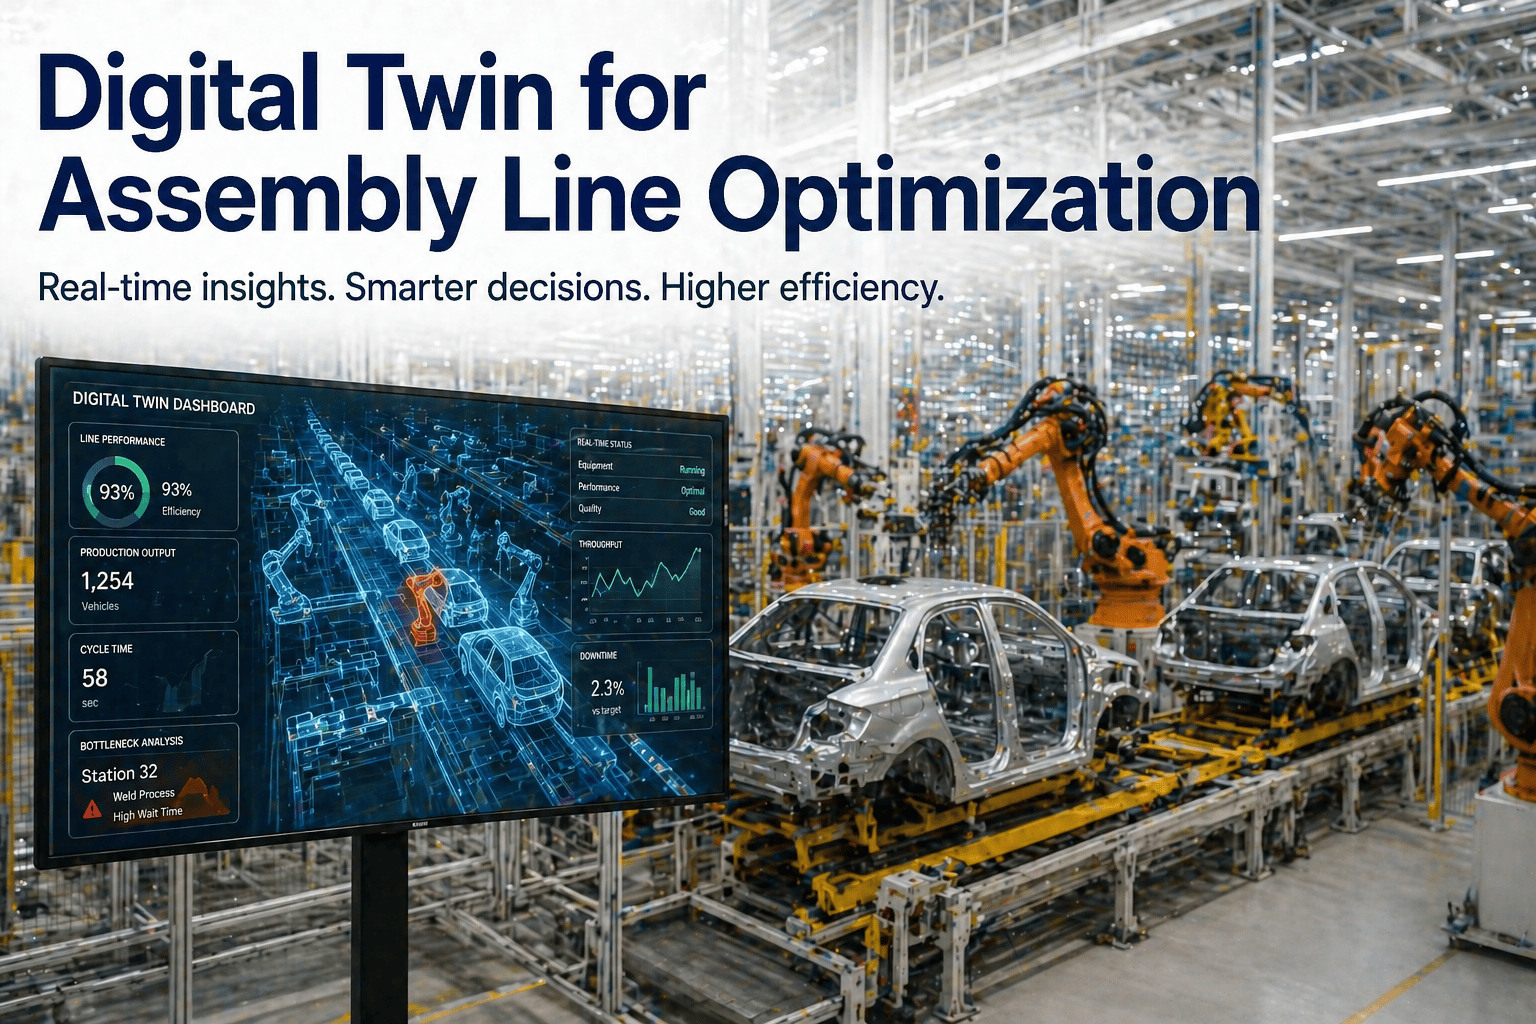
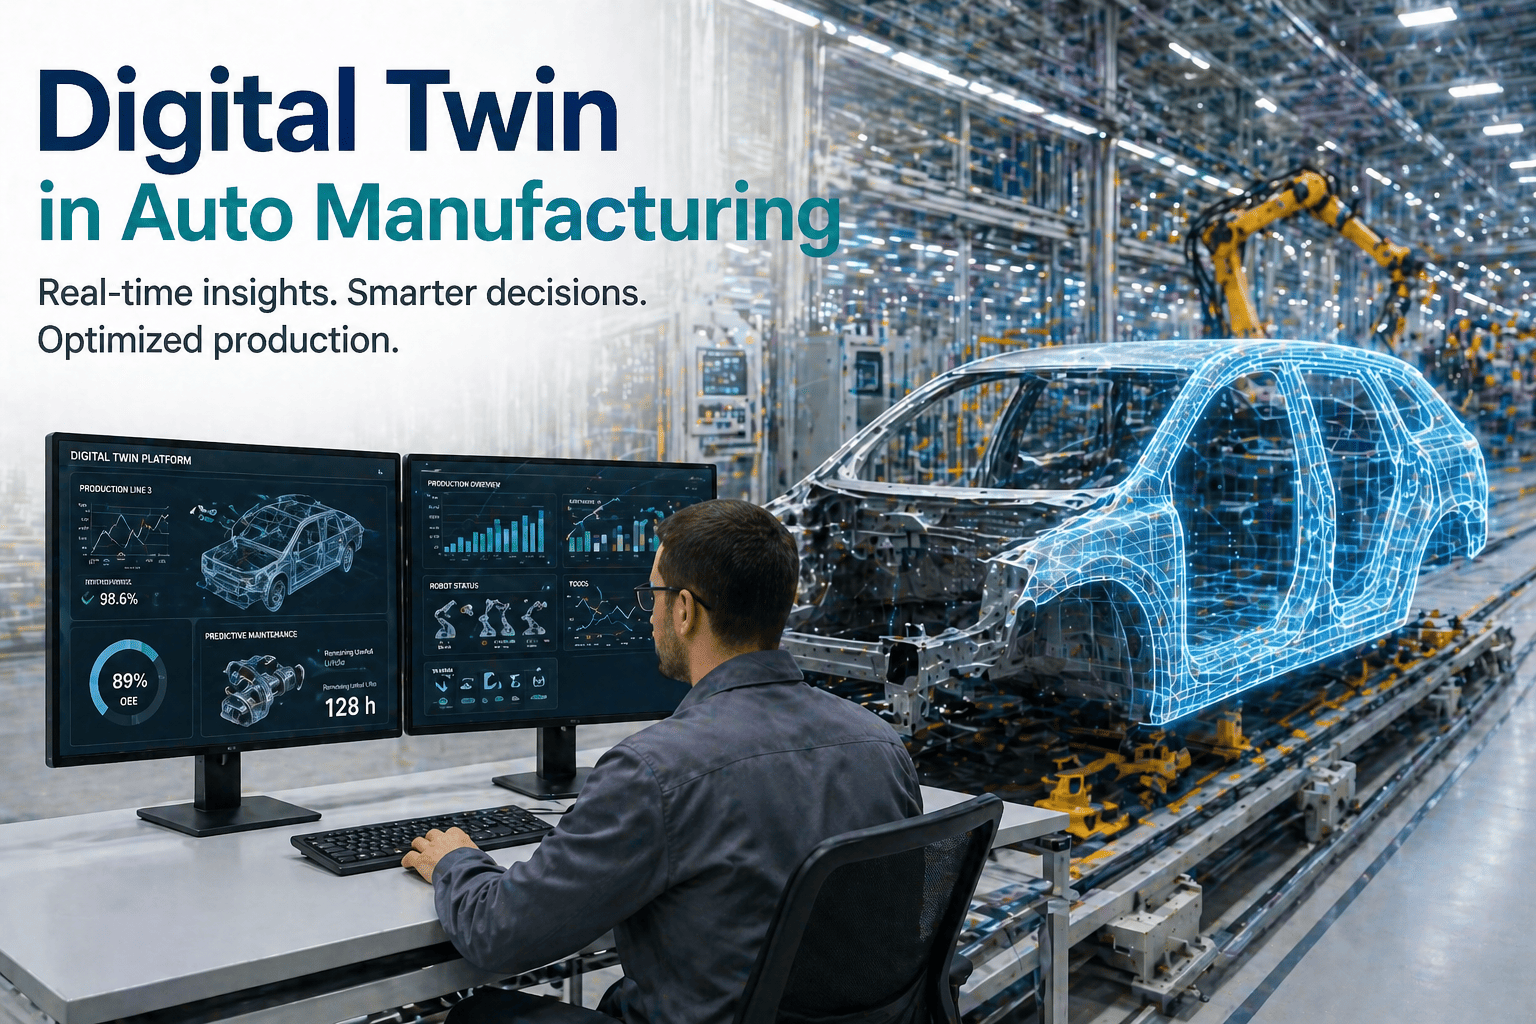
iFactory AI Digital Twin creates synchronized model of your assembly line showing every part location, workstation utilization, constraint location, and throughput impact. Machine learning identifies dynamic bottlenecks within hours vs manual analysis taking days, enabling immediate optimization capturing throughput gains.
How iFactory AI Digital Twins Eliminate Automotive Bottlenecks
Real-Time Line Monitoring: Every Part Location and Equipment State
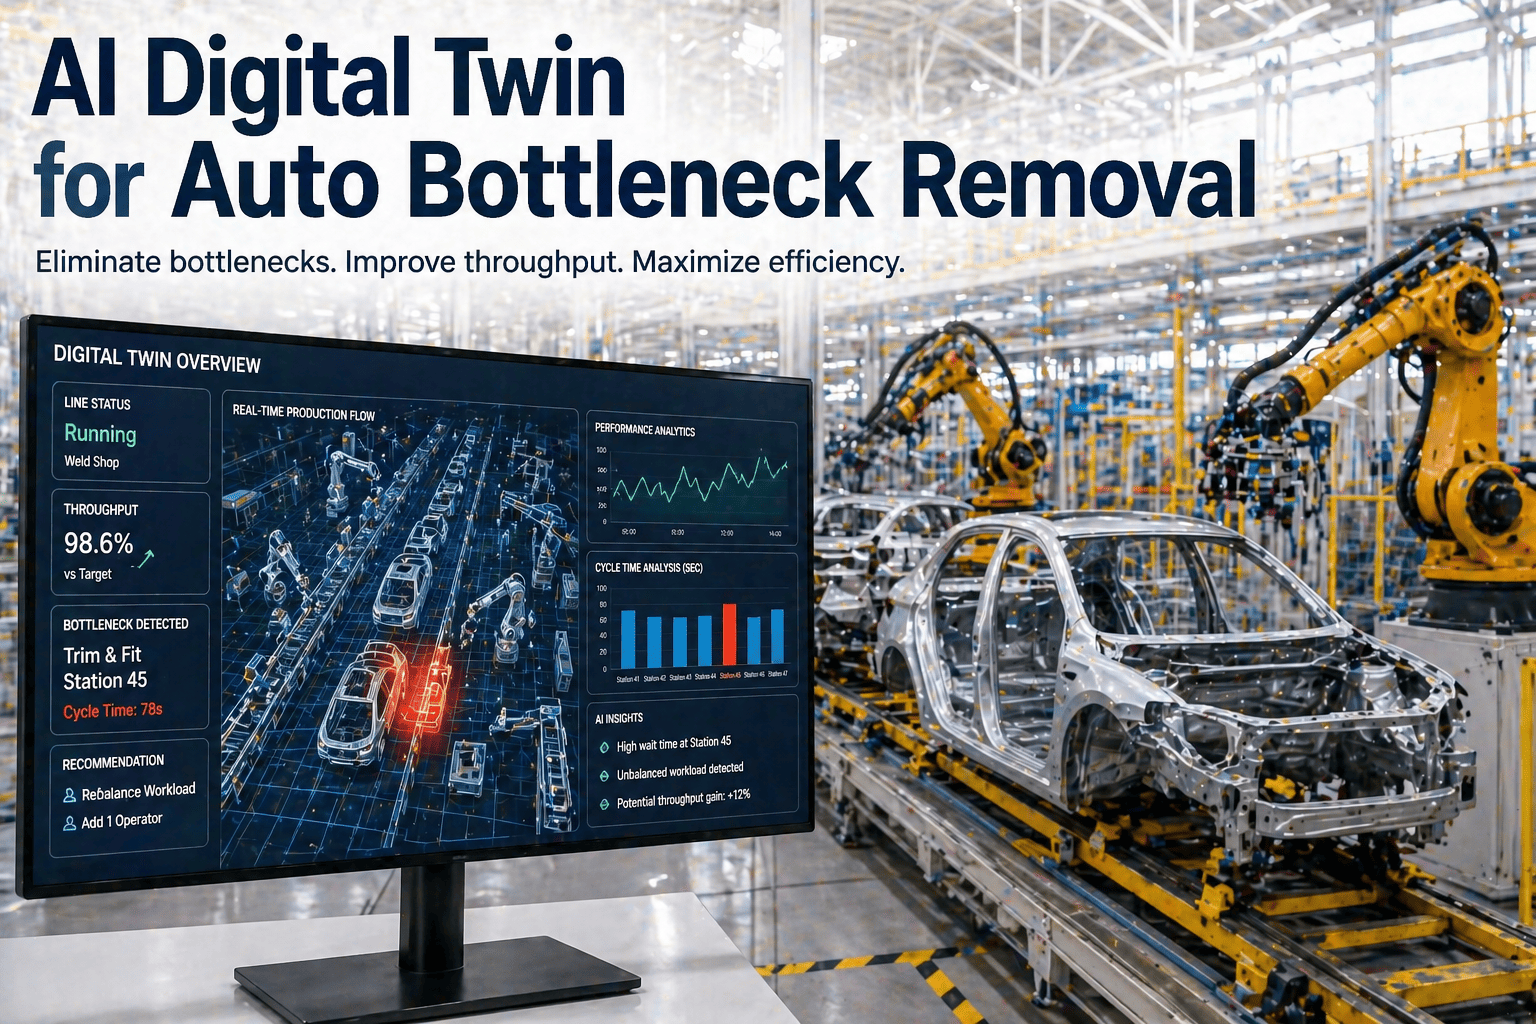
iFactory connects to PLC, SCADA, and MES systems capturing real-time equipment state (cycle times, utilization, downtime) and WIP location from vision systems or RFID tracking. Digital twin maintains synchronized model of line showing exact location of every part, workstation occupancy, and equipment performance. Real-time visibility enables immediate bottleneck recognition: if assembly station A has 8 parts queued while station B has 1 part, bottleneck is instantly identified. Traditional MES shows production counts (2,000 parts produced) but not where those parts are or why cycle time varied 15% day-to-day.
Machine Learning Identifying Dynamic Bottlenecks by Product Mix
iFactory AI analyzes weeks of line performance data identifying bottleneck patterns: Model A production shows bottleneck at welding station (65 second cycle vs 60 second design), Model B shows bottleneck at assembly (52 seconds vs 50), Model C shows different pattern. Machine learning models capture these product-mix-specific constraints. When production schedule changes from Model A to Model B, iFactory predicts bottleneck shift enabling proactive operator assignment, material staging, and workstation optimization preparation before product switch occurs.
Immediate Bottleneck Alerts Enabling Hour-Level Response
iFactory alerts operations teams within minutes when bottleneck forms: "Welding station utilization 95% (vs normal 75%), 12 parts queued, constraint limiting throughput 8%." Alerts include recommended actions: "Add operator to assembly station to increase part throughput" or "Check conveyor speed to Station 5." Hour-level response enables immediate optimization vs 5-10 day typical improvement cycle. Sustained bottleneck identified at 8 AM can be addressed by 4 PM capturing full throughput gain that day vs waiting until next production review.
Automated Optimization Recommendations Increasing Throughput 12-28%
iFactory calculates throughput impact of bottleneck removal and recommends optimal countermeasures: reduce cycle time 5% (operator training, process tuning, tool optimization), increase workstation staffing (cost vs throughput gain analysis), parallel processing when possible (reroute parts to alternative path), or equipment maintenance (reduce drift causing slowdown). Recommendations include throughput impact prediction: "Adding operator to assembly increases throughput 4-6%." Operations teams make data-driven decisions allocating resources to highest-impact constraints.
Why iFactory AI Outperforms Manual Bottleneck Analysis and Legacy Systems
Manual bottleneck identification relies on production supervisors observing line flow during shifts, reviewing MES production data weekly, and implementing changes days or weeks later missing real-time opportunities. Legacy MES systems (SAP, Oracle, Infor) capture production totals but lack real-time WIP visibility, equipment utilization analysis, or constraint prediction. iFactory AI deploys in 8 weeks at $160K-280K investment, uses real-time line monitoring capturing bottleneck formation within minutes vs days, integrates with existing PLC, SCADA, MES systems via OPC UA without system replacement, identifies dynamic constraints shifting with product mix vs static manual analysis, and achieves 12-28% throughput gains vs manual programs delivering 2-5% improvements. iFactory achieves IATF 16949 compliance with automated production traceability and downtime documentation. Connects to your existing systems keeping operational data inside your security perimeter while delivering industrial-grade AI reliability required for mission-critical production lines.
| Capability | iFactory AI | Manual Analysis | SAP/Oracle MES |
|---|---|---|---|
| Bottleneck Detection Time | Real-time minutes | 5-10 days after observation | Daily batch reports |
| WIP Visibility | Real-time part location tracking | Manual observation only | Production counts only |
| Dynamic Constraint Prediction | ML-based by product mix | No prediction capability | No prediction |
| Throughput Gain Realization | 12-28% within weeks | 2-5% over months | No throughput focus |
| Deployment Timeline | 8 weeks | Ongoing, staff-dependent | 12-18 months |
Bottleneck Elimination Implementation: 8-Week Deployment Roadmap
iFactory AI deploys bottleneck elimination across automotive assembly lines through structured 8-week implementation. Week 1-2: Assessment of line configuration, equipment types, WIP tracking capabilities, current bottleneck patterns, and historical production data. Week 2-3: Data integration from PLC controllers, SCADA systems, MES databases, vision systems, and equipment historians. Week 3-4: AI model training on 4-8 weeks production data learning product-mix-specific bottleneck patterns and constraint dynamics. Week 4-5: Digital twin dashboard configuration for operations (real-time line visualization), supervisors (bottleneck alerts), and management (throughput impact tracking). Week 5-6: Pilot alerts testing on highest-impact production shifts measuring detection accuracy and recommendation value. Week 6-8: Full production deployment across all shifts with continuous monitoring, automated alerts, and throughput optimization. Results visible in week 6 with digital twin live, bottlenecks detected within minutes vs days, and optimization recommendations driving immediate throughput gains.
Automotive Plant Bottleneck Results: Production Gains and Financial Impact
Global OEM Assembly Plant Case Study
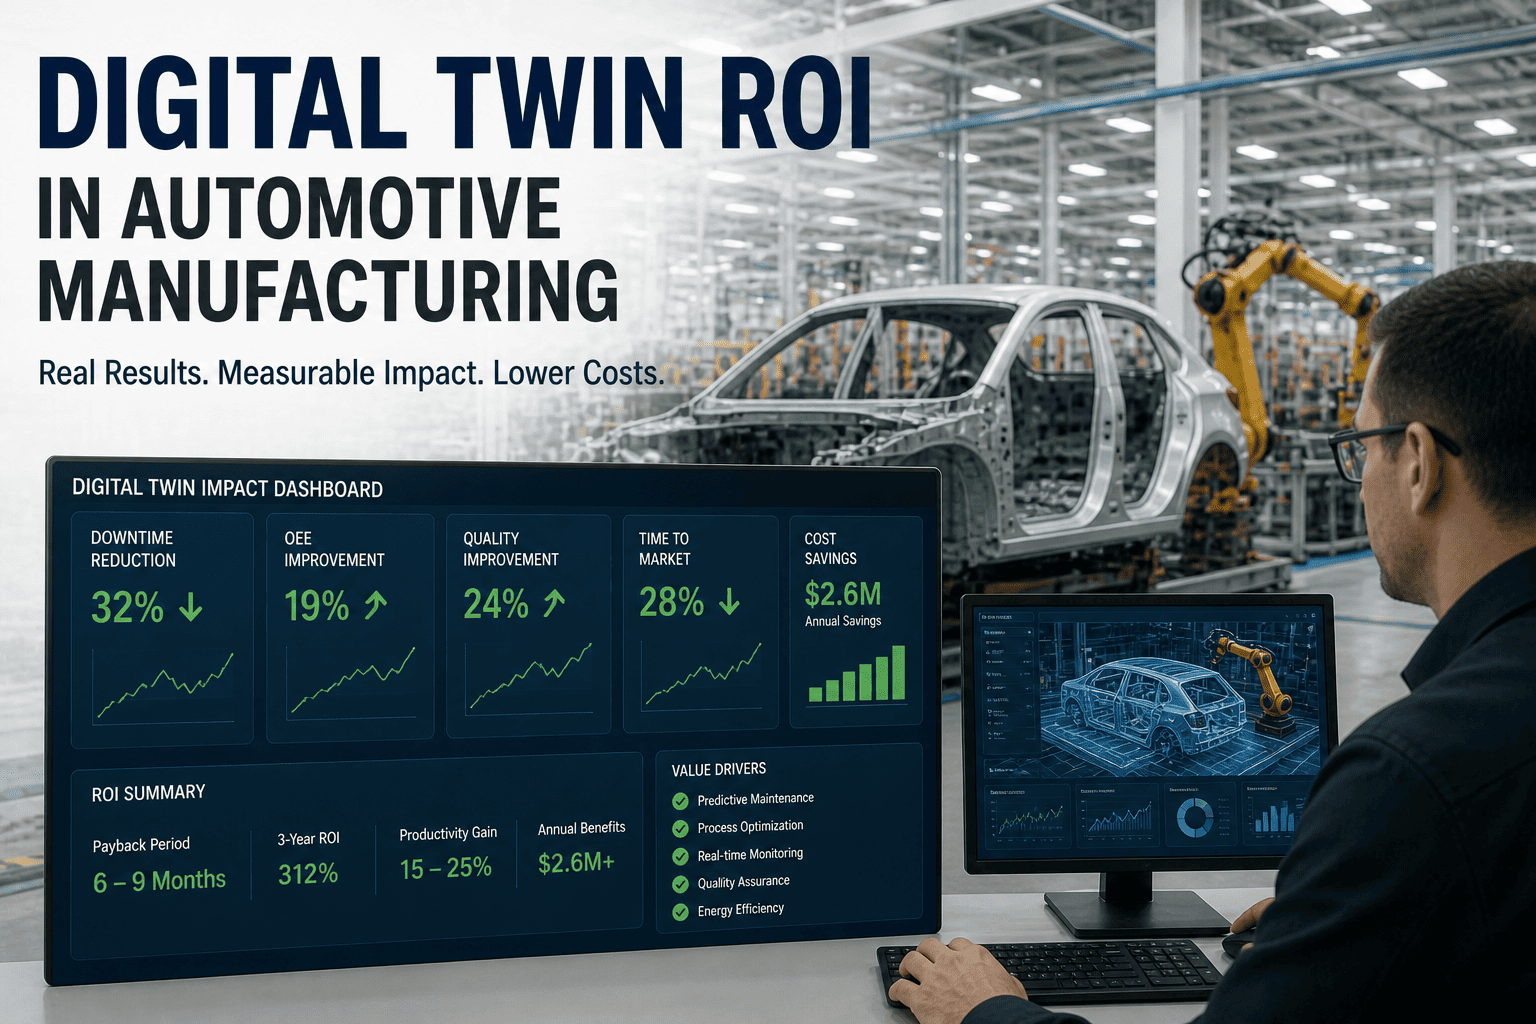
A global OEM operating an 18-station assembly line producing 1,800 vehicles daily (6 product variants) implemented iFactory AI for bottleneck elimination. Baseline: historical throughput 1,620 vehicles (90% of design capacity), manual bottleneck identification taking 5-10 days, cycle time variability 18% creating supply chain disruption. Within 8 weeks: iFactory identified 3 dynamic bottlenecks (Model A: welding station, Model B: chassis assembly, Model C: wiring harness installation) varying by product mix. Immediate alerts enabled hour-level response: adding operator to bottleneck station (10 min setup cost, 4% throughput gain), optimizing conveyor speed (5 min adjustment, 3% gain), reducing robot cycle drift through maintenance (2% gain per station). Combined 12% throughput improvement adds 216 vehicles daily. At $32K gross profit per vehicle, 216 vehicles = $6.9M annual revenue. Cycle time variability reduced 22% improving supply chain predictability, reducing 12% safety stock requirement = $1.2M inventory release. Annual value: $8.1M. Payback: 2 weeks on $160K investment.
"We had production supervisors with 20 years experience who were pretty good at spotting bottlenecks by eye. But they only saw their shift. We'd make a change thinking it would help throughput, but it would just shift the bottleneck to the next station. iFactory showed us the bottleneck was moving with product mix. Monday Model A had a problem at station 8. Tuesday Model B had the bottleneck at station 5. Wednesday it was different again. We weren't seeing that because we looked at weekly data. With real-time alerts, we can respond within hours. The 12% throughput gain is real money we wouldn't have captured without understanding where the constraint actually is."
Regional Automotive Production and Compliance Requirements
Automotive manufacturers across regions face different production pressures, supply chain dynamics, and compliance requirements. North American plants (US/Canada) emphasize throughput and supply chain predictability. European plants balance production with strict labor regulations and quality standards. UK plants navigate post-Brexit supply chain complexity. Middle East (UAE) operations optimize efficiency in high-cost environments. iFactory AI supports all regions through region-specific production optimization, IATF 16949 compliance documentation, and local supply chain adaptation.
| Region | Production Challenge | Compliance Requirement | iFactory Solution |
|---|---|---|---|
| US Automotive | Throughput pressure from EV ramp-up, supply chain complexity with 8,000+ suppliers | IATF 16949 quality, production traceability, safety compliance | 12-28% throughput gain, automatic IATF compliance documentation, supply chain visibility |
| Europe Automotive | Balancing production with labor regulations, strict quality standards | IATF 16949, labor hour optimization, quality consistency | Bottleneck elimination enabling productivity within labor constraints, quality improvement automation |
| UAE Automotive | High-cost operations, mixed EV and traditional vehicle production | Efficiency optimization, flexible production, emission compliance | Maximum throughput from available capacity, flexible line reconfiguration, emissions reduction |
iFactory vs Automotive Competitor Comparison
| Capability | iFactory | QAD Redzone | Evocon | SAP EAM |
|---|---|---|---|---|
| AI Bottleneck Detection | Real-time ML-based | Rule-based alerts | Manual analysis support | No bottleneck focus |
| WIP Visibility | Real-time tracking | Production counts | Limited | Limited |
| Product-Mix Constraint Prediction | Yes, ML-based | No | No | No |
| Throughput Gain Realization | 12-28% | 3-7% | 2-5% | No focus |
| PLC/SCADA Integration | Native OPC UA | Custom development | Custom APIs | Module-based |
| Deployment Speed | 8 weeks | 12-16 weeks | 10-14 weeks | 12-18 months |
| Automotive Fit | Designed for auto plants | Generic CMMS | Generic IoT platform | Generic EAM |
Frequently Asked Questions
iFactory AI Digital Twin identifies bottlenecks within minutes, predicts dynamic constraints by product mix, and delivers 12-28% throughput improvements within 8 weeks. Achieve $1.8-6.4 million annual production gains while improving supply chain predictability. Download the bottleneck elimination guide or schedule your free assessment to see how much throughput your plant is leaving on the table.