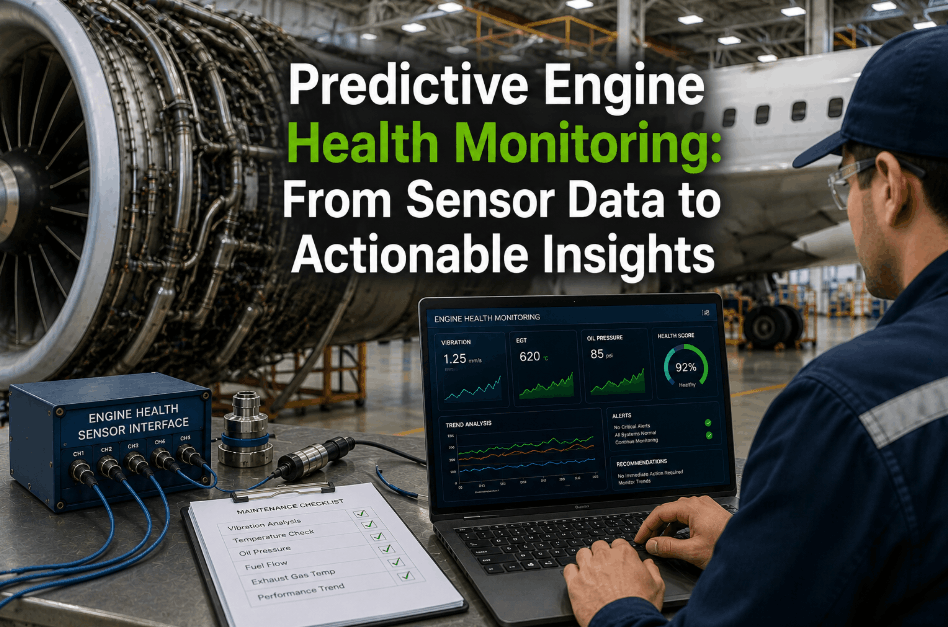
At 02:47 on a transatlantic crossing, the No. 2 engine on a 787 began shedding micron-level metallic particles into its oil system. The vibration signature shifted by 0.3 kHz. A threshold crossed. In the airline's maintenance operations center 4,000 km away, a work order appeared before the flight attendant had finished the second beverage service. That turbine was swapped at the gate within 90 minutes of touchdown, not three days later in an unscheduled AOG event. This is what happens when an IoT sensor network turns data into a decision before the symptom becomes a failure.
$5.36B
Aircraft Health Monitoring
Market (2026)
8,000+
Sensors Per Wide-Body
Aircraft Today
40%
Reduction in Unplanned
Maintenance via IoT
22.7%
Aviation IoT CAGR
(2025–2034)
The market trajectory is unambiguous: aircraft health monitoring is projected to grow from $4.91 billion in 2025 to $7.36 billion by 2030, with IoT sensor architecture as the foundational enabler. Airlines running connected fleets report 30–40% fewer unscheduled maintenance events and up to 25% reduction in total MRO costs. The architecture that delivers these outcomes follows a repeatable pattern. Here is exactly how it works.
The Aircraft Sensor Ecosystem: Where the Data Lives
A modern wide-body aircraft carries between 5,000 and 10,000 individual sensor points distributed across five critical zones. Each zone measures distinct physical parameters at different sampling frequencies and feeds data into the health monitoring pipeline. Understanding what is measured where is the first step in designing an IoT architecture that captures the right signals and ignores the noise.
Accelerometers, Thermocouples, Pressure Transducers, Oil Debris Monitors
Vibration (10–50 kHz), EGT, fan speed, oil pressure, metallic debris count. Rolls-Royce Trent engines alone generate 70 billion data points per flight through 5,000+ sensors per engine pair.
Fiber Bragg Grating (FBG) Strain Sensors, Acoustic Emission Sensors, Piezoelectric Patches
Microstrain (100–1000 Hz), crack propagation, impact detection. FBG arrays embedded in wing spars and fuselage skin provide real-time structural health data with sub-microstrain precision across 40+ channels per array.
Strain Gauges, Temperature Sensors, Angular Position Sensors, Hydraulic Pressure Sensors
Shock absorber stroke (1–10 Hz), brake temperature (up to 1,000 C), tire pressure. Landing gear accounts for 12% of all AOG events — IoT monitoring here alone delivers measurable dispatch reliability gains.
Current/Voltage Probes, Power Quality Analyzers, Temperature Sensors, Humidity Sensors
THD, power factor, transient count (1–20 kHz), bus voltage ripple. More electric aircraft architectures (787, A350) have doubled the sensor count in electrical systems compared to previous generation aircraft.
Pressure Transducers, Flow Meters, Temperature Sensors, Contamination Detectors
Peak pressure (10–100 Hz), decay rate, fluid contamination levels. Hydraulic system failures account for 29% of all mechanical delays — predictive algorithms trained on pressure decay trends can forecast seal failure with 89% accuracy up to 200 flight cycles in advance.
iFactory IoT Sensor Platform
Your Aircraft Already Generates the Data. iFactory Makes It Actionable.
iFactory ingests sensor telemetry via MQTT, OPC-UA, and ACARS — running AI classification, anomaly detection, and health scoring against every data point. The output is a ranked maintenance queue that feeds directly into your CMMS. No manual review. No missed thresholds.
The Four-Layer Architecture That Delivers Real-Time Health Intelligence
An aircraft IoT architecture that reliably converts raw sensor voltage into a maintenance work order spans four distinct layers. Each must meet aviation-grade reliability, security, and latency requirements. The architecture below is the reference model used in production deployments across major airline fleets and MRO networks.
Layer 1
Perception Layer
Physical sensors on aircraft systems. MEMS accelerometers, FBG strain gauges, thermocouples, pressure transducers, and acoustic emission detectors sample at rates from 1 Hz to 1 MHz depending on the measured parameter.
Layer 2
Edge Processing Layer
Onboard data concentrators apply local filtering, FFT transforms, and feature extraction. Edge processing reduces satellite bandwidth costs by up to 70% by transmitting only anomaly-flagged and threshold-crossed data rather than raw telemetry streams.
Layer 3
Connectivity Layer
Air-to-ground datalink via ACARS VHF/satellite, Iridium NEXT, Inmarsat SwiftBroadband, or 5G at the gate. Latency targets below 500 ms for critical alerts; bulk telemetry offload exceeds 100 Mbps at gate with modern Wi-Fi 6 systems.
Layer 4
Application Layer
Cloud analytics platforms ingest, time-align, and run ML models against all telemetry. Outputs include anomaly alerts, RUL predictions, work orders, and health score updates pushed directly to the maintenance CMMS.
The Data Pipeline: From Analog Voltage to Work Order in Under Two Minutes
The difference between a sensor network that collects data and one that drives decisions is the pipeline that connects them. Each stage in this chain reduces data volume by an order of magnitude while increasing semantic value — transforming raw millivolt readings into equipment-specific intelligence that a maintenance planner can act on immediately.
1
Signal
Acquisition
Raw ADC samples
Geotagged + timestamped
Volume: 100 TB/hr per fleet
2
Edge
Processing
Filtering, FFT, feature extraction, compression
Volume: 10 TB/hr
3
Cloud
Ingestion
MQTT broker, time-series DB, data quality checks
Volume: 5 TB/hr
4
ML Inference +
Work Order
Anomaly detection, RUL scoring, CMMS push
Volume: 10 GB/hr
Calendar-Based vs Condition-Based: The Maintenance Model Shift
The single biggest outcome of an IoT sensor network is the ability to move from fixed-interval maintenance to condition-based maintenance. The difference is not academic — it determines whether components are replaced because they need it or because the calendar says so. The comparison below uses real data from airline fleet programs that have made the transition.
Calendar-Based Maintenance
Components replaced at fixed flight-hour or calendar intervals regardless of actual wear state
30% of replaced components show no measurable degradation — unnecessary cost and waste
Failures that develop between inspection intervals go undetected until the next scheduled check
Typical unscheduled maintenance rate: 15–20% of all events
IoT Condition-Based Maintenance
Components replaced when real-time sensor data crosses a predictive threshold — actual condition drives timing
85% reduction in unnecessary removals; parts used to full safe life
Anomaly detection flags developing failures in real time — intervention happens before the failure
Unscheduled maintenance drops to 4–7% in mature IoT-enabled fleets
We deployed IoT sensor gateways across 120 narrow-body aircraft in 14 months. Within the first quarter, the system identified an APU bearing degradation pattern that our existing interval-based schedule would have caught 400 flight hours after the optimal replacement window. That single detection paid for the gateway hardware on the entire sub-fleet.
— VP of Maintenance Operations, European Low-Cost Carrier — 180+ aircraft fleet
Security and Compliance: The Non-Negotiable Layer
Aircraft IoT architectures operate under regulatory frameworks including EASA Part-M, FAA AC 20-170, and NIST SP 800-82. Every sensor node must include a hardware security module for identity attestation. Every data packet must be encrypted end-to-end. Every firmware update must be cryptographically signed and staged through A/B partitioning. These are not optional features — they are regulatory requirements for any IoT deployment on a certified aircraft.
Encryption
TLS 1.3 + AES-256-GCM
End-to-end encryption from sensor ADC to cloud storage, with per-session key rotation
Identity
X.509 + HSM Attestation
Per-sensor certificate enrollment and automated rotation, preventing spoofed data injection
Audit
Immutable Data Chain
Tamper-evident audit trail with SHA-256 hashing across all telemetry and maintenance actions
OTA Updates
Signed Firmware + A/B Partition
Cryptographically signed images with staged rollout and automatic rollback on validation failure
Architecture Deep-Dive
From Sensor to Work Order in Under 2 Minutes — See the Full Pipeline
iFactory's IoT Sensor Platform handles the entire data path — sensor provisioning, edge gateway configuration, time-series storage, ML model deployment, and maintenance workflow integration — in a single unified stack. Book a demo to see how airlines and MROs are using the platform to reduce unplanned maintenance by 37%.
Getting Started: A Phased Deployment Model That Works
The most successful aircraft IoT sensor network deployments follow a structured four-phase approach. Each phase builds on the previous one, reducing risk and demonstrating ROI before scale investment. The timeline below reflects actual fleet deployment programs from airlines and MROs that have completed the transition.
Instrument 3–5 aircraft with edge gateways and cloud connectivity. Run parallel to existing maintenance workflows. Validate data quality, latency, and alert accuracy.
Duration: 8–12 weeks
Train ML models on pilot fleet data. Set threshold parameters and anomaly detection baselines. Integrate output pipeline with CMMS for automated work order generation.
Duration: 8–12 weeks
Roll out gateway hardware and cloud tenant across the full fleet. Standardize sensor provisioning, firmware management, and alert escalation procedures.
Duration: 4–6 months
Phase 4
Optimize and Extend
Continuous model retraining based on accumulated fleet data. Extend sensor coverage to ground support equipment, hangar infrastructure, and additional aircraft types.
Duration: Ongoing
Frequently Asked Questions
Turn Your Aircraft Sensor Data into Maintenance Decisions That Save Millions
iFactory's IoT Sensor Platform ingests telemetry from any aircraft system, applies AI-based health scoring and anomaly detection, and pushes ranked work orders to your maintenance team — all within the same platform. From sensor provisioning to fleet-wide analytics in one integrated stack.