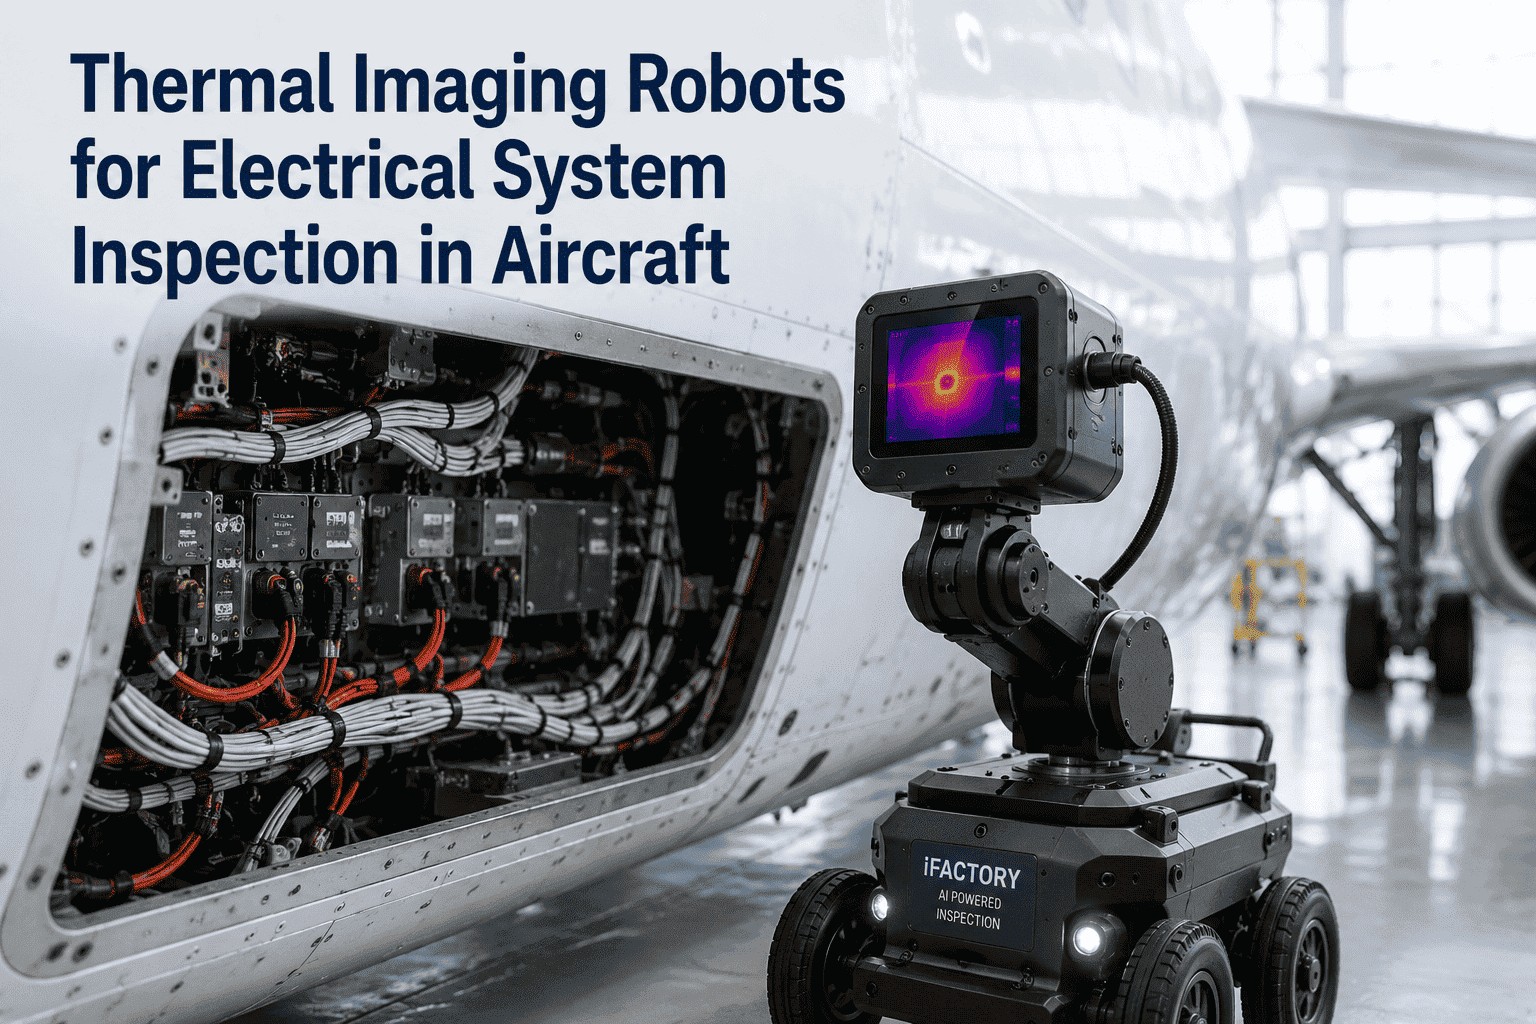
Aircraft electrical systems contain thousands of wire bundles, connectors, circuit breakers, bus bars, and power distribution units distributed across the fuselage, wings, and empennage. Electrical failures account for approximately 25% of aircraft fire incidents, with the majority originating from undetected hot spots in wiring and power distribution components that are invisible to the naked eye during routine visual inspections. Thermal imaging-equipped robots are transforming electrical system analytics by detecting temperature anomalies before they escalate into failures — identifying loose connections, overloaded circuits, insulation breakdown, and failing components while they are still in the early stages of degradation. This article examines the detection capabilities, robot platform configurations, and operational integration of thermal imaging robots for aircraft electrical system inspection, and how iFactory's Electrical analytics Module connects thermal inspection data to work orders, component life records, and certification documentation.
Thermal Robot Inspection · Electrical Fault Detection · Predictive Analytics
Your Aircraft's Electrical System Is Heating Up in Places You Cannot See. A Robot Can Show You Exactly Where.
iFactory Electrical analytics Module connects thermal imaging robot data directly to work orders, component records, and certification documentation — turning every thermal scan into an actionable maintenance event.
What Thermal Imaging Robots Detect in Aircraft Electrical Systems
Thermal cameras capture surface temperature across every electrical component within the robot's field of view. When a component operates above its expected temperature range, the delta indicates a developing fault. The severity of the fault is determined by how much hotter the component is than a reference baseline — a standard method defined by NETA and NFPA 70B. The four detection categories below represent the most common and critical findings from robotic thermal surveys on aircraft electrical systems.
Critical
Overheating Connections & Hotspots
Loose or corroded terminal connections create increased electrical resistance, which generates heat proportional to I²R loss. A single loose connection in a circuit breaker or bus bar can reach temperatures exceeding 110°C above ambient — hot enough to degrade insulation, melt wire coatings, and ignite surrounding materials. Robotic thermal surveys detect these hotspots with precision, recording the exact ΔT and geo-tagging the component for immediate work order generation.
ΔT: >40°C • NETA Severity: Critical
Warning
Overloaded Circuits & Unbalanced Loads
Circuits drawing current beyond their design capacity produce sustained elevated temperatures across the entire conductor path. Unbalanced three-phase loads create asymmetric heating where one phase runs measurably hotter than the others. Thermal imaging reveals these patterns across wire bundles, breaker panels, and power distribution units — enabling load rebalancing before breakers trip or insulation degradation accelerates across a circuit group.
ΔT: 15–40°C • NETA Severity: Intermediate
Caution
Insulation Breakdown & Carbon Tracking
Degraded insulation in wire bundles and connector assemblies allows leakage current to track across surfaces, producing localised heating that precedes complete dielectric failure. Carbon tracking creates conductive paths that widen over time, eventually leading to arc faults. Thermal robots scanning wire harnesses in avionics bays and wing galleries detect these warm zones before they become flashover events, enabling targeted replacement of affected sections.
ΔT: 5–15°C • NETA Severity: Minor
Monitor
Cold Solder Joints & Failing Components
Cracked or fractured solder joints in avionics circuit boards and connector backshells create intermittent connections that heat erratically under vibration and load. Failing relays, contactors, and solid-state switching devices exhibit characteristic thermal signatures before complete failure. Thermal imaging identifies these anomalies by comparing component temperature profiles against known-good baselines stored in the inspection database.
ΔT: 3–10°C • NETA Severity: Monitor
Industry Standard Severity Classification
NETA (InterNational Electrical Testing Association) defines four severity levels for thermal anomalies based on temperature rise above ambient: Critical (>40°C), Intermediate (15–40°C), Minor (5–15°C), and Monitor (3–5°C). The iFactory Electrical analytics Module assigns these severity levels automatically to every thermal finding and generates prioritised work orders based on the classification.
Three Robot Platforms for Thermal Electrical Inspection
Each robot platform brings a different combination of reach, payload capacity, and environmental tolerance to the inspection task. The choice depends on the aircraft type, the electrical system zones being inspected, and the hangar layout constraints.
Platform 01
Speed0.5–1.5 m/s
Battery6–10 hours
IR Camera640 × 512 px, <30 mK
AccessFlat surfaces, wide aisles
Best suited for scanning power distribution panels, avionics bay floors, and widebody fuselage sections where the robot can roll freely. Carries high-resolution thermal cameras and can inspect hundreds of points per mission with repeatable positioning accuracy of ±5 mm.
Platform 02
Speed0.3–1.2 m/s
Battery4–8 hours
IR Camera640 × 512 px, <20 mK
AccessStairs, ramps, confined zones
Ideal for multi-level inspection routes including cockpit overhead panels, wing crown wire trays, and cargo compartment electrical centres. Legged platforms navigate stairs and uneven surfaces that stop wheeled robots, enabling single-mission coverage of the entire electrical distribution chain.
Platform 03
Speed0–5 m/s hover
Flight20–35 minutes
IR Camera640 × 512 px, <15 mK
AccessVertical surfaces, overhead
Best for vertical and overhead electrical assets including fuselage crown wiring, overhead bus bars, and ceiling-mounted distribution panels. Drones access inspection points in 30 seconds that require scaffolding setup for hours. Cage-mounted platforms allow safe operation inside hangars with collision protection.
Thermal Inspection Workflow in Three Stages
Robotic thermal inspection follows a structured three-stage sequence that integrates with existing MRO workflows. Each stage produces specific outputs that feed directly into the iFactory Electrical analytics Module for work order creation and certification documentation.
01
S
Scan — Multi-Sensor Data Capture
The robot navigates its programmed inspection route, stopping at each waypoint to capture thermal, visual, and 3D spatial data of every electrical component. The thermal camera records surface temperature at every pixel — generating a thermogram with thousands of data points per panel. Each scan is time-stamped and geo-referenced to the aircraft coordinate system, ensuring repeatable positioning on every subsequent inspection cycle.
02
A
Analyse — AI-Based Anomaly Detection
Thermal data is processed through an AI inference engine that compares each component temperature against its baseline profile from previous scans and against industry-standard ΔT thresholds. Anomalies are classified by severity, flagged with the specific component ID and location, and ranked by priority. The AI model trains on historical inspection data and improves detection accuracy with each completed cycle.
03
R
Report — Automated Work Order Creation
All findings are pushed to the iFactory Electrical analytics Module where each anomaly is automatically linked to the existing component record in the asset register. Work orders are generated for critical and intermediate severity findings with the component location, ΔT measurement, thermal image, and recommended corrective action included. Certification-ready documentation is produced for every inspection completed.
Measured Performance Impact
92%
Pre-failure hotspot detection accuracy vs 67% for manual IR surveys
60%
Faster electrical troubleshooting cycle — from fault find to confirmed resolution
4×
More inspection points covered per shift compared to manual thermal wand surveys
$180K
Average annual savings per hangar from prevented electrical failures and reduced troubleshooting time
Integrating Thermal Robot Data with MRO Workflows
A thermal detection is only valuable if it triggers the right maintenance action. The iFactory Electrical analytics Module bridges the gap between robot-generated inspection data and the MRO work order system, ensuring every anomaly is tracked from detection through resolution to certification.
1
Direct Component Linkage
Every thermal anomaly is auto-linked to the specific component ID in the aircraft asset register — wire bundle, breaker, connector, or panel — eliminating manual data entry and ensuring the maintenance history tracks back to the exact component that generated the finding.
2
Severity-Prioritised Work Orders
Critical and intermediate findings generate work orders automatically, assigned to the appropriate trade group with the thermal image, ΔT data, and location embedded. Minor findings enter a review queue for trend monitoring. Work order priority matches NETA severity classification.
3
Cross-Cycle Trend Analytics
Each inspection cycle builds a thermal baseline for every scanned component. The module tracks ΔT progression across cycles, flagging components where temperatures are rising even if still below critical threshold — enabling proactive replacement before failure.
4
Certification-Ready Documentation
All inspection data, anomaly records, and work order histories are compiled into certification-ready documentation that meets EASA and FAA record-keeping requirements. Exportable reports include the complete thermal survey with severity classifications and resolution records.
iFactory Electrical analytics Module
Every Hotspot Detected. Every Anomaly Documented. Every Repair Assigned.
iFactory Electrical analytics Module connects thermal imaging robot data directly to aircraft component records, work order systems, and certification documentation. Supports wheeled UGV, legged quadruped, and aerial drone platforms with full API integration. Trusted by MRO operators across the UK, EU, Middle East, and Asia-Pacific for electrical system inspection programmes that catch failures before they happen.
Pilot in 30 days. Full deployment in one quarter.
Frequently Asked Questions
Every electrical component on your aircraft generates a thermal signature. The ones that are failing are already running hotter. Are you capturing that data?
iFactory Electrical analytics Module connects to your thermal imaging robot platform to automate anomaly detection, work order creation, and certification documentation. Book a Demo to see how your thermal inspection data maps to actionable maintenance events.