The biogas plant operator at a 5 MW anaerobic digestion facility in the Midwest watches the SCADA screen at 02:00. The methane concentration has drifted from 54% to 48% over the last six hours, and the parasitic load from the mixing pumps just spiked to 18% of gross output. The shift lead knows the yield loss will cost roughly $4,200 by morning, but the only KPI on the dashboard is mechanical availability — a green 97% that tells him nothing about the real performance bleed happening right now. This is the gap that standard OEE misses in biogas operations, and it costing AD plants 12–18% of their potential revenue every month.
OEE for Biogas Plants Must Capture Methane Yield, Uptime, and Parasitic Load — Not Just Availability
A practical KPI framework that anaerobic digestion operators use to measure true plant productivity, cut yield losses by 15–25%, and benchmark performance across your fleet — delivered on-premise and pilot-ready in 6–12 weeks.
Why Standard OEE Fails Biogas Operations
Traditional OEE — availability x performance x quality — was designed for discrete manufacturing. It treats a biogas plant like a stamping press, measuring only if the equipment is running. It ignores methane concentration, volatile solids reduction, parasitic energy consumption, and feedstock variability. Here are the specific gaps that cost AD plants millions each year.
Methane Yield Is Invisible
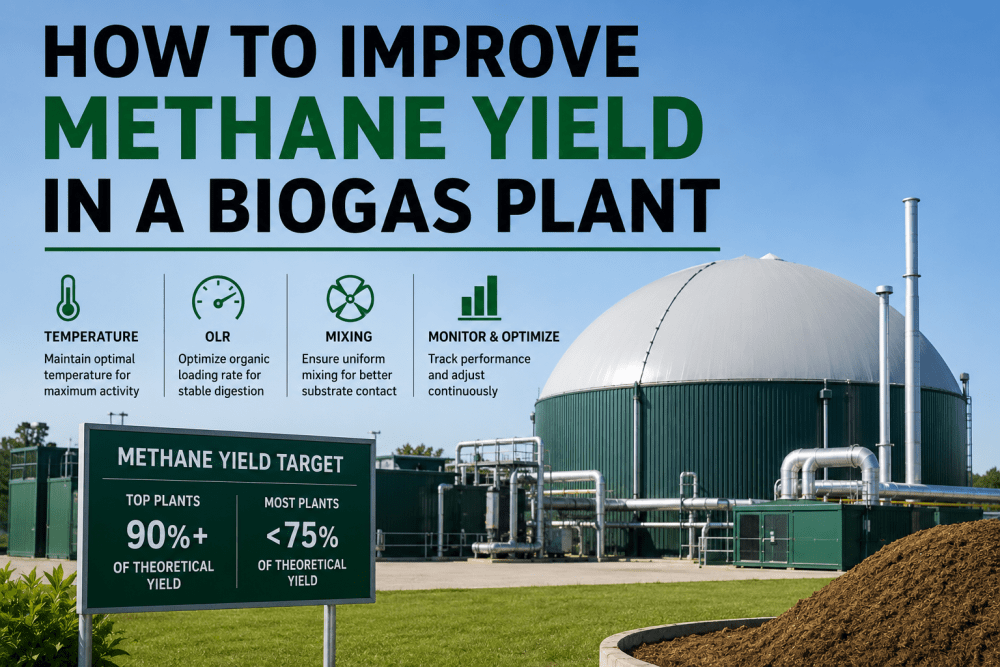
Your SCADA shows flow rates and tank levels, but no KPI tracks actual methane yield per ton of volatile solids fed. A 4% drift in methane concentration — common with feedstock changes — goes unnoticed for hours, costing a 5 MW plant about $1,200 per day in lost gas production.
Parasitic Load Eats Your Margin
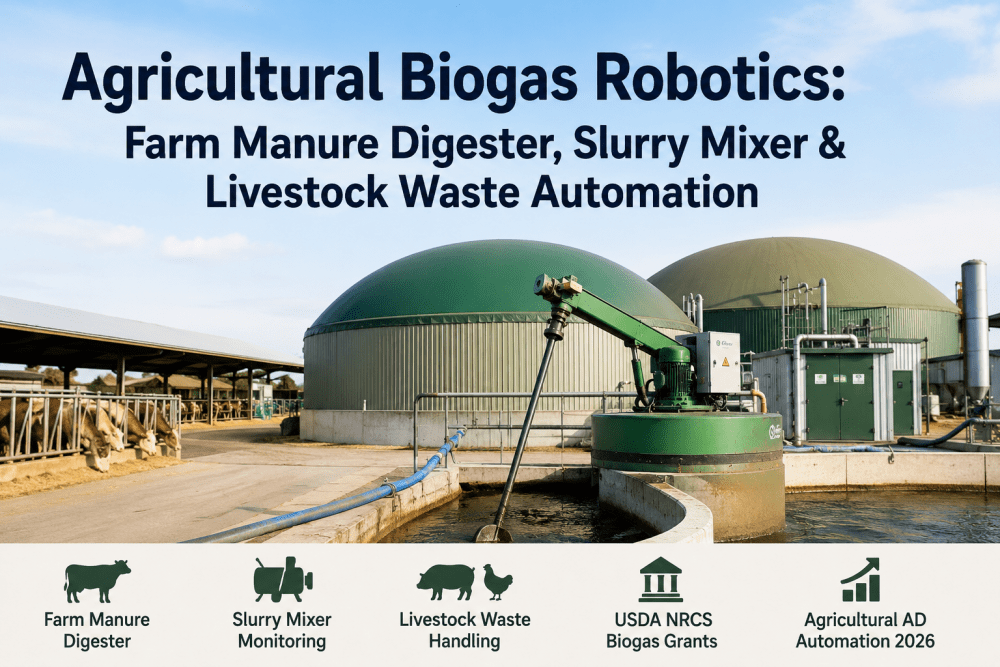
Mixing pumps, heating systems, and digestate handling can consume 12–22% of gross electrical output. Without a dedicated KPI for parasitic load ratio, operators don't see that a failing pump seal just added 4% to internal consumption — equivalent to $180,000 in lost annual revenue for a typical plant.
Availability Metrics Are Misleading
A digester that runs 100% of the time but at 60% of design methane production rate shows 100% availability. Standard OEE calls that perfect performance. The real productivity loss — 40% of potential gas output — is invisible. Operators make decisions based on a green light that hides a $2,000/day yield gap.
Feedstock Variability Is Unmeasured
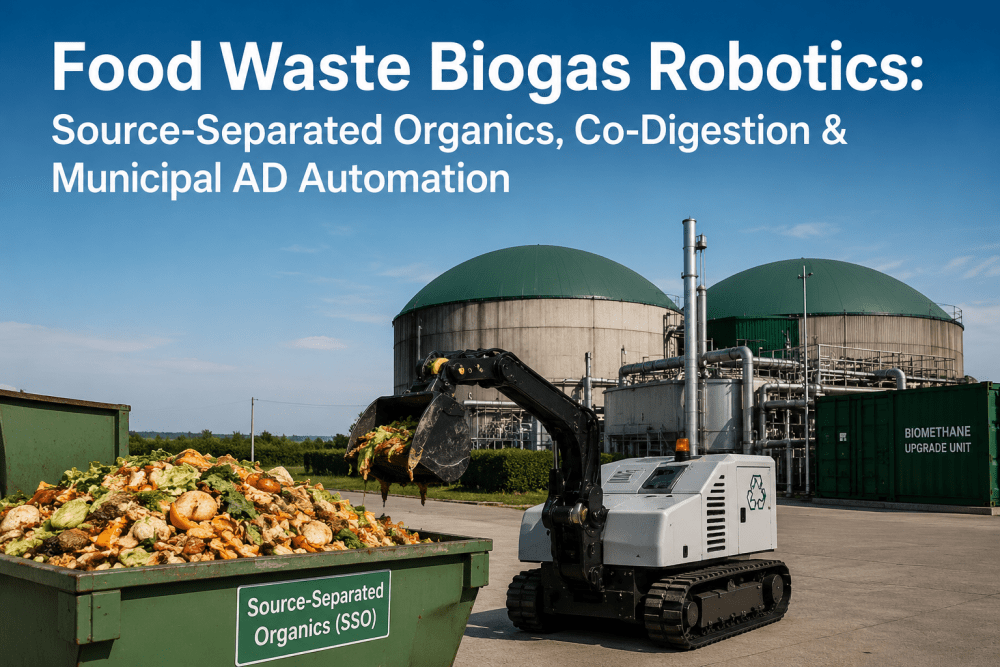
When a food waste batch arrives with 8% less volatile solids than expected, the biogas yield drops proportionally. Without a KPI that normalizes yield against actual feedstock quality, the operator blames the digester biology. The real root cause — feedstock variance — stays hidden, and the plant loses $400–600 per batch in unrealized gas production.
Regulatory Compliance Has No KPI Home
Renewable fuel credits, carbon intensity scores, and emissions limits each require specific operational data. Without a unified KPI framework, compliance reporting becomes a manual spreadsheet exercise that takes 8–12 hours per month and often misses data needed for incentive claims worth $50,000–150,000 per year.
The five pain points above drain 14–18% of your plant's potential revenue. Book a 30-min walkthrough and we'll show you how a single dashboard closes every gap.
How We Build a Biogas-Specific OEE Framework in 4 Steps
iFactory deploys on your plant network — no cloud, no data egress — and connects to your existing PLCs, flow meters, gas analyzers, and SCADA historian. Within weeks, you have a KPI framework purpose-built for anaerobic digestion.
Connect All Data Sources
We ingest 200+ signals from your plant — methane analyzers, feed pumps, gas flow meters, temperature probes, parasitic load sensors — into a single time-series model on the iFactory appliance.
Define Biogas-Specific OEE
We replace generic OEE with three AD-specific components: Methane Yield Rate (Nm³ CH₄ per ton VS fed), Process Uptime (hours at >90% design yield), and Energy Efficiency Ratio (net kWh exported / gross kWh produced).
Build Real-Time Dashboards
Operators see live OEE, yield trends, parasitic load, and feedstock quality normalized to a single screen. Alerts trigger when methane concentration drops below 50% or parasitic load exceeds 20% — not after a shift change.
Benchmark Across Your Fleet
If you operate multiple AD plants, iFactory normalizes each site's KPI against feedstock type, digester design, and climate. You see which plant is truly best-in-class and where to focus capital improvements for the highest ROI.
The five pain points above drain 14–18% of your plant's potential revenue. Book a 30-min walkthrough and we'll show you how a single dashboard closes every gap.
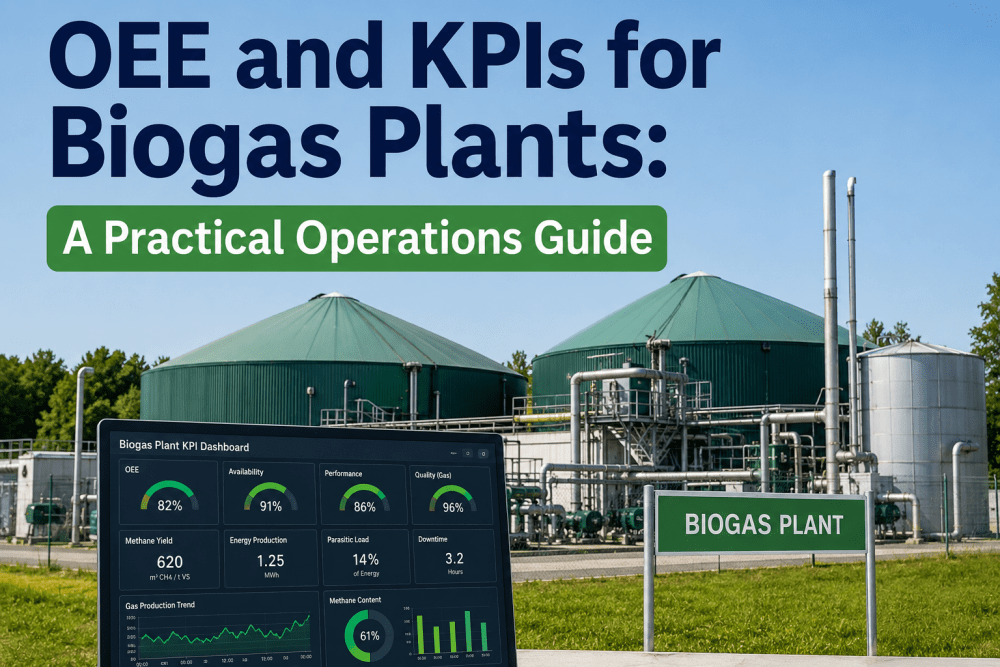
What the Biogas OEE Dashboard Delivers
The iFactory platform goes beyond standard dashboards. These capabilities are built into every deployment, configured to your plant's specific sensor layout and process design.
Real-Time Methane Yield KPI
Live calculation of Nm³ CH₄ per ton of volatile solids fed, updated every 60 seconds. Operators see yield drift within minutes, not hours. Historical baseline automatically adjusts for seasonal feedstock changes.
Parasitic Load Ratio Dashboard
Track internal consumption as a percentage of gross output — broken down by mixing, heating, pumping, and digestate processing. Identify failing equipment the day it starts drawing excess power, not after the monthly utility bill arrives.
Feedstock Quality Normalization
Automatically adjust yield targets based on actual volatile solids content of incoming feedstock. If a batch is 5% weaker, the KPI shows normalized yield, not a false performance drop. Operators stop chasing biology and start managing feedstock sourcing.
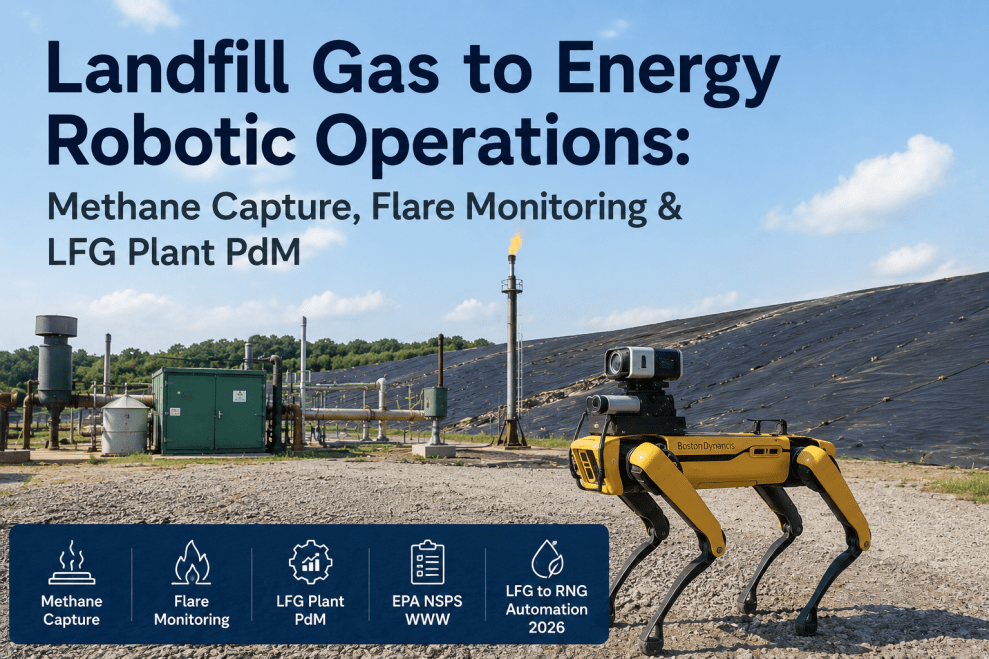
Carbon Intensity & RIN Tracking
Calculate CI scores and RIN eligibility in real time using operational data. The dashboard logs every data point needed for EPA and CARB reporting — no manual spreadsheets, no missed credits worth $50,000–150,000 per year.
Process Uptime vs. Mechanical Uptime
Separate the KPI for "equipment running" from "process producing at design yield." A digester that runs but produces at 60% yield shows 60% process uptime — finally, a KPI that reflects real productivity, not just motor rotation.
Fleet-Wide Performance Comparison
Normalize OEE across different digester designs, feedstock mixes, and climates. Identify which plant has the best methane yield per ton VS, lowest parasitic load, and highest net export efficiency — then replicate those practices.
What Biogas Operators Achieve with iFactory OEE
These metrics come from actual AD plants using iFactory's biogas-specific KPI framework. Results vary by plant size, feedstock, and baseline performance, but the pattern is consistent across all deployments.
The five pain points above drain 14–18% of your plant's potential revenue. Book a 30-min walkthrough and we'll show you how a single dashboard closes every gap.
The iFactory Promise for Biogas Operations
Every deployment is turnkey, on-premise, and purpose-built for anaerobic digestion. Here's what's included.
End-to-End Deployment
You hand over data-source access — PLCs, gas analyzers, flow meters, SCADA — and iFactory delivers a working pilot in 6–12 weeks. No custom development, no integration consultants.
On-Premise, Zero Cloud Dependency
The iFactory appliance runs on your plant network. No data leaves your facility. No cloud subscription. No cybersecurity review for data egress. It's a physical appliance — plug it in, connect data sources, go.
Biogas-Specific KPI Library
Pre-built KPI templates for methane yield rate, parasitic load ratio, process uptime, feedstock quality normalization, carbon intensity, and RIN tracking — configured to your plant's specific sensor layout.
Pilot-to-ROI in One Quarter
You see measurable yield improvement and parasitic load reduction within 12–16 weeks of deployment. The pilot pays for itself through recovered gas production and reduced energy costs.
24x7 Managed Service
iFactory monitors the appliance, updates KPI models, and supports operators around the clock. You don't need an IT team or data scientists — we handle the platform, you run the plant.
Fleet Scalability
Deploy one appliance per plant, then unify KPIs across your entire fleet. Each plant keeps its local data, but you get a normalized benchmark view across all sites. Add new plants in 2–4 weeks each.
Biogas OEE & KPI — FAQ
Stop managing your biogas plant with KPIs designed for stamping presses.
iFactory delivers a biogas-specific OEE framework on your network, in 6–12 weeks, with measurable yield improvement in the first quarter. Book a 30-minute walkthrough and we'll show you live dashboards from an operating AD plant.