The morning shift at a 2 MW anaerobic digestion plant in the Midwest starts like any other: the SCADA screen shows 1.8 MW, the digester temperature is a steady 100.4°F, and the CHP is humming. But by 10:00 AM, the CHP's jacket water temperature has climbed two degrees — a small drift that no alarm catches. By noon, the engine has derated to 1.2 MW. By 2:00 PM, it trips on high-temperature shutdown. The plant loses 600 kWh of production, the digester gas holder starts to lift, and the flare lights. That single uncaptured drift costs the plant $4,800 in lost generation and $2,200 in startup penalties from the utility. This is the daily reality for AD plants operating at 82–87% availability — not because the equipment is bad, but because nobody sees the pattern until it hurts.
From 85% to 95%: A Platform Approach to Biogas Plant Uptime
Stop chasing alarms and start preventing failures. iFactory gives you a single pane of glass across digester health, CHP performance, gas quality, and balance-of-plant — all on-premise, all working in 6 weeks.
The challenge with biogas plant uptime isn't one big problem — it's hundreds of small ones that compound. A digester foaming event that goes unnoticed for 6 hours. A CHP spark plug that fouls at hour 3,200 instead of the rated 8,000. A gas analyzer that drifts 2% and causes the engine to run lean. A cooling tower fan that loses a belt and raises jacket water temperature by 3°F. Each event is individually small. Collectively, they cost the average AD plant 600–900 hours of lost generation per year. iFactory was built to see all of them — from the biology inside the digester to the vibration on the CHP bearing — and connect the dots before any of them becomes a trip.
Six Capabilities That Drive Biogas Uptime
iFactory is not a point solution for one sensor or one machine. It is an end-to-end platform that ingests data from every source in your plant — PLCs, SCADA, gas analyzers, vibration sensors, lab results, and manual logs — and surfaces the one or two actions that matter right now.
Early Warning for Foaming & Acidosis
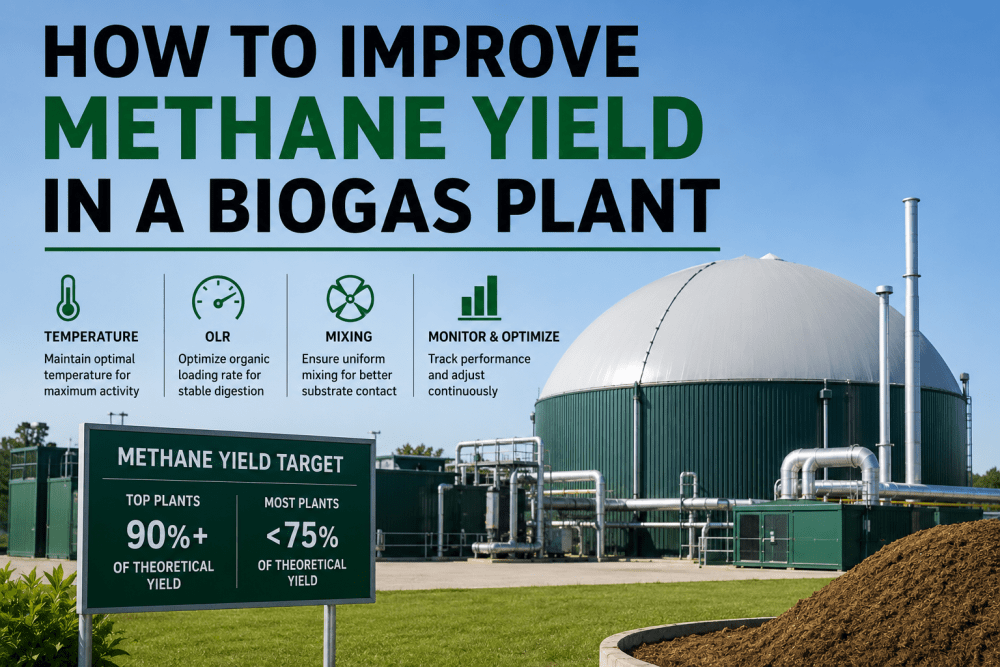
iFactory models the 15-minute trend of pH, VFA/alkalinity ratio, and foam layer height. When the VFA ratio crosses 0.35, the platform issues a preventive alert — before the biology tips and gas production drops 40%. Operators get a specific recommendation: reduce OLR by 10% or add 200 gallons of trace minerals.
Predictive Engine Health Monitoring
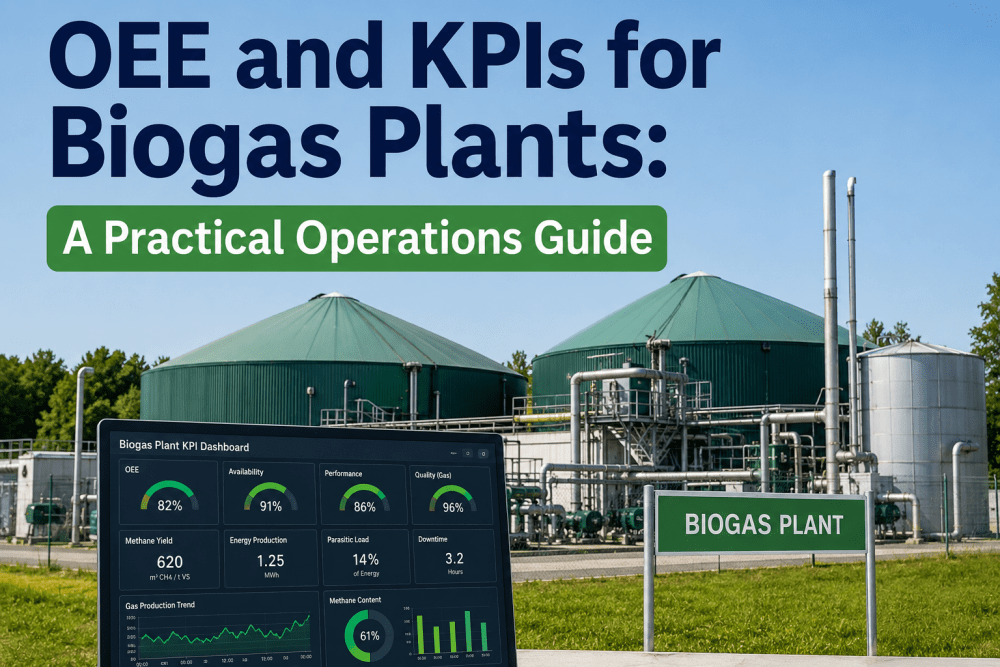
Vibration, exhaust temperature spread, jacket water delta-T, and oil analysis data combine into a single CHP health score. iFactory predicts spark plug replacement, valve adjustment, and oil change intervals based on actual engine wear, not fixed calendar schedules. Users report 80% fewer unplanned CHP outages.
Real-Time Methane & Siloxane Control
Gas composition changes minute-to-minute. iFactory ingests raw data from gas analyzers and correlates methane %, H2S, and siloxane levels to digester feed events and CHP performance. When methane drops below 52%, the platform alerts the operator to check the carbon filter or adjust the feed blend — before the engine derates.
Cooling, Flare & H2S Scrubber Oversight
Cooling tower approach temperature, flare gas flow, and scrubber pressure drop are tracked continuously. iFactory detects a failing cooling fan bearing 72 hours before it seizes — allowing for planned replacement during a low-tariff window. Flare runtime is logged and benchmarked to minimize methane slip.
Every Lost MWh Tracked to Root Cause
iFactory automatically classifies every production loss event — mechanical, biological, grid curtailment, or planned maintenance — and assigns a time and dollar value. The daily loss report shows the top three causes of availability loss that shift, prioritized by cost impact. No more spreadsheets.
Actionable Alerts, Not Alarm Floods
Instead of 200 alarm points per shift, iFactory surfaces 3–5 prioritized actions with specific instructions: "Reduce feed rate by 5% for the next 2 hours to stabilize foam layer." Each alert includes the expected outcome and a confirmation button. Operator response time drops from 22 minutes to under 4.
From Data to Uptime in Four Steps
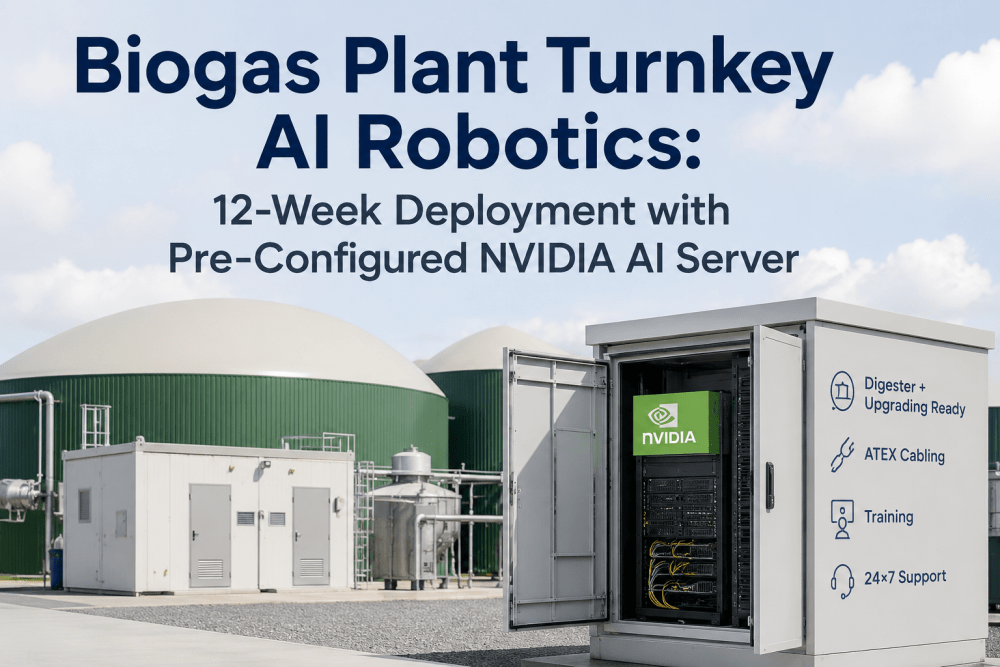
iFactory is deployed on an NVIDIA appliance on your plant network — zero cloud, zero data leaving your control. The platform connects to your existing sensors and systems, builds a digital twin of your plant, and starts delivering uptime improvements within 6 weeks.
Connect
iFactory ingests data from your PLCs, SCADA, gas analyzers, vibration sensors, and lab systems. Typically 50–150 data points per plant. No new sensors required.
Model
The platform builds a digital twin of your digester, CHP, and balance-of-plant systems. Machine learning models learn normal operating patterns for each asset and each process condition.
Detect
iFactory continuously compares live data against the model. When a deviation exceeds the normal envelope — a 2°F temperature rise, a 1% methane drop, a 0.1 pH shift — the platform flags it as a risk.
Act
Operators receive prioritized, specific actions on a single screen. Each action includes the expected impact on uptime and generation. Close the loop, and the model learns from the outcome.
Three Hidden Leaks That Kill Biogas Availability
Most AD plants track big outages — the CHP rebuild, the digester cleaning, the grid outage. But the real availability loss is in the small, invisible events that compound over a shift, a day, a month. Here are three that iFactory catches every day.
Subclinical Digester Foaming
A 2-inch foam layer that builds over 4 hours, goes undetected, and causes the gas holder to lift at 3:00 AM. The flare runs for 90 minutes. Lost generation: 1.2 MWh. Cost: $9,600.
CHP Spark Plug Fouling
A gradual increase in exhaust temperature spread over 3 days. No alarm triggers. At hour 3,500, the engine misfires and derates to 60% load. Repair takes 8 hours. Lost generation: 6.4 MWh. Cost: $51,200.
Cooling Tower Fan Belt Failure
One fan loses its belt at 2:00 AM. Jacket water temperature rises 5°F over 6 hours. The CHP trips on high temperature at 8:00 AM. Lost generation: 4.8 MWh. Cost: $38,400.
These three event types alone account for 12–18% of annual availability loss at a typical 2 MW plant. iFactory catches all of them before they become trips.
What 10% More Uptime Means for Your Plant
Every percentage point of availability improvement at a 2 MW plant operating at $0.08/kWh translates to roughly $14,000 in annual revenue. Moving from 85% to 95% unlocks $140,000 per MW per year. For a 5 MW plant, that's $700,000 annually — with no capital expenditure on new equipment.
Every day you wait, your plant is losing $1,200–$2,800 in availability that iFactory could recover. Book a 30-min walkthrough and we'll show you exactly how much your plant is leaving on the table.
What Plant Operators Ask About Biogas Uptime
Stop Losing Generation to Small Events That Compound
Your plant is running at 85% availability. iFactory can get you to 95% in one quarter. No new sensors. No cloud. No 18-month implementation. Just a 6-week deployment and a single pane of glass that connects every data point in your plant to the actions that keep it running.