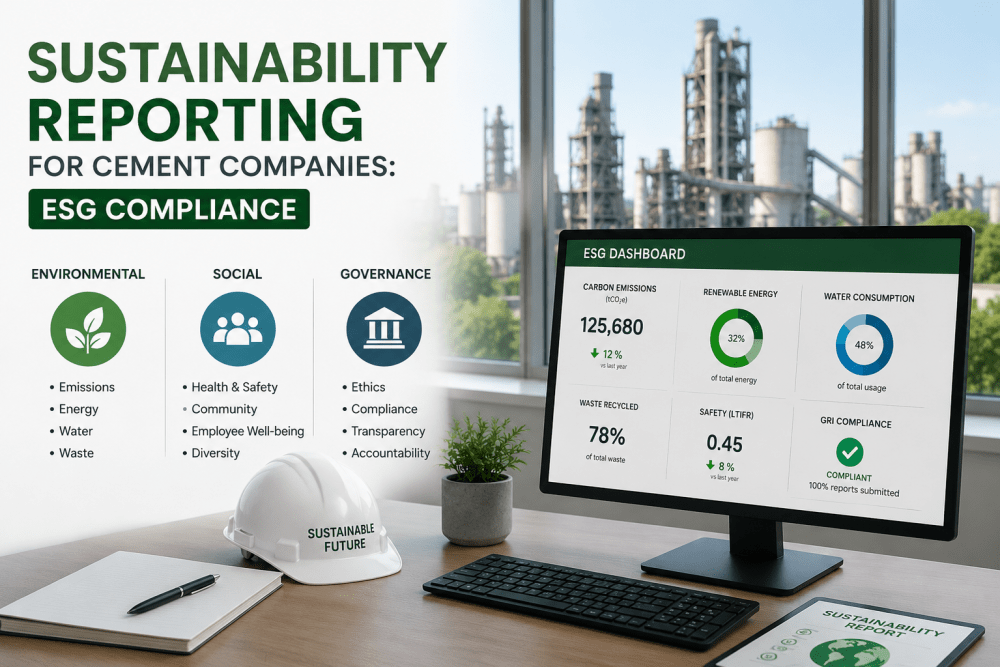
Cement plants operate under one of the most rigorous regulatory frameworks in U.S. heavy industry, with EPA emissions reporting requirements under 40 CFR Part 60 (NSPS), Part 63 (NESHAP), and Part 98 (GHGRP) governing everything from kiln stack particulate matter and NOx to greenhouse gas emissions and continuous monitoring system data. A typical integrated cement plant generating 1 million tons per year must track and report 15 to 25 distinct parameters from 8 to 12 continuous emissions monitoring systems, quarterly stack tests, raw mill and finish mill process data, and fuel consumption logs — each requiring specific calculation methods, data quality assurance procedures, and submission deadlines that carry civil penalties of $25,000 to $100,000 per day for non-compliance. Traditional compliance reporting relies on manual data collection from multiple plant information systems, spreadsheet-based calculations, and operator entries that are time-consuming, error-prone, and difficult to audit. iFactory's Automated Analytics & Compliance Reporting platform connects kiln CEMS, process PLCs, fuel scales, and lab information systems through a single on-premise analytics engine that generates EPA-compliant reports, maintains audit-ready data trails, and delivers real-time compliance dashboards without manual spreadsheet manipulation. Book a Demo to discuss automated compliance reporting for your cement plant's specific regulatory obligations and instrumentation configuration.
Is Your Cement Plant Still Generating Compliance Reports with Spreadsheets and Manual Data Entry?
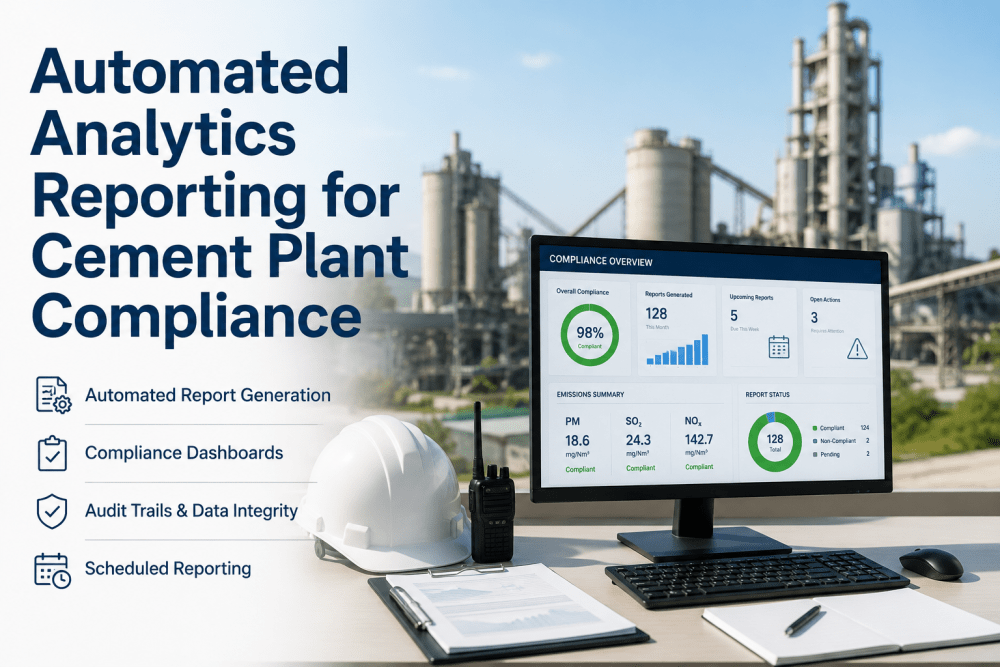
iFactory's Automated Analytics & Compliance Reporting platform connects kiln CEMS, process PLCs, fuel scales, and lab systems to an on-premise AI analytics engine that generates EPA-compliant reports, maintains audit-ready data trails, and delivers real-time compliance dashboards — with zero cloud dependency, read-only plant system connectivity, and no modifications to existing CEMS or control systems.
The Operational Case for Automated Analytics and Compliance Reporting at Cement Plants
Cement plant environmental and compliance managers face a persistent operational challenge: the regulatory reporting workload increases every year while plant staffing levels remain flat or decline. A typical integrated cement plant with one kiln line and three finish mills generates 200 to 400 unique data points per hour across CEMS, process instrumentation, fuel systems, and quality lab instruments that must be collected, validated, calculated, and stored in compliance-ready formats. Manual data collection consumes 15 to 25 hours per week of environmental staff time, spreadsheet-based calculations introduce error rates of 0.5 to 2% that trigger data quality inquiries during EPA audits, and the administrative burden of responding to information requests, preparing for stack test events, and maintaining audit trail documentation diverts resources from higher-value process optimization and emissions reduction projects. Automated analytics platforms that connect directly to plant data sources, apply regulatory calculation methods automatically, and generate submission-ready reports have demonstrated 70 to 85% reduction in manual compliance reporting labor, elimination of calculation errors, and audit response times reduced from days to hours.
Five Automated Analytics Applications Transforming Cement Plant Compliance Reporting
Automated analytics deployment across cement plant compliance operations spans five primary application domains. Each addresses a specific regulatory reporting burden and generates measurable savings in labor, accuracy, and audit readiness. The following tabbed overview details each application with its data integration approach and documented outcomes from iFactory's cement plant compliance deployments.
Automated EPA Emissions Reporting from CEMS and Process Data
EPA emissions reporting for cement kilns requires continuous monitoring of PM, NOx, SO2, CO, and THC (for hazardous waste-burning kilns), with data collected as 1-hour averages, reported as 30-day rolling averages, and submitted through the EPA's CEDRI or Electronic Reporting Tool (ERT) system at quarterly intervals. Traditional reporting involves downloading CEMS data manually, exporting to spreadsheet templates, applying missing data substitution procedures per 40 CFR Part 60 Appendix F, calculating emission rates in lb/ton of clinker, and formatting for submission. Automated analytics platforms connect directly to kiln CEMS data acquisition systems (DAS) via read-only OPC-UA or Modbus links, extract recorded parameter values at configurable intervals, apply regulatory calculation methods automatically, and generate submission-ready EPA report files. At a 1.2-million-ton-per-year integrated cement plant in the southeastern United States, iFactory's automated EPA reporting module eliminated 18 hours of manual data handling per week and reduced report generation time from 5 business days to 45 minutes per quarterly submission cycle.
- Read-only CEMS DAS integration via OPC-UA or Modbus — no modifications to existing monitoring systems or data acquisition hardware
- Automated missing data substitution per 40 CFR Part 60 Appendix F — EPA-compliant procedures without manual calculation
- Quarterly EPA report generation in CEDRI and ERT formats with submission-ready data packets
- 18 hours per week of manual data handling eliminated; 5-day report cycle reduced to 45 minutes
Continuous Emissions Monitoring System (CEMS) Data Quality Analytics
CEMS data quality is the foundation of credible compliance reporting, but continuous monitoring systems require ongoing validation: daily calibrations must be recorded and reviewed, relative accuracy test audit (RATA) results must be tracked against EPA acceptable criteria, and data availability must be maintained above 95% to avoid automatic reporting of missing data values at the highest emission rate from the previous 720 operating hours. Manual tracking of CEMS performance across multiple analyzers on a kiln stack is time-consuming and prone to oversight. Automated CEMS analytics platforms ingest calibration data, drift check results, and RATA test results directly from the CEMS DAS, calculate data availability percentages in real time, detect calibration drift trends before they exceed acceptable limits, and generate quarterly CEMS performance evaluations that satisfy EPA Part 60 Appendix F quality assurance requirements. At a dual-kiln cement plant producing 2 million tons per year, iFactory's CEMS analytics module identified a PM analyzer calibration drift trend 14 days before the drift would have exceeded the 5% acceptable limit, enabling proactive maintenance that prevented 72 hours of missing data reporting at the maximum emission rate.
- Real-time CEMS data availability tracking per analyzer with automated alerts when availability drops below 95% threshold
- Calibration drift trend detection — identifies analyzer performance degradation 10 to 14 days before limits are exceeded
- Automated RATA test scheduling and results tracking against EPA acceptable criteria per 40 CFR Part 60 Appendix B
- Quarterly CEMS performance evaluation reports generated automatically from continuous monitoring data
Real-Time Compliance Dashboard for Plant-Wide Regulatory Visibility
Cement plant environmental managers need immediate visibility into compliance status across multiple regulatory programs — kiln stack emissions limits, raw mill and finish mill PM limits, greenhouse gas reporting thresholds, and Title V operating permit conditions — but conventional plant information systems present process data in SCADA displays that are not organized around regulatory compliance. Dedicated compliance dashboards aggregate data from CEMS, process PLCs, fuel systems, and lab instruments into a unified view organized by regulatory program, displaying current parameter values against permit limits, 30-day rolling averages, and compliance margin trends. The dashboard updates in real time and provides drill-down access to supporting data for any parameter exceeding 75% of its permitted limit — enabling proactive corrective action before a limit exceedance occurs. At a 1.5-million-ton cement plant in the Midwest, iFactory's compliance dashboard reduced environmental staff time spent on compliance status checks from 6 hours per week to 30 minutes per week by consolidating 12 separate data sources into a single compliance-oriented view.
- Unified compliance view across all regulatory programs — NSPS, NESHAP, GHGRP, Title V — in a single dashboard
- Real-time parameter monitoring against permit limits with 75% threshold alerts for proactive corrective action
- Drill-down data trail from dashboard parameter to original CEMS reading, calibration record, and calculation method
- 12 separate data sources consolidated into one compliance view; 6 hours per week reduced to 30 minutes
Automated Audit Trail and Data Integrity Verification
Regulatory auditors review not only the submitted emission values but also the data trail that supports them: original CEMS readings, calibration records, missing data substitution calculations, and any manual adjustments or data flags. A complete and well-organized data trail is the difference between a smooth audit closeout and a finding that triggers follow-up investigation and potential penalty exposure. Manual audit trail preparation requires the environmental team to compile data from multiple systems, reconcile timestamps across CEMS DAS and process historians, and document the calculation methods applied to each reported parameter. Automated audit trail platforms capture every data point, calculation step, and manual entry in an immutable analytics log that preserves the complete data lineage from sensor reading to submitted report value. iFactory's audit trail module automatically time-stamps and records all data transformations, applies digital signatures to submitted reports, and enables auditors to drill from any reported value back through calculation steps to the original CEMS or process data source within seconds.
- Immutable analytics log capturing every data point, transformation, and manual entry with timestamp and user attribution
- Complete data lineage — drill from submitted report value to original CEMS reading or process instrument data point
- Digital signature application to submitted EPA reports for data integrity verification during regulatory audit
- Audit trail compilation reduced from 3–5 person-days to less than 1 hour per audit event
Scheduled Report Generation for All Regulatory and Operational Reporting
Cement plants submit compliance reports on daily, weekly, monthly, quarterly, and annual cycles across multiple regulatory programs. EPA quarterly emissions reports, state operating permit compliance certifications, greenhouse gas annual reports under 40 CFR Part 98, and Title V semi-annual monitoring reports each require specific data sets, calculation methods, and submission formats. Scheduling these reports manually requires the environmental team to maintain a compliance calendar, track submission deadlines across federal and state agencies, and allocate 2 to 5 person-days per report cycle for data compilation, calculation, and formatting. Automated report scheduling platforms maintain a compliance calendar of all reporting obligations per regulatory program, extract the required data from connected plant systems at the appropriate aggregation period, apply program-specific calculation methods, format the output per agency submission requirements, and notify the responsible manager when the report is ready for review and submission. At a 1-million-ton cement plant in Texas, iFactory's automated report scheduling module manages 18 recurring compliance reports per year, eliminating 35 person-days of manual report preparation labor and reducing late-submission risk to zero over three consecutive reporting cycles.
- Automated compliance calendar — tracks all federal and state reporting deadlines across every applicable regulatory program
- Program-specific calculation methods and output formats per EPA CEDRI, ERT, GHGRP, and state agency requirements
- Notification-driven review workflow — responsible manager notified when report is ready for review before submission
- 18 recurring compliance reports automated; 35 person-days of manual labor eliminated annually
Manual Compliance Reporting vs. Automated Analytics — The Performance Gap
Cement plant environmental teams have developed manual compliance reporting workflows refined over years of regulatory experience, but the performance ceiling of manual operations has structural limitations: data collection is bounded by the frequency of manual data pulls from plant systems, calculation accuracy depends on spreadsheet formula integrity, and audit responsiveness is constrained by the time required to locate and compile supporting documentation. Automated analytics platforms operating on continuous data feeds achieve measured performance improvements that manual workflows cannot reach regardless of staff experience or diligence.
| Reporting Domain | Conventional Manual Method | Automated Analytics Method | Measured Improvement |
|---|---|---|---|
| EPA Quarterly Emissions Reporting | Manual CEMS data download, spreadsheet calculation of lb/ton clinker, manual missing data substitution per Appendix F, email-based review cycle | Automated CEMS data ingestion, regulatory calculation engine applying EPA methods, auto-generated submission-ready CEDRI and ERT files | 5-day report cycle reduced to 45 minutes; 18 hours per week of manual data handling eliminated |
| CEMS Data Quality Assurance | Manual tracking of daily calibrations, drift checks, and RATA schedules in spreadsheets; periodic review of data availability percentages | Real-time CEMS performance monitoring per analyzer with automated calibration drift trend detection and data availability alerts | 14-day early warning on calibration drift; continuous 95% data availability monitoring without manual effort |
| Compliance Status Monitoring | Environmental staff manually check permit limit compliance across SCADA displays, CEMS data exports, and process historians | Unified compliance dashboard aggregating all regulatory program data with real-time limit monitoring and 75% threshold alerts | 12 data sources consolidated; 6 hours per week of compliance checks reduced to 30 minutes |
| Audit Trail Preparation | Environmental team compiles documentation from CEMS DAS, process historians, and spreadsheets; 3–5 person-days per audit event | Immutable analytics log with complete data lineage from sensor reading to submitted report; digital signature verification | Audit compilation reduced from 3–5 days to under 1 hour; seconds-long drill from report value to original data source |
| Recurring Report Scheduling | Environmental team maintains compliance calendar, allocates 2–5 person-days per report for data compilation, calculation, and formatting | Automated compliance calendar with program-specific calculation methods and output formats; notification-driven review workflow | 18 recurring reports automated; 35 person-days of manual labor eliminated; zero late submissions across 3 reporting cycles |
A Phased Approach to Automated Analytics Deployment at Your Cement Plant
Deploying automated analytics and compliance reporting across a cement plant does not require a greenfield control system replacement or a production shutdown schedule. iFactory's platform is designed for brownfield retrofit on live plant operations, with read-only data integration into existing CEMS data acquisition systems, process PLCs, fuel management systems, and quality lab information systems. The deployment sequence reflects lessons learned from multi-facility automated analytics installations across U.S. integrated cement plants and grinding stations.
Plant Data Audit & Compliance Requirements Mapping
iFactory engineering teams conduct an on-site audit of plant CEMS configuration, process PLC architecture, fuel measurement systems, and existing compliance reporting workflows. All applicable regulatory programs — NSPS, NESHAP, GHGRP, Title V — are mapped against current reporting practices, identifying data gaps, calculation inconsistencies, and manual effort areas. Priority automation modules are sized and specified for the plant's specific regulatory obligations, instrumentation infrastructure, and reporting cycle requirements. Book a Demo to discuss your cement plant's specific compliance reporting requirements and deployment timeline.
Platform Configuration & Regulatory Calculation Engine Setup
The automated analytics platform is configured with read-only data connections to the plant's CEMS DAS, process historian, fuel management system, and quality lab information system. Regulatory calculation engines are configured per applicable EPA and state reporting programs, including missing data substitution procedures, emission rate calculations in lb/ton of clinker and lb/ton of product, and greenhouse gas carbon content and heat input calculations. Compliance dashboards are configured with the plant's specific permit limits, 30-day rolling average periods, and threshold alert levels. All configurations are reviewed and validated by the plant's environmental and process engineering teams before production deployment.
Full Production Deployment & Report Generation Validation
The automated analytics platform operates in full production mode across all connected data sources and regulatory programs. Compliance dashboards display real-time emissions, CEMS status, and permit limit compliance across all monitored parameters. Scheduled reports are generated automatically per the compliance calendar, with review and approval workflows managed through the platform's notification system. A parallel operation period of 30 to 60 days validates automated report outputs against manually prepared reports, ensuring calculation accuracy and regulatory compliance before transitioning to automated submission workflows. All reports include the immutable data trail that supports each reported value.
Continuous Compliance Benchmarking & Program Expansion
With 8-plus weeks of production automated reporting data, iFactory generates monthly compliance metrics reports comparing pre-deployment baselines against current performance: report generation labor hours eliminated, calculation error rate reduction, audit response time compression, and late-submission risk elimination. These benchmarks quantify the compliance program return and guide expansion to additional regulatory programs, plant systems, and reporting formats. Platform updates occur automatically as EPA calculation methods are revised and state regulatory requirements evolve, ensuring ongoing compliance without environmental staff having to track regulatory changes manually.
See iFactory's Automated Compliance Platform — Deployed at Operating Cement Plants.
iFactory integrates automated EPA emissions reporting, CEMS data quality analytics, real-time compliance dashboards, audit trail automation, and scheduled report generation into a single platform purpose-built for the regulatory environment of cement manufacturing.
Expert Perspective: What Changes When Automated Analytics Drives Cement Plant Compliance Reporting
The most significant operational shift that automated compliance reporting creates at a cement plant is not any single report generation improvement — it is the system-level effect of connecting CEMS data to process information, fuel consumption records, and quality lab results in a single analytics platform that generates submission-ready reports with complete data lineage. In a conventional cement plant compliance operation, CEMS data, process data, fuel data, and lab data are managed by separate teams working from different systems on different time cycles.
We operate a 1.5-million-ton-per-year integrated cement plant in the Midwest with one preheater-precalciner kiln line, two inline raw mills, and three finish mills. Before deploying iFactory's automated analytics and compliance reporting platform, our environmental team of three people spent approximately 60% of their time on data collection, spreadsheet calculations, and report formatting — leaving only 40% for the higher-value work of emissions reduction analysis, process optimization support, and regulatory strategy. The automated platform fundamentally changed that ratio. Our quarterly EPA emissions reports, which previously required five business days of concentrated effort from two team members, are now generated in 45 minutes with automated data validation that catches inconsistencies before they reach the submission file.
The compliance dashboard has been equally transformative for our day-to-day operations. We have 14 separate CEMS analyzers across the kiln stack, raw mill baghouse, and finish mill baghouse, each with its own calibration schedule, drift check requirements, and data availability tracking. The manual effort of monitoring these across three shifts was absorbing 6 to 8 hours of environmental staff time per week just on status checks. The automated dashboard now displays all 14 analyzers on a single screen with real-time status, calibration due dates, and data availability percentages. When a PM analyzer on our kiln stack started showing a gradual calibration drift that the weekly manual review was not catching, the dashboard's trend detection algorithm flagged the developing issue 14 days before the drift would have exceeded the 5% RATA limit. Our team coordinated with the instrument technician to replace the sensor optics during a scheduled maintenance window, avoiding a 72-hour period of missing data that would have triggered EPA reporting at the highest emission rate from the previous 720 hours.
The audit trail module proved its value during our most recent EPA information request. The agency requested supporting documentation for three quarters of kiln stack emissions data. Under our previous manual system, preparing that response would have required two people working for four full days to locate CEMS calibration records, cross-reference process data, and compile the supporting narrative. With the automated data trail, our environmental manager generated the complete response package in 90 minutes by drilling from each reported quarterly value through the calculation steps back to the original CEMS readings and calibration records.
The Case for Automated Analytics and Compliance Reporting at Cement Plants Is Measurable, Repeatable, and Available Now
The operational case for automated analytics and compliance reporting at cement plants is documented and commercially significant: automated EPA emissions reporting reduces quarterly report generation from 5 days to 45 minutes and eliminates 18 hours per week of manual data handling, CEMS data quality analytics provides 14-day early warning on calibration drift and maintains continuous 95% data availability monitoring, compliance dashboards consolidate 12 data sources into a single view and reduce compliance status check time from 6 hours to 30 minutes per week, audit trail automation compresses response preparation from 3 to 5 person-days to under 1 hour, and automated report scheduling manages 18-plus recurring compliance reports annually while eliminating 35 person-days of manual preparation labor. Each automated analytics application closes a performance gap that manual spreadsheet-based workflows cannot bridge regardless of staff experience or diligence.
iFactory's Automated Analytics and Compliance Reporting platform is deployable as a brownfield retrofit on live cement plant operations without plant shutdown, control system replacement, or modification of existing CEMS, process PLC, or data acquisition infrastructure. The documented ROI from manual labor elimination, calculation error prevention, audit response time compression, and late-submission risk elimination typically delivers full platform payback within 6 to 10 months at a 1-million-ton-per-year integrated cement plant. Book a Demo with iFactory's cement team to build a site-specific deployment plan and begin the path to automated compliance reporting and analytics at your cement plant.
Deploy Automated Compliance Reporting and Analytics Across Your Cement Plant
iFactory's Automated Analytics and Compliance Reporting platform delivers automated EPA emissions reporting, CEMS data quality analytics, real-time compliance dashboards, audit trail automation, and scheduled report generation in one platform purpose-built for the regulatory environment of cement manufacturing. Deployed on a pre-configured on-premise server with read-only plant system connectivity, no control system modifications required, and a 12 to 18 week deployment timeline.
Automated Analytics and Compliance Reporting for Cement Plants — Frequently Asked Questions
Does automated compliance reporting require replacement of existing CEMS data acquisition systems or process control infrastructure?
No. iFactory's platform integrates via read-only connections to existing CEMS data acquisition systems, process PLC historians, fuel management systems, and quality lab information systems. No plant shutdown, control system replacement, or CEMS hardware modification is required. The analytics layer operates alongside existing monitoring and control infrastructure, generating compliance reports and dashboards from data already collected by plant systems. Book a Demo to review your cement plant's data architecture with iFactory's engineering team.
How does the platform handle changes to EPA reporting methods and calculation procedures?
iFactory's regulatory calculation engine is updated to reflect EPA method revisions, new rule requirements, and state regulatory changes as they become effective. The platform includes an automated regulatory update service that notifies the plant environmental team when calculation methods or reporting formats have changed and applies the updated procedures to the next reporting cycle. The audit trail documents which calculation method version was applied to each reported value, ensuring the data lineage remains complete through regulatory transitions.
What is the typical timeline and payback period for automated compliance reporting deployment at an integrated cement plant?
iFactory's documented deployments show full platform payback within 6 to 10 months at a 1-million-ton-per-year integrated cement plant. The deployment timeline from initial data audit to full production operation with validated report generation is approximately 18 weeks across four phases. Primary ROI drivers are manual labor elimination (70 to 85% reduction in environmental staff time spent on data collection and reporting), calculation error prevention, audit response time compression, and late-submission risk elimination.
Can the platform handle multiple kiln lines, alternate fuels, and different cement product types across a single plant?
Yes. The platform is designed for multi-kiln, multi-fuel, and multi-product cement plant configurations. Each kiln line's CEMS data, fuel consumption, and clinker production are tracked independently for emissions calculations that require kiln-specific reporting. Alternate fuel usage including tires, biomass, and hazardous waste is tracked with separate calculation methods per fuel type. Finish mill data is segregated per product type for product-specific PM reporting and GHGRP allocation. The compliance dashboard presents data aggregated at the plant level with drill-down per kiln line, fuel type, and product category.
How does the platform ensure data integrity and provide evidence for regulatory audits?
Every data point ingested from plant systems is recorded in an immutable analytics log that preserves the original value, timestamp, and source system identifier. All calculation steps are documented with the method applied, parameters used, and result generated. Each submitted report carries a digital signature that verifies the report content matches the analytics log. During a regulatory audit, the environmental manager can drill from any reported emission value through the calculation chain to the original CEMS reading, calibration record, or process data point in seconds rather than the days required to compile documentation from multiple plant systems manually.
Deploy Automated Analytics and Compliance Reporting with iFactory
Environmental managers at U.S. integrated cement plants trust iFactory's on-premise automated analytics platform to eliminate manual compliance reporting labor, generate EPA-submission-ready reports in minutes instead of days, maintain audit-ready data trails, and reduce late-submission risk to zero — all with read-only plant system connectivity and zero modifications to existing CEMS or process control infrastructure.