Cement manufacturing accounts for approximately 7–8% of global CO₂ emissions, making it one of the most closely scrutinized industrial sectors in the emerging landscape of mandatory climate disclosure. With the SEC climate disclosure rules now in effect for public filers, the European Union's CSRD expanding its reach, and California's SB 253 and SB 261 requiring emissions and climate risk reporting from companies doing business in the state, cement producers across the United States are facing a fundamental operational question: how do we generate auditable, defensible ESG metrics from the data we already collect? The data exists in every cement plant — in kiln control systems logging fuel consumption and production rates, in continuous emissions monitoring systems recording CO₂, NOₓ, and particulate matter concentrations, in power meters tracking electrical energy consumption across every plant section, in weighbridge systems recording incoming raw materials and outgoing product shipments, and in laboratory information management systems capturing chemical composition and quality data. The gap between this operational data and the structured ESG reports required by regulators, investors, and customers is not a data gap — it is an architecture gap. This guide covers how cement plants can close that gap using AI-driven analytics and a purpose-built ESG data framework powered by the iFactory ESG Dashboard and Sustainability KPI module.
The Three Pillars of Cement ESG: Environmental, Social, and Governance Metrics
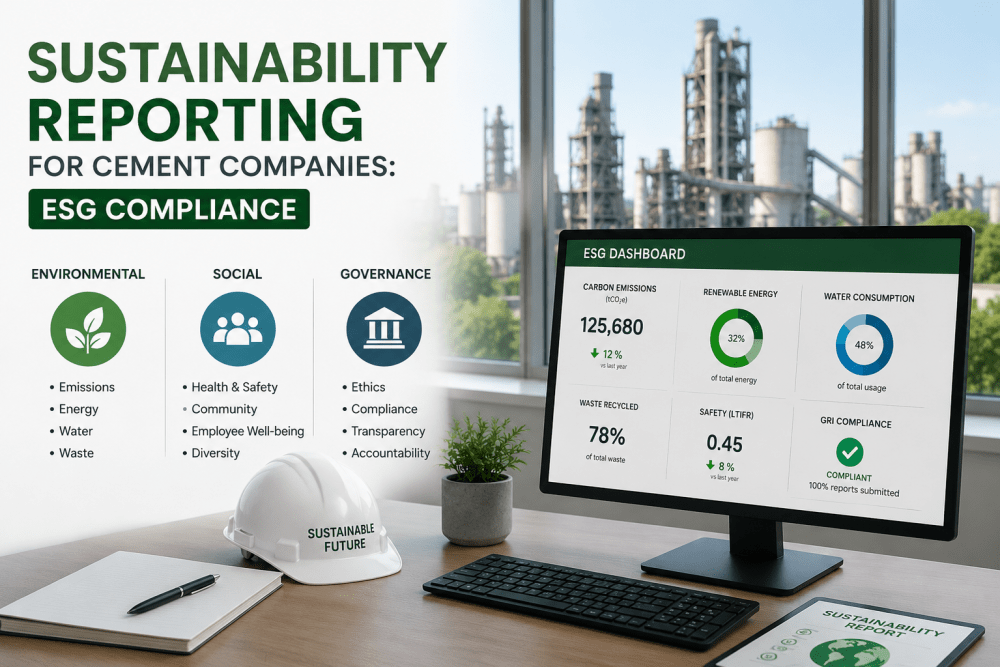
Cement ESG reporting is not a single metric exercise. It demands structured data collection and transformation across three distinct dimensions, each with its own data sources, reporting frameworks, and stakeholder expectations. The iFactory ESG Dashboard organizes cement plant data into these three pillars, providing a unified view that eliminates the silos between environmental compliance, safety management, and governance oversight.
Emissions Tracking Architecture: From CEMS Data to Regulatory Filing
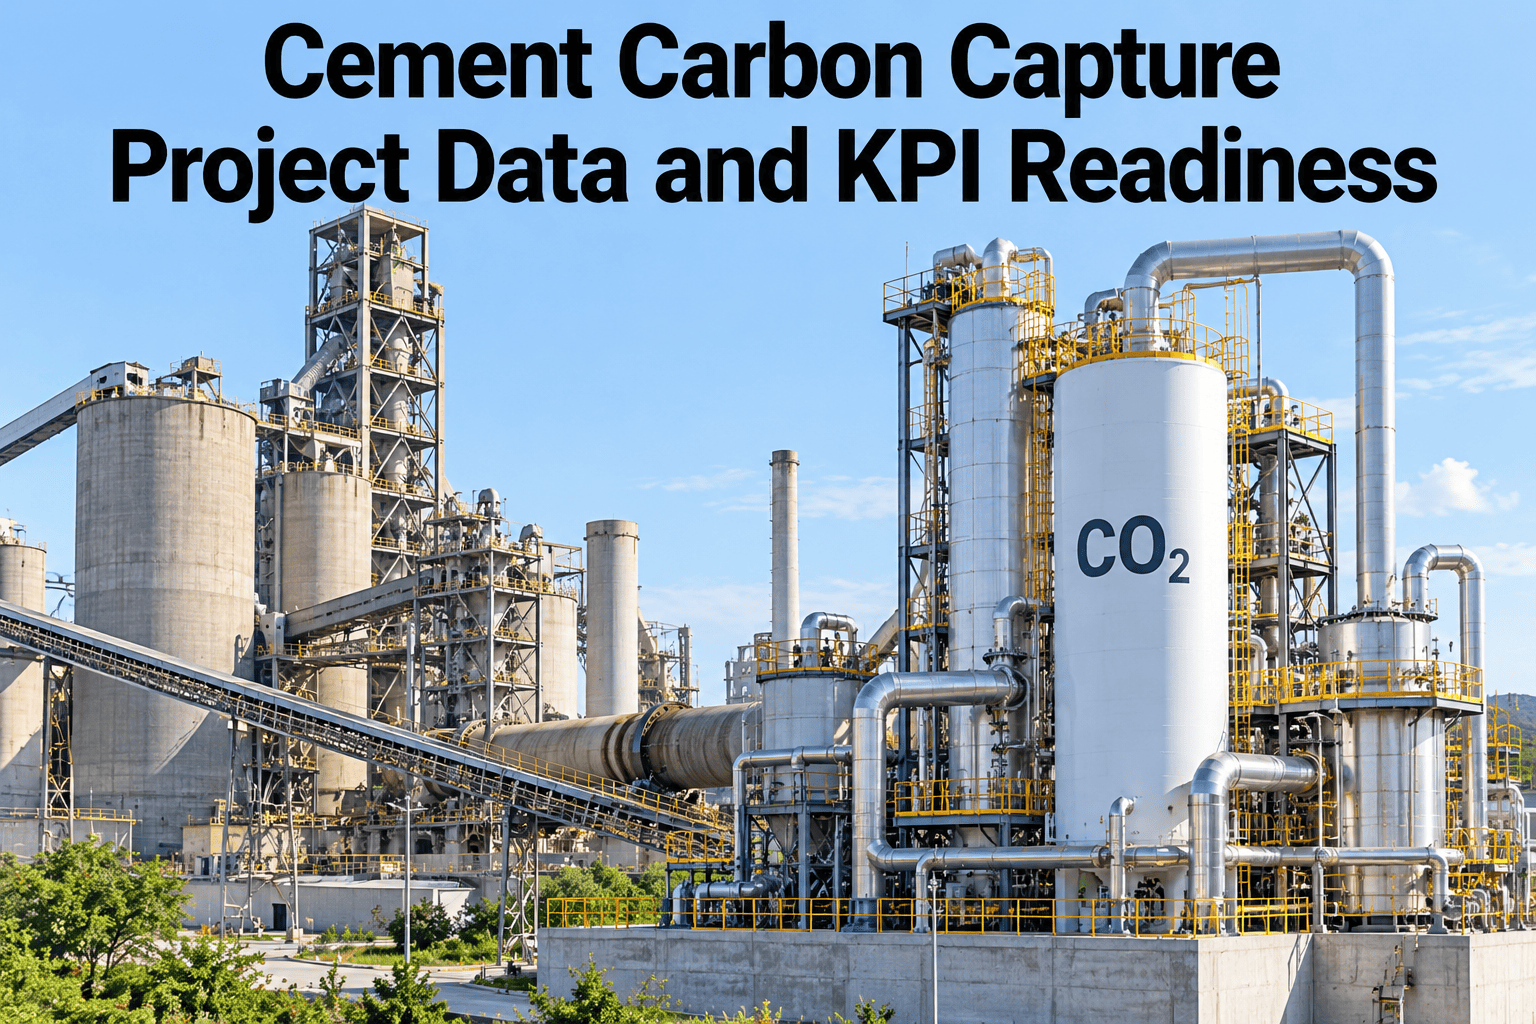
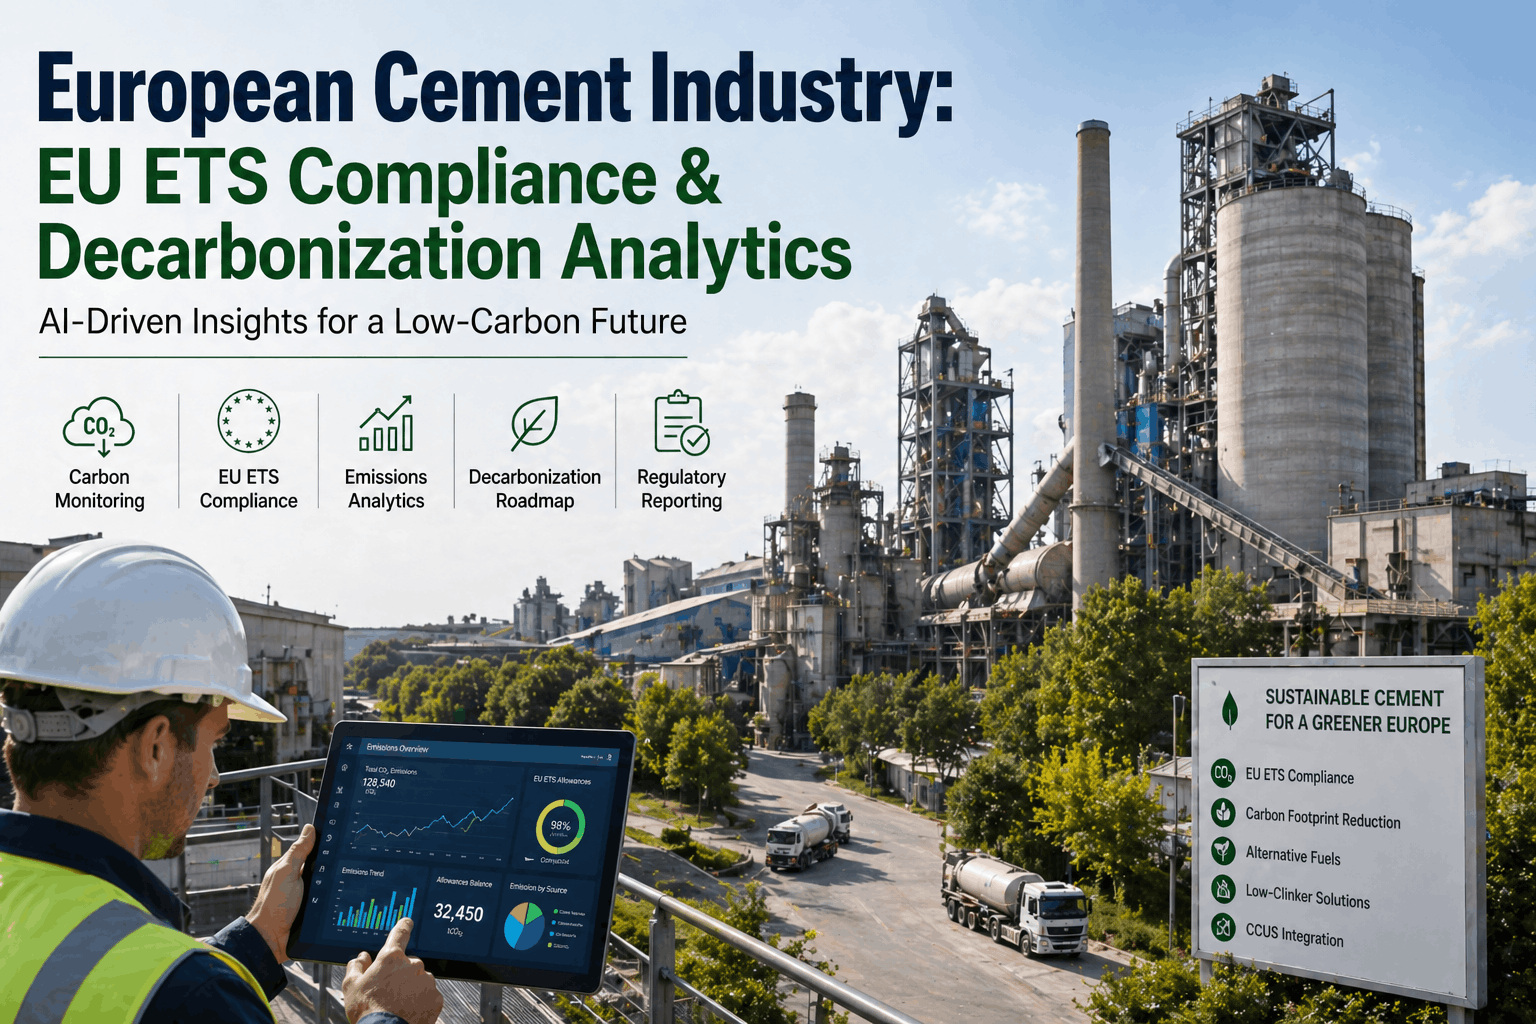
The technical backbone of any cement plant ESG reporting framework is the emissions tracking system. CO₂ emissions from cement manufacturing originate from two distinct sources: calcination of limestone (CaCO₃ → CaO + CO₂), which accounts for approximately 60% of process emissions, and fuel combustion in the kiln, which accounts for the remaining 40%. Both sources must be tracked independently and reported separately under most regulatory frameworks. iFactory's emissions tracking module ingests data from continuous emissions monitoring systems (CEMS) installed on the kiln stack, raw mill stack, and clinker cooler stack — integrating CO₂, NOₓ, SO₂, CO, and particulate matter concentrations with stack flow rate, temperature, and pressure data to calculate mass emissions in real time. The platform also accepts periodic reference method test data (EPA Method 9 for opacity, Method 25A for total hydrocarbons) for parameters that are not continuously monitored, and integrates these discrete measurements into the continuous data stream through interpolation or averaging algorithms that comply with EPA Part 75 data substitution protocols. Book a Demo to see emissions tracking
- CEMS data manually exported to spreadsheets for quarterly reporting — 3–5 days of engineering time per filing period
- Scope 1 emissions calculated in isolation from production data — intensity metric requires separate data pull from plant information system
- NOₓ and SO₂ reporting uses annual average emission factors instead of continuous mass emission calculations
- Water discharge quality data resides in a separate LIMS database — not correlated with production or emissions data
- ESG report assembled by sustainability team from 8–12 separate Excel files — version control and audit trail maintained manually
- Cross-pillar ESG correlations (energy use vs. emissions vs. production rate) require ad-hoc analysis projects
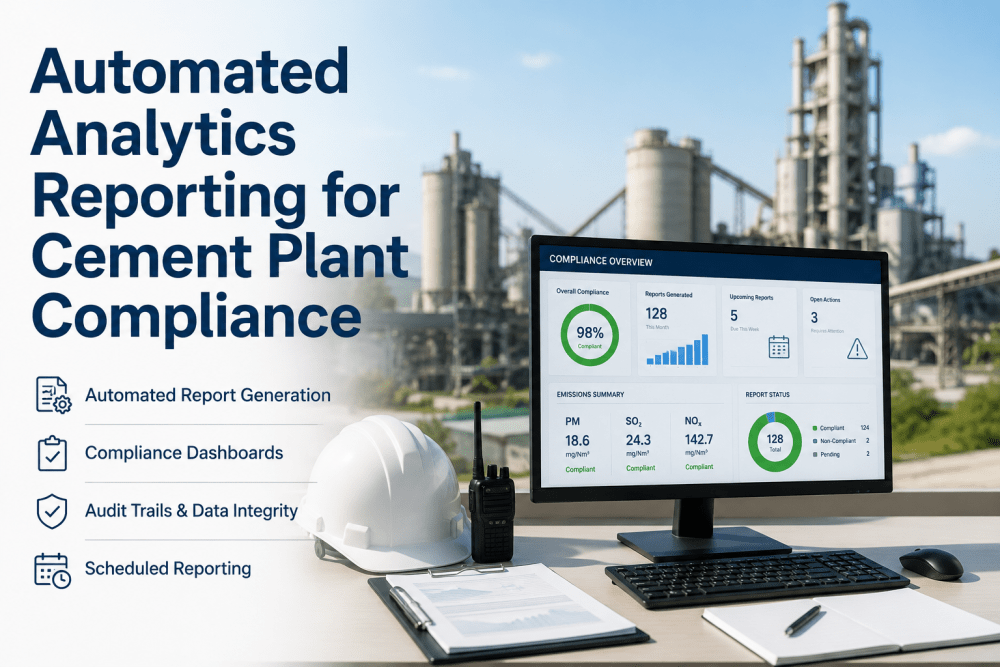
- CEMS data ingested continuously — hourly, daily, monthly, and quarterly emissions reports generated automatically with one click
- Scope 1, Scope 2, and Scope 3 emissions calculated in context with production data — intensity metrics updated in real time
- All regulated pollutants tracked as continuous mass emissions — no factor-based estimation required for core reporting parameters
- LIMS integration brings water quality, raw material chemistry, and product data into the same analytics environment as emissions data
- Single ESG data platform with role-based access, automated data lineage tracking, and complete audit trail for every reported metric
- Cross-pillar analytics engine correlates emissions, energy, water, and production data automatically — identifying efficiency opportunities as they emerge
Energy and Water Intensity: Benchmarking and Continuous Improvement Tracking
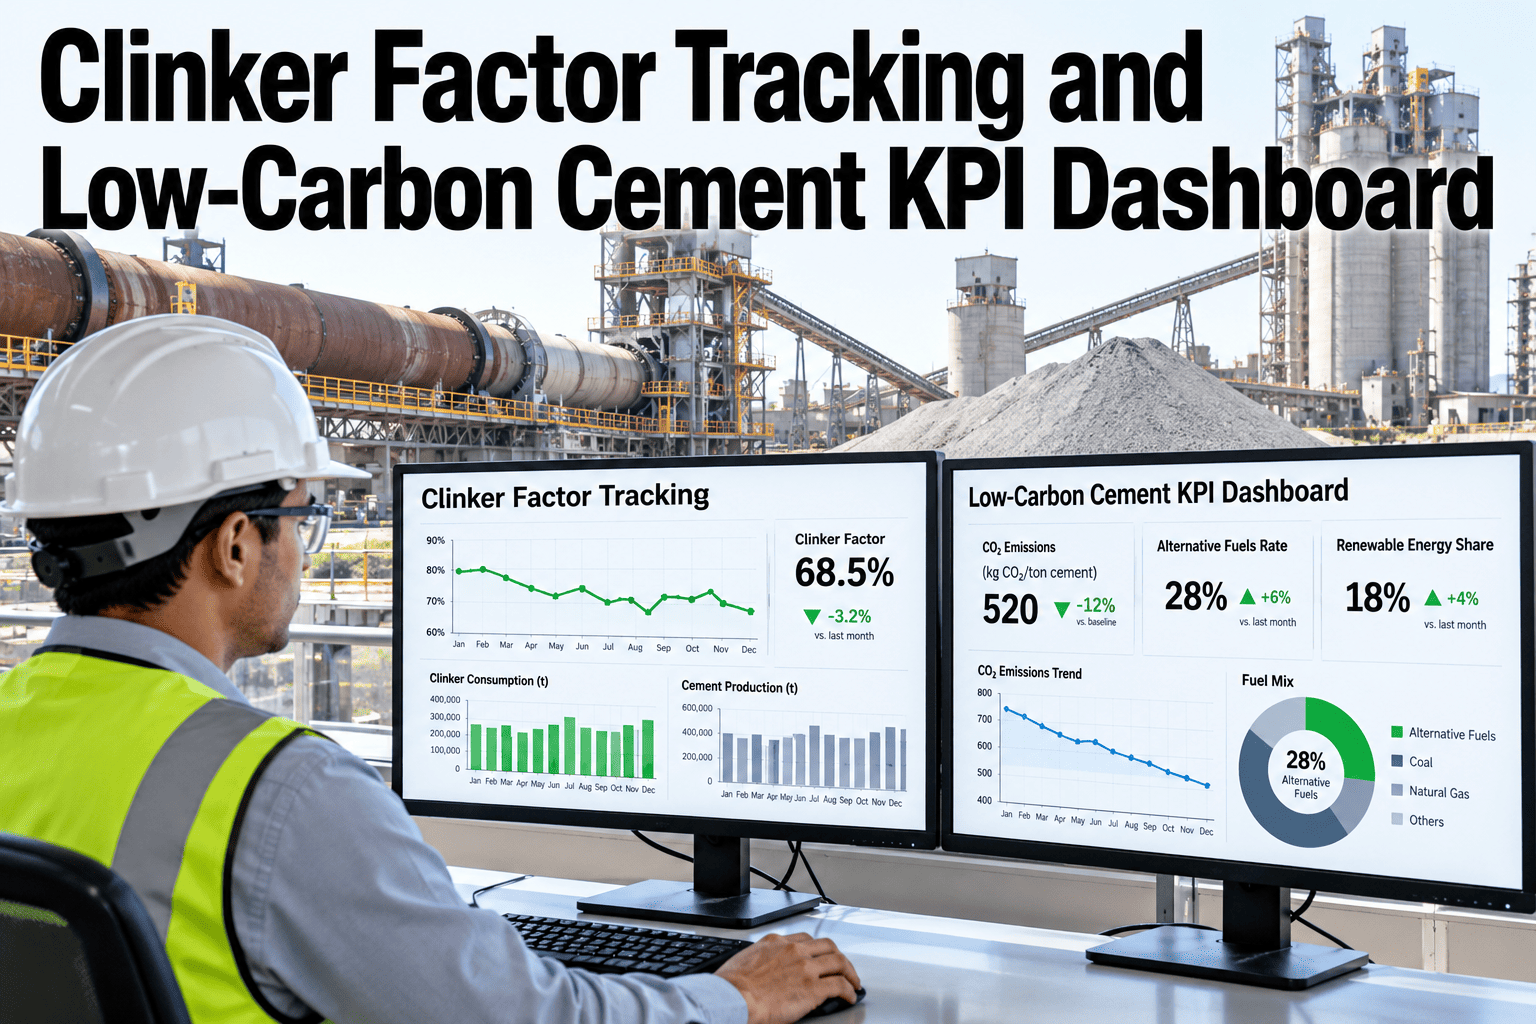
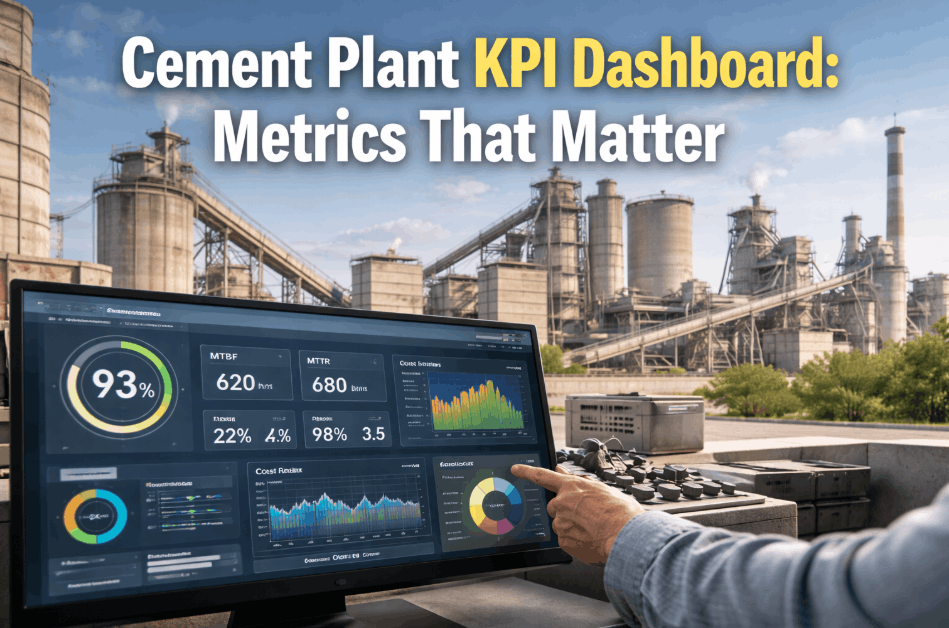
Energy intensity and water intensity are the two operational efficiency metrics that bridge the gap between environmental compliance and financial performance in cement plants. A reduction in energy intensity directly reduces both operating costs and Scope 2 emissions, while water intensity reduction lowers both utility costs and regulatory exposure under increasingly stringent water discharge permits. iFactory's sustainability KPI module tracks these intensity metrics at the process-unit level, enabling plant managers to identify which sections of the plant are deviating from their efficiency baselines and deploy targeted improvement initiatives. The platform correlates energy and water consumption with production rate, raw material quality, and ambient conditions — isolating process-driven consumption changes from efficiency degradation and providing the analytical foundation for continuous improvement programs that are demonstrable to regulators and investors.
Waste Management and Circular Economy Metrics in Cement ESG Reporting
Cement plants occupy a unique position in the industrial waste ecosystem. As one of the few industrial processes that can consume large volumes of waste materials as alternative fuels and alternative raw materials, cement manufacturing is simultaneously a waste generator and a waste consumer. This dual role makes waste management one of the most complex ESG reporting dimensions for cement producers. iFactory's waste module tracks both sides of this equation — waste generated by the plant (hazardous and non-hazardous) and waste consumed by the plant (alternative fuels, byproduct raw materials, and recycled inputs). The alternative fuel substitution rate — the percentage of total thermal energy supplied by waste-derived fuels — is tracked as a core circular economy KPI, with the platform calculating the CO₂ emission reduction attributed to fossil fuel displacement, which is reported separately from process emission reductions in most ESG frameworks.
ESG Metrics, Data Sources, and Reporting Framework Alignment
The effectiveness of any ESG reporting system is determined by how clearly each metric can be traced from its original data source to the final reported figure. iFactory's ESG Dashboard maintains complete data lineage for every metric, showing the upstream data source, any transformations applied, the classification logic used, and the downstream report destination. The table below maps the core cement plant ESG metrics to their data sources, reporting frameworks, and iFactory module features.
| ESG Metric | Data Source | Reporting Framework | iFactory Module | Compliance Value |
|---|---|---|---|---|
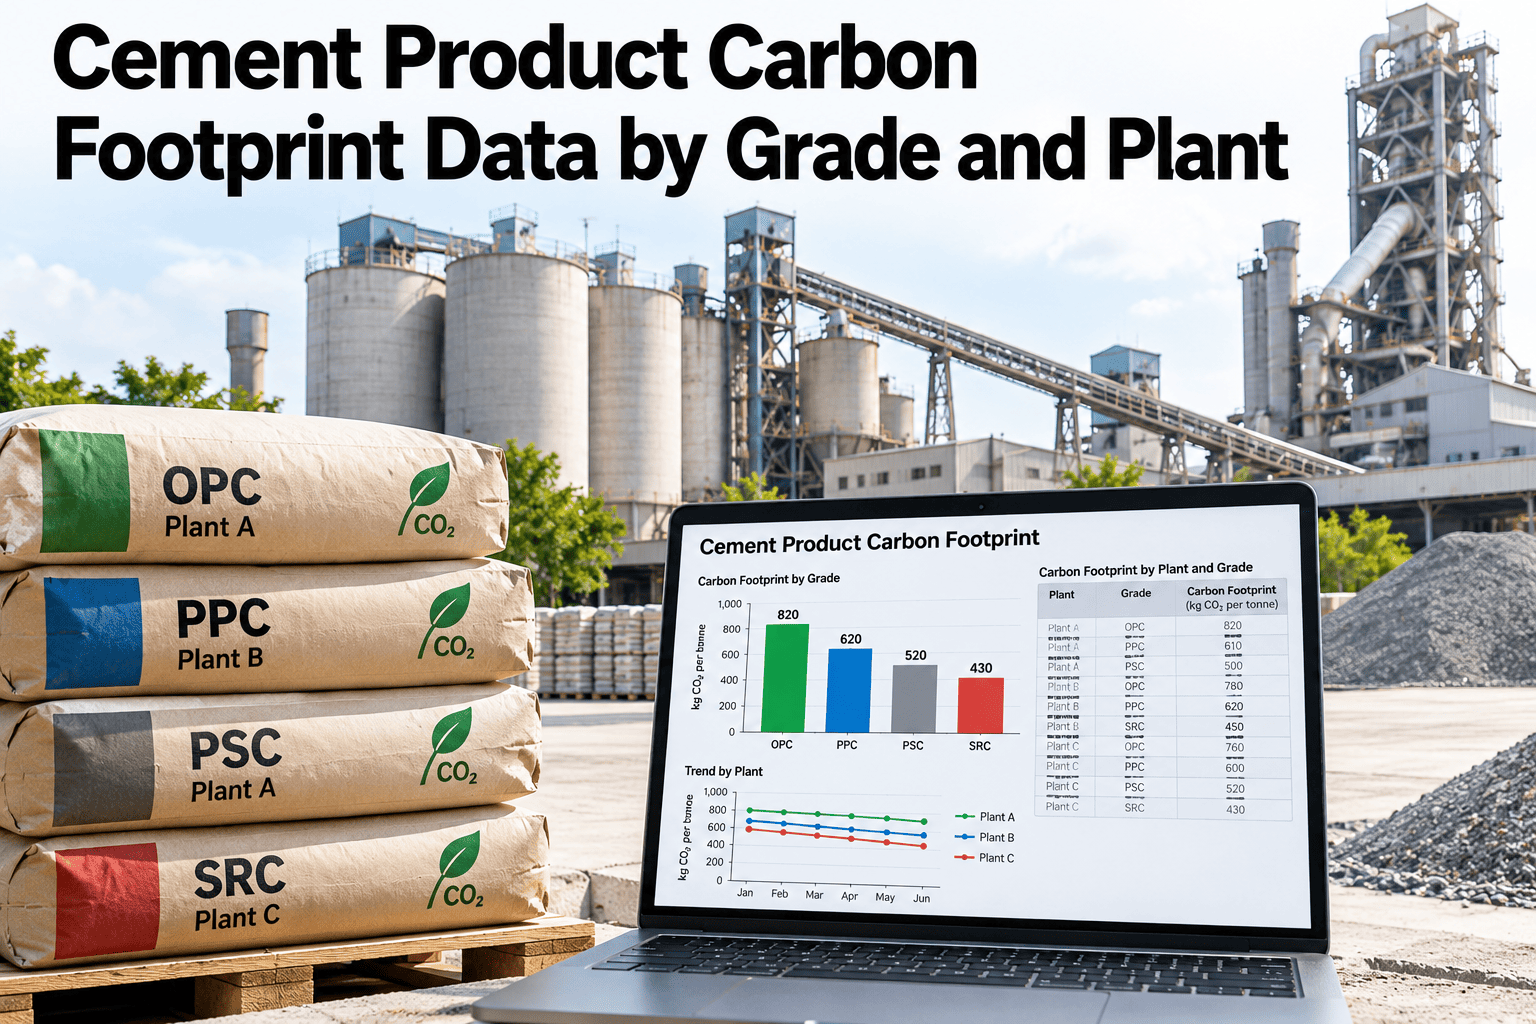
| Scope 1 CO₂ emissions (t CO₂) | Kiln CEMS + fuel consumption + clinker production | SEC, CSRD, GCCA, EPA GHG Reporting Program | ESG Dashboard — Emissions | Direct compliance with EPA 40 CFR Part 98 Subpart H; SEC climate disclosure Rule 1502 |
| Energy intensity (MJ/t clinker) | Kiln gas flow meters + power meters + production data | GRI 302, SASB-EM-CM, CDP Climate Change | Sustainability KPIs — Energy | TCFD-aligned energy management disclosure; CDP scoring improvement |
| Water withdrawal (m³/t cement) | Water meters + pump flow + production data | GRI 303, CDP Water Security, SASB-EM-CM | Sustainability KPIs — Water | NPDES compliance tracking; CDP Water Security disclosure |
| Alternative fuel substitution rate (%) | Waste receiving scale + fuel feed system + kiln control | GRI 306, EU Taxonomy (CE), GCCA Sustainability Charter | ESG Dashboard — Circular Economy | EU Taxonomy contribution to circular economy objective |
| TRIR and LTIF (safety rates) | EHS incident management system + workforce hours | GRI 403, SASB-EM-CM, OSHA recordkeeping | ESG Dashboard — Social | OSHA 300 log compliance; investor safety performance evaluation |
| Board ESG oversight frequency | Board meeting minutes + committee charter | TCFD, ISSB S1, GRI 102 | ESG Dashboard — Governance | TCFD recommended governance disclosure; ISS voting guideline alignment |
Frequently Asked Questions: Cement ESG Reporting and Analytics
iFactory's ESG Dashboard supports all major ESG reporting frameworks relevant to U.S. cement manufacturing: SEC climate disclosure rules (finalized March 2024), California SB 253 and SB 261, the EU Corporate Sustainability Reporting Directive (CSRD) and European Sustainability Reporting Standards (ESRS), the Global Reporting Initiative (GRI) with sector-specific guidance for mining and minerals, the Sustainability Accounting Standards Board (SASB) for construction materials, the Task Force on Climate-Related Financial Disclosures (TCFD), the International Sustainability Standards Board (IFRS S1 and S2), and the Cement Sustainability Initiative guidelines from the Global Cement and Concrete Association (GCCA).
Scope 1 emissions are calculated from CEMS stack data and fuel consumption records using EPA-approved methodology under 40 CFR Part 98 Subpart H and the WBCSD/WRI GHG Protocol. Scope 2 emissions (purchased electricity, steam, and thermal energy) are calculated using the EPA eGRID emission factors for the plant's subregion or supplier-specific emission factors if renewable energy certificates or power purchase agreements are in place. Scope 3 emissions (upstream raw material extraction, transportation, downstream concrete production and use-phase) are estimated using spend-based and activity-based methodologies with supplier-specific data where available.
iFactory integrates with existing instrumentation and control systems through standard industrial communication protocols including OPC-UA, Modbus TCP, and REST API connections to the plant's DCS or SCADA system. CEMS data can be ingested directly from the CEMS data acquisition system, and LIMS data via database connection or flat file import. The platform is designed to work with the sensors and systems already installed in the plant — no new CEMS analyzers, flow meters, or power meters are required. Typical integration timelines are 4–8 weeks per plant depending on the number of data sources and the availability of digital interfaces on existing equipment.
The platform maintains complete data lineage for every metric — from the raw sensor reading or manual entry through any transformations, calculations, and classifications to the final reported figure. Each data point is time-stamped, source-tagged, and user-attributed with an immutable audit trail that external auditors can follow. The platform generates a data lineage map for any reported metric showing: the original data source, the collection timestamp, any data quality flags applied, the calculation methodology used, the version of the calculation algorithm, and the report destination. This level of traceability is designed to meet the reasonable assurance requirements of SEC Rule 1504 and the limited assurance requirements of CSRD Article 34.
A single-plant deployment typically requires 6–10 weeks from kickoff to first ESG report generation, including system integration, metric configuration, framework mapping, and user training. Multi-plant deployments scale with reduced per-plant timelines as data source integration patterns are replicated across sites. The total investment ranges from $45,000 to $95,000 per plant depending on the number of data sources, the complexity of integration requirements, and the number of ESG reporting frameworks required. Most plants achieve full cost recovery within 8–14 months through a combination of reduced engineering time for report preparation, energy and water efficiency improvements driven by real-time intensity tracking, and reduced compliance risk exposure.
Conclusion: ESG Reporting Is Becoming a License to Operate — Your Data Architecture Determines Whether It Is a Burden or an Advantage
The trajectory of cement industry ESG regulation is clear and non-reversible. The SEC climate disclosure rules, California's SB 253 and SB 261, the EU CSRD's extraterritorial reach, and the ISSB's global baseline standards are converging on a single requirement: cement producers must report comprehensive, auditable, and decision-useful ESG metrics — and they must do it now, not next year. Plants that approach this requirement as a one-time compliance exercise — assembling ESG reports from spreadsheets, manual data pulls, and annual consultant engagements — will find themselves repeating the same labor-intensive process every quarter, every year, with escalating data demands and tightening assurance requirements.
iFactory's ESG Dashboard and Sustainability KPI module offers a fundamentally different approach: a continuously operating data architecture that connects every sensor, every meter, every lab result, and every compliance event in your cement plant to a structured ESG reporting framework — generating the metrics your stakeholders need without the manual effort that consumes your engineering and sustainability team's time. The data is already in your plant. The question is whether you have the architecture to turn it into the ESG intelligence your business requires.