The kiln forms the central circulatory nervous system of heavy cement manufacturing. When critical rotating equipment degrades, production flow violently bottlenecks resulting in severe clinker shortages, aggressive supply chain delays, and massive multi-thousand-dollar daily downtime costs. Compounding this, heavy materials operations are subjected to strict safety and environmental codes globally, requiring rigorous documentation to prevent severe legal liability. The primary challenge reliability directors face is executing and enforcing a fully transparent analytics and maintenance strategy that actually prevents degradation rather than merely logging failures retroactively. A comprehensive Cement Plant Analytics KPI Dashboard eliminates catastrophic surprises entirely by establishing algorithmic baselines for critical vibration, temperature, and mechanical wear metrics. By deploying a rigid real-time KPI architecture, engineering teams transition purely from expensive reactionary breakdown repairs into highly controlled, flawlessly documented preventive analytics routines that natively extend heavy component lifecycles seamlessly.
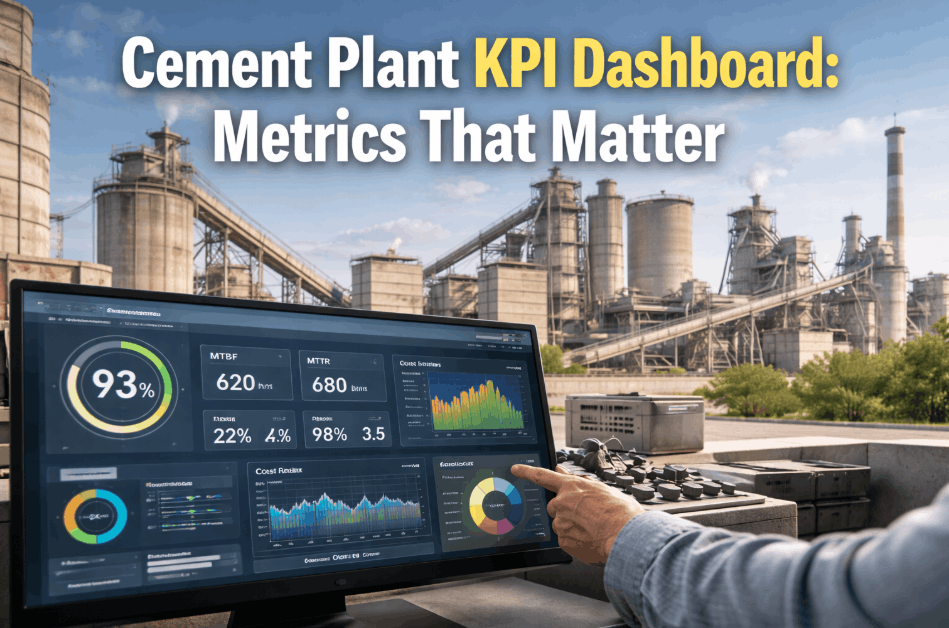
Cement Plant Analytics KPI Dashboard: Metrics That Matter
Standardize and automate your heavy plant maintenance tracking. A complete platform visualizing MTBF, MTTR, PM compliance, and analytics cost ratios directly from the plant floor.
Cement Plant Sub-Systems & Failure Frequency Charts
Understanding exactly where localized failures originate is extremely critical for deploying maintenance resources aggressively. The following charts definitively visualize failure volume distributions across standard cement infrastructure. Analyze your fleet distribution.
Equipment Failure Impact Risk Matrix
Understanding the absolute severity impact of different diagnostic alerts dictates exact dispatch response SLAs. Below is the active service matrix prioritizing bottleneck prevention natively.
Visualizing the Plant with Automated IoT Dashboards
OEE & Asset Availability
Ditch the manual spreadsheets. iFactory pulls real-time PLC run statuses to instantly chart your Overall Equipment Effectiveness (OEE), Availability, and actual Operating Time percentages to the minute.
MTTR & MTBF Automation
Every time a digital work order is closed out by a technician, the dashboard instantly recalculates Mean Time to Repair (MTTR) and Mean Time Between Failures (MTBF) for that specific motor or belt line.
PM Compliance Tracker
Instantly visualize exactly how many Preventive Maintenance (PM) schedules were completed on time versus overdue. The dashboard highlights specific bottlenecks in your reliability workflow perfectly.
Analytics Cost Per Ton
By syncing consumed spare parts inventory with actual SCADA production tonnage, the system provides a live, rolling calculation of your true maintenance dollar spend per ton of cement produced.
Pre-Built Report Distribution Architecture
What a Plant Director Said
Our weekly reliability meetings used to consist of arguing over outdated Excel exports and guessing which conveyor caused the most downtime. By pushing iFactory's KPIs to the master screen, we see MTTR and Compliance scores updating live. The visibility eliminated all guesswork and secured exactly a 20% absolute reduction in unpredicted crusher stoppages within the first 6 months.
Frequently Asked Questions
Can we stream these KPIs to large monitors in the control room?
Yes. The iFactory dashboard includes a native "TV Mode" that auto-refreshes high-contrast charts perfectly suitable for 70-inch displays in the central control room or the morning meeting space.
Does the dashboard pull SCADA data automatically?
Absolutely. Via secure OPC-UA connections, the dashboard pulls live run-hours and fault states directly from your PLCs, ensuring OEE and availability scores are 100% accurate without manual entry.
How easy is it to export data for corporate reporting?
With one click, you can generate formatted PDF reports tailored for corporate executives, or export pure unformatted CSV payloads directly into your existing enterprise BI tools like PowerBI.
Digitize Your Plant KPI Dashboards Safely
Algorithmically track exact equipment lifecycles flawlessly avoiding severe production disruption entirely.