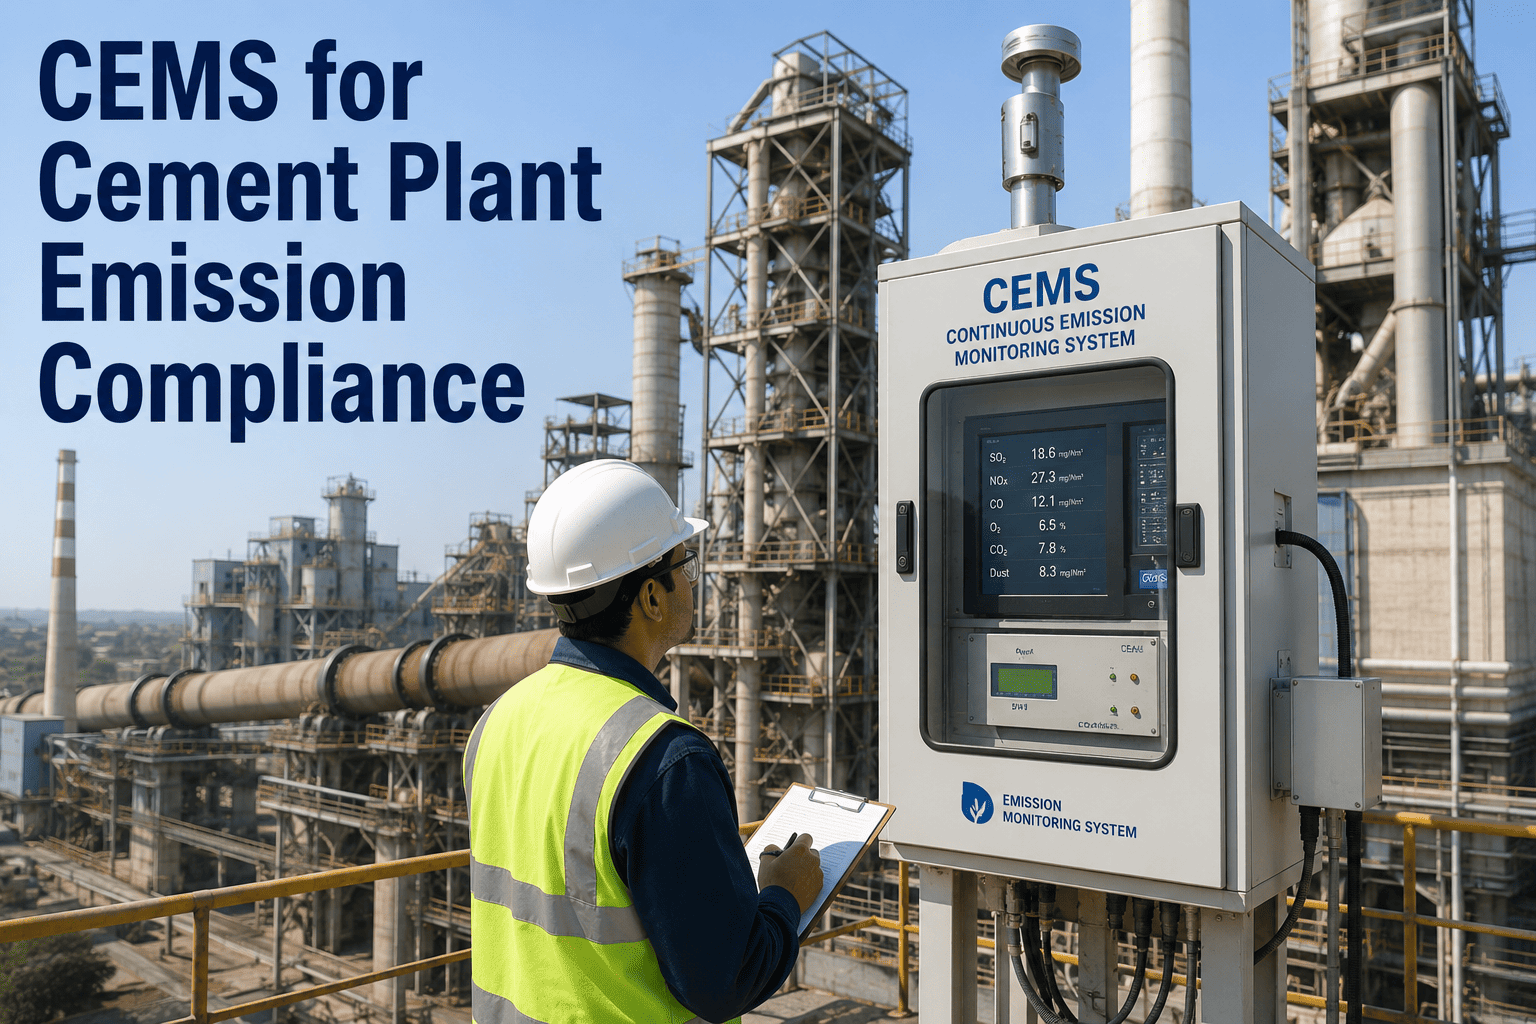
Cement manufacturing is one of the most emissions-intensive industrial processes in the U.S. economy — a single 4,500-tpd integrated plant burning coal and petcoke generates continuous streams of nitrogen oxides, sulfur dioxide, particulate matter, heavy metals, and carbon dioxide that are subject to federal New Source Performance Standards, National Emission Standards for Hazardous Air Pollutants, and state Title V permit conditions simultaneously. Managing compliance across all of these regulatory frameworks while keeping the kiln running at full capacity is the environmental challenge that cement plant managers face every operating day. The problem most plants are managing it with is not the regulation — it's the monitoring infrastructure. Stack-mounted CEMS generate continuous data that no one is correlating to permit limits in real time. Opacity monitors alarm but don't explain root cause. Quarterly compliance reports are compiled manually from historian exports that take a week to reconcile. When an exceedance occurs at 2 a.m. on a Saturday, the environmental team discovers it Monday morning — after the required notification window has already closed. iFactory's environmental monitoring platform connects continuous emission monitoring systems, process control historians, and regulatory compliance frameworks into a single real-time dashboard — giving cement plant environmental managers the visibility to prevent exceedances before they occur document compliance automatically and generate regulatory reports in minutes rather than days.
Real-Time Emissions Monitoring and Regulatory Compliance — Built for U.S. Cement Plant Environmental Managers
Replace manual CEMS data exports and weekly compliance spreadsheets with a live environmental dashboard that tracks NOx, SOx, PM, and CO2 against permit limits — and alerts your team before an exceedance becomes a violation.
What U.S. Cement Plants Are Required to Monitor — and Why Most Fall Short
U.S. cement kilns are among the most heavily regulated point sources in the country. A Title V permit for a major integrated cement plant typically includes simultaneous compliance obligations across four distinct federal regulatory frameworks, plus state-specific requirements that layer on top. Most plants have the monitoring hardware required by regulation — the CEMS instruments are installed, the opacity monitors are running, the process data historians are logging. The gap is in what happens to that data between the instrument and the compliance report. Here is the regulatory monitoring matrix that every U.S. cement plant environmental manager is working within.
| Regulatory Program | Pollutants Covered | Monitoring Required | Reporting Frequency | Typical Penalty per Violation |
|---|---|---|---|---|
| NSPS Subpart F | Particulate matter, opacity | Continuous opacity monitor, stack PM testing | Quarterly + semi-annual | $37,500/day |
| Portland Cement NESHAP (40 CFR 63 Subpart LLL) | Mercury, THC, HCl, PM, dioxins/furans | CEMS for Hg, THC; periodic stack tests for others | Quarterly deviation reports | $70,000/day |
| Title V Operating Permit | All regulated pollutants at major source | CEMS, opacity, process parameter surrogates | Annual compliance certification | $37,500–$70,000/day |
| MATS / Acid Gas Rule | HCl, SO2, NOx | CEMS or COMS; sorbent trap monitoring | Quarterly + semi-annual | $70,000/day |
| State SIP Requirements | NOx, SO2, VOC, CO (varies by state) | CEMS where required; parametric monitoring | Monthly to quarterly | Varies — $10K to $100K/day |
| GHG Reporting (40 CFR 98) | CO2, CH4, N2O (process + combustion) | Calculated from fuel and clinker production data | Annual | $44,539/day for reporting failure |
The monitoring instruments for all of these programs are typically in place — the compliance gap occurs in the workflow between raw CEMS data and permit-limit comparison. Most plants are reviewing CEMS data in daily or weekly historian exports, not in real time against specific permit thresholds. An exceedance that occurs at 11 p.m. on a Tuesday is discovered Wednesday morning — after the plant was already in violation for nine hours and after the regulatory notification deadline may have passed.
The Four Critical Emissions Streams Every Cement Plant Must Control
Cement kiln emissions management is not a single problem — it is four distinct monitoring and control challenges running simultaneously, each with its own measurement technology, permit limit structure, and process control response. iFactory's environmental monitoring platform addresses all four in a unified dashboard. Book a Demo to see the platform configured for your facility's specific permit limits and monitoring points.
NOx from cement kilns is generated primarily through two mechanisms — thermal NOx from high flame temperatures in the burning zone and fuel NOx from nitrogen in the combustion fuel — with a smaller contribution from nitrogen in the raw meal. The process control levers for NOx reduction are well understood: SNCR reagent injection rate, calciner temperature optimization, and primary air management. The monitoring challenge is that most kilns are managed against rolling 30-day average NOx limits, not instantaneous values, which means a facility can be trending toward a monthly exceedance for two weeks without the environmental team seeing it clearly in daily data. iFactory's NOx monitoring module calculates the rolling average in real time, projects the end-of-period average based on current emission rates, and alerts the environmental manager when projected averages approach permit thresholds — before the exceedance is committed, not after it is recorded.
Sulfur dioxide emissions from cement kilns are unusual among industrial SO2 sources in that raw meal sulfur — not just fuel sulfur — is a major contributor. The volatilization-condensation cycle in the preheater-calciner system concentrates sulfur in kiln gas streams, making SO2 emissions highly sensitive to raw material chemistry changes that may not be reflected in fuel sulfur content alone. HCl, regulated under the Portland Cement NESHAP, is driven primarily by chlorine in raw meal and alternative fuels. iFactory connects raw material chemistry laboratory data to CEMS SO2 readings, identifying the raw meal blend changes that drive SO2 exceedances before the kiln processes the material — giving the raw mill team actionable lead time to adjust blending before the emission consequence reaches the stack.
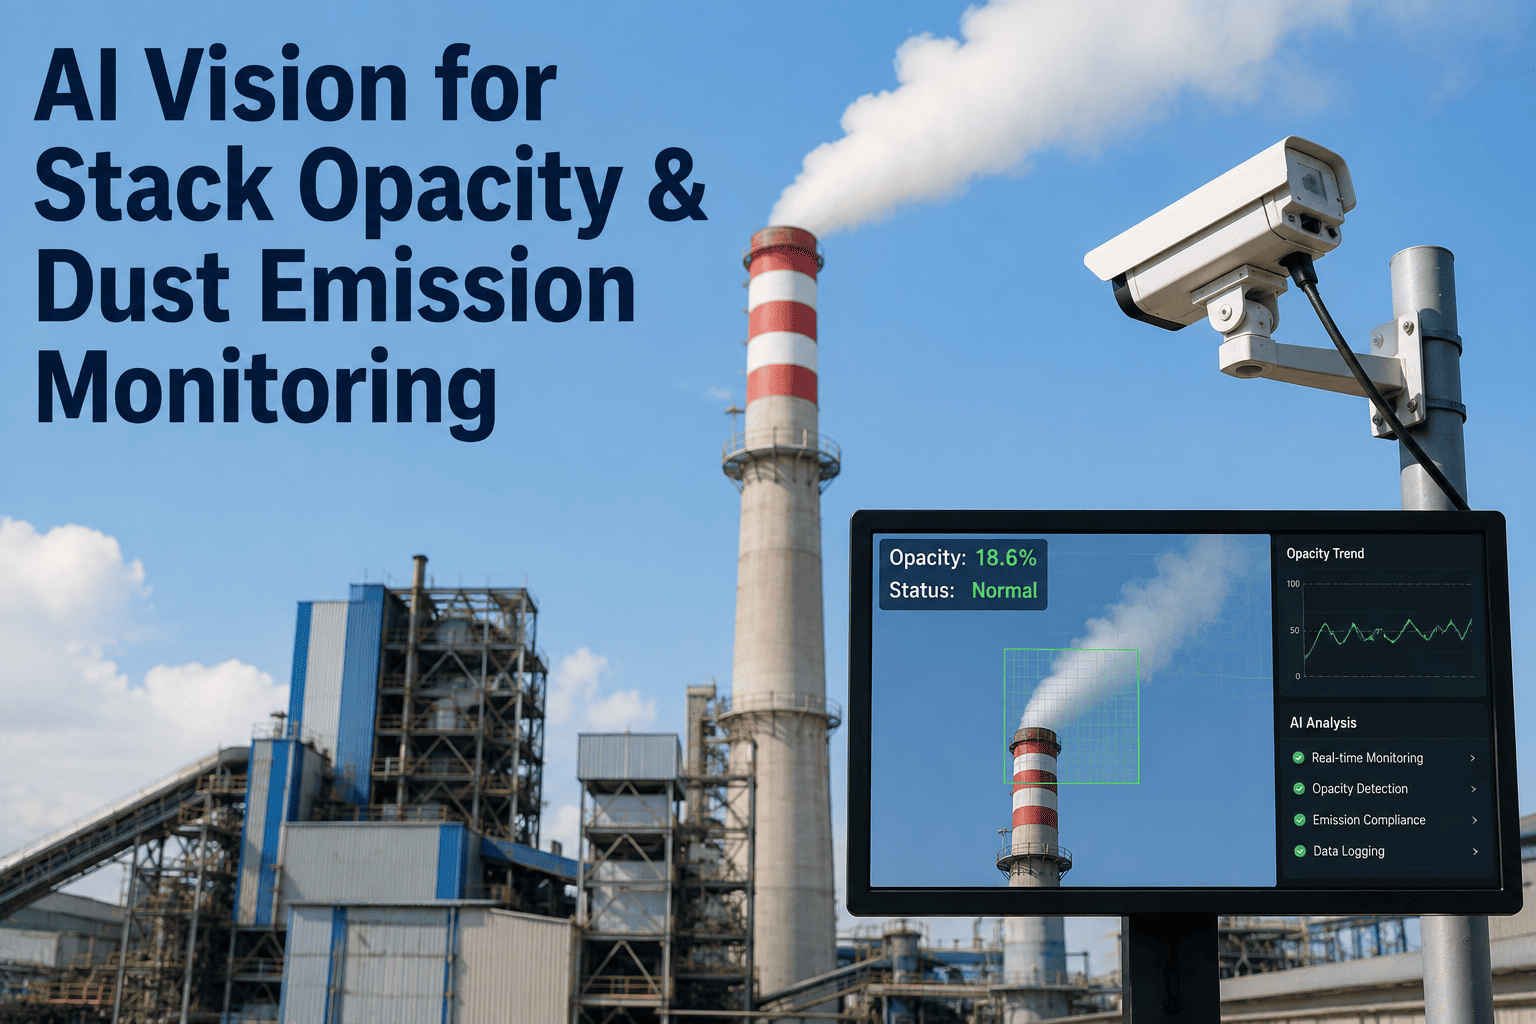
Particulate matter and opacity compliance is driven almost entirely by baghouse and ESP performance — which is in turn driven by filter bag condition, differential pressure management, and pulse cleaning system operation. The relationship between baghouse ΔP and opacity readings is well understood, but most plants are not systematically correlating the two in real time. iFactory connects baghouse differential pressure historian data to COMS opacity readings, establishing the ΔP threshold that predicts opacity exceedance at each monitored stack. When ΔP approaches that threshold — indicating bag pluggage, cleaning failure, or bag leakage — the platform alerts the maintenance team before the opacity reading crosses the permit limit, enabling preventive baghouse intervention rather than reactive exceedance documentation.
Mercury compliance under the Portland Cement NESHAP is managed against a rolling 30-day average limit, which creates the same trending-toward-exceedance risk as NOx rolling averages — a facility can be on a trajectory toward a monthly limit violation for three weeks without clear visibility in daily readings. iFactory tracks the rolling 30-day Hg average in real time, projects the end-of-month value, and alerts the environmental team when the trajectory indicates a limit approach. For CO2, iFactory automates the 40 CFR Part 98 Subpart H calculation methodology — pulling clinker production rates, fuel consumption data, and raw meal carbonate content from existing process historians and generating the annual GHG report inputs directly, eliminating the manual spreadsheet calculation that typically takes two weeks per year per facility.
From CEMS Data to Compliance Certainty: The iFactory Environmental Monitoring Workflow
The compliance gap in most cement plant environmental programs is not the monitoring hardware — it is the workflow between the CEMS instrument and the decision that prevents an exceedance. iFactory's environmental monitoring platform closes that gap in four steps, connecting existing plant data infrastructure to real-time compliance visibility without new hardware installation or IT integration projects.
Connect to existing CEMS and process historians
iFactory reads CEMS data streams, process historian tags, and lab data from your existing plant infrastructure via OPC-UA, PI System, or direct SQL connections. No new monitoring hardware required for standard configurations. Deployment begins within days of data access.
Configure permit limits and rolling average periods
Every permit limit — instantaneous, hourly, daily, 30-day rolling — is configured in the platform using your actual Title V permit conditions. The system calculates real-time compliance status against each limit type simultaneously, not just against the most visible instantaneous reading.
Generate predictive exceedance alerts
When current emission rates project to a permit limit exceedance within a defined lead time — configurable by pollutant and limit type — the platform alerts the environmental manager and the process control team before the exceedance is committed. Process response is possible within the alert window.
Produce regulatory reports automatically
Quarterly deviation reports, semi-annual compliance certifications, and annual GHG reports are generated directly from platform data — no historian data export, no manual spreadsheet compilation, no reconciliation across multiple data sources. Audit-ready documentation available in under 60 seconds.
Environmental Compliance Management — Without and With iFactory
The operational difference between reactive exceedance documentation and proactive compliance management is measured in regulatory penalties avoided, reporting hours recovered, and environmental manager confidence during agency inspections.
Without iFactory
- CEMS data reviewed in daily or weekly historian exports — exceedances discovered hours or days after they occur
- Rolling average compliance calculated manually in spreadsheets — updated weekly, not continuously
- Quarterly deviation reports take 3–5 days to compile from multiple data sources
- No connection between process parameters and emission readings — root cause investigation is manual
- Environmental manager learns of nighttime exceedances the following morning — notification deadline already missed
- GHG report compilation takes 2 weeks annually across fuel and production data from separate systems
With iFactory
- Real-time CEMS dashboard updated continuously — exceedance alerts delivered within 15 minutes to responsible team
- Rolling averages calculated automatically for every pollutant with permit limits — visible 24 hours per day
- Quarterly deviation reports generated in under 60 seconds from platform data with full audit trail
- Process parameter correlation identifies root cause of emission events automatically — no manual investigation
- Alert notifications sent to mobile devices within 15 minutes of exceedance onset — notification window preserved
- 40 CFR Part 98 GHG calculation automated from existing process historian — annual report prepared in hours
Most cement plant environmental managers spend 60% of their week on data compilation rather than compliance management. Book a 30-minute walkthrough and see how iFactory gives that time back — while reducing exceedance risk to near zero.
iFactory Environmental Monitoring: Full Capability Overview
These are live capabilities running on U.S. cement plant networks today — not roadmap features. Each is available at deployment without custom development.
Multi-pollutant compliance dashboard
NOx, SOx, PM, Hg, HCl, and CO2 displayed against permit limits in a single view. Rolling average calculations for each pollutant updated continuously. Color-coded compliance status visible at a glance by any authorized user from any device.
Exceedance forecasting and alerts
Configurable alert thresholds at any percentage of permit limit. Projected rolling average calculations warn the environmental team before exceedances are committed. Mobile alerts delivered within 15 minutes to the responsible person, regardless of hour.
Automated regulatory report generation
NSPS, NESHAP, and Title V deviation reports generated directly from platform data. GHG annual reports calculated per 40 CFR Part 98 methodology from existing historian data. All reports include data quality flags and method compliance documentation.
Process-to-emission correlation analytics
Each emission event is automatically correlated with process parameters — kiln feed rate, fuel composition, SNCR reagent flow, baghouse ΔP — identifying the operational root cause without manual investigation. Countermeasure recommendations generated per emission event type.
On-premise CEMS and historian connectivity
Connects to Thermo Fisher, SICK, ABB, and other CEMS instruments via OPC-UA, Modbus, or direct data link. PI System, AspenTech IP.21, GE Proficy, and any SQL-based historian supported. Zero cloud dependency — all data remains on your plant network.
Permit condition management
Every permit limit, monitoring frequency requirement, and reporting deadline managed in one place. Upcoming reporting deadlines flagged automatically. Permit revision history maintained with version control for audit documentation.
The Cost of Environmental Non-Compliance — and What iFactory Prevents
Environmental violations in U.S. cement manufacturing are not administrative footnotes — they are financial events that affect operating permits, investor relations, and community license to operate. The cost structure below reflects actual enforcement actions and compliance program costs at comparable U.S. cement facilities.
NESHAP and Title V penalty per exceedance day
EPA maximum civil penalty of $70,000 per day per violation under the Portland Cement NESHAP — with multi-day violations the standard outcome when monitoring failures delay exceedance discovery.
Consent decree compliance cost — typical cement plant
Average consent decree remediation cost for a U.S. cement plant environmental violation, including controls retrofit, supplemental environmental projects, and legal fees, over a 5-year compliance schedule.
Production curtailment from permit NOV
A Notice of Violation that restricts kiln production rates while compliance is restored costs a 4,500-tpd plant approximately $180,000 per shift day of reduced output at current clinker pricing.
Environmental manager time on manual reporting
At a facility with 8 to 12 monitored emission points, manual quarterly report compilation consumes 160 to 220 hours per year of environmental staff time — recoverable through automated reporting.
iFactory environmental monitoring platform investment
For a U.S. cement plant with 6 to 12 monitored emission points and existing CEMS infrastructure, iFactory deploys for a total investment that paybacks within the first quarter from reporting labor recovery alone.
What Cement Plant Environmental Managers Say About Real-Time Compliance Monitoring
I have managed environmental compliance at cement plants for eighteen years, and the single biggest shift in how we operate has not been a new control technology — it has been real-time access to our own compliance data. Before we deployed iFactory, our environmental compliance program was fundamentally reactive. We had excellent CEMS instruments generating high-quality data, but we were reviewing that data twenty-four to forty-eight hours after it was generated. By the time we identified a rolling average trending toward a limit, we had already committed most of the exceedance. Our response was compliance documentation, not compliance prevention. The first thing iFactory changed was simple: we could see our rolling NOx average in real time, updated every hour, against our permit limit. Within six weeks of deployment, our kiln operators changed how they managed SNCR reagent rates — not because we told them to, but because they could see the compliance consequence of their process decisions on the same screen as the process controls. That behavioral change alone reduced our NOx exceedance events by over seventy percent in the first operating year. The second thing that changed was reporting time. Our quarterly NSPS deviation reports used to take four days of data reconciliation per quarter. They now take forty-five minutes. Our environmental team went from being data compilers to being compliance managers — proactively analyzing trends, engaging with the process team on root causes, and spending their time on the work that actually prevents violations rather than documenting the ones that already occurred. For any cement plant environmental manager still running compliance from historian exports and spreadsheets, the question is not whether real-time monitoring is worth the investment. The question is how many more quarterly deviation reports you want to compile manually before you make the change."
Conclusion
Environmental monitoring in U.S. cement manufacturing is not a compliance checkbox — it is a continuous operational discipline that determines whether a facility maintains its Title V permit, avoids consent decree exposure, and operates with the community and regulatory credibility that protects long-term production capability. The CEMS instruments most plants already own are generating the data needed for real-time compliance management. The gap is in the workflow between that data and the decisions that prevent exceedances from becoming violations and violations from becoming enforcement actions.
iFactory's environmental monitoring platform closes that gap without new hardware, without IT integration projects, and without replacing existing monitoring infrastructure. Real-time multi-pollutant dashboards, predictive exceedance alerts with 15-minute notification delivery, automated regulatory report generation, and process-to-emission root cause correlation are the capabilities that shift cement plant environmental management from reactive documentation to proactive compliance prevention. The $70,000-per-day penalty exposure, the consent decree costs measured in millions, and the production curtailment risk from permit violations all represent financial events that real-time monitoring prevents. The iFactory platform investment at a U.S. cement facility is recovered from reporting labor reduction alone within the first quarter — before a single exceedance event is prevented. Book a Demo to see iFactory's environmental monitoring platform configured for your facility's specific CEMS infrastructure and permit conditions.
Stop Discovering Exceedances After the Notification Deadline
Your CEMS is already generating the data you need for real-time compliance management. iFactory connects it to a live dashboard, automated alerts, and one-click regulatory reports — deployed on your plant network in 4 to 6 weeks, with no cloud dependency.