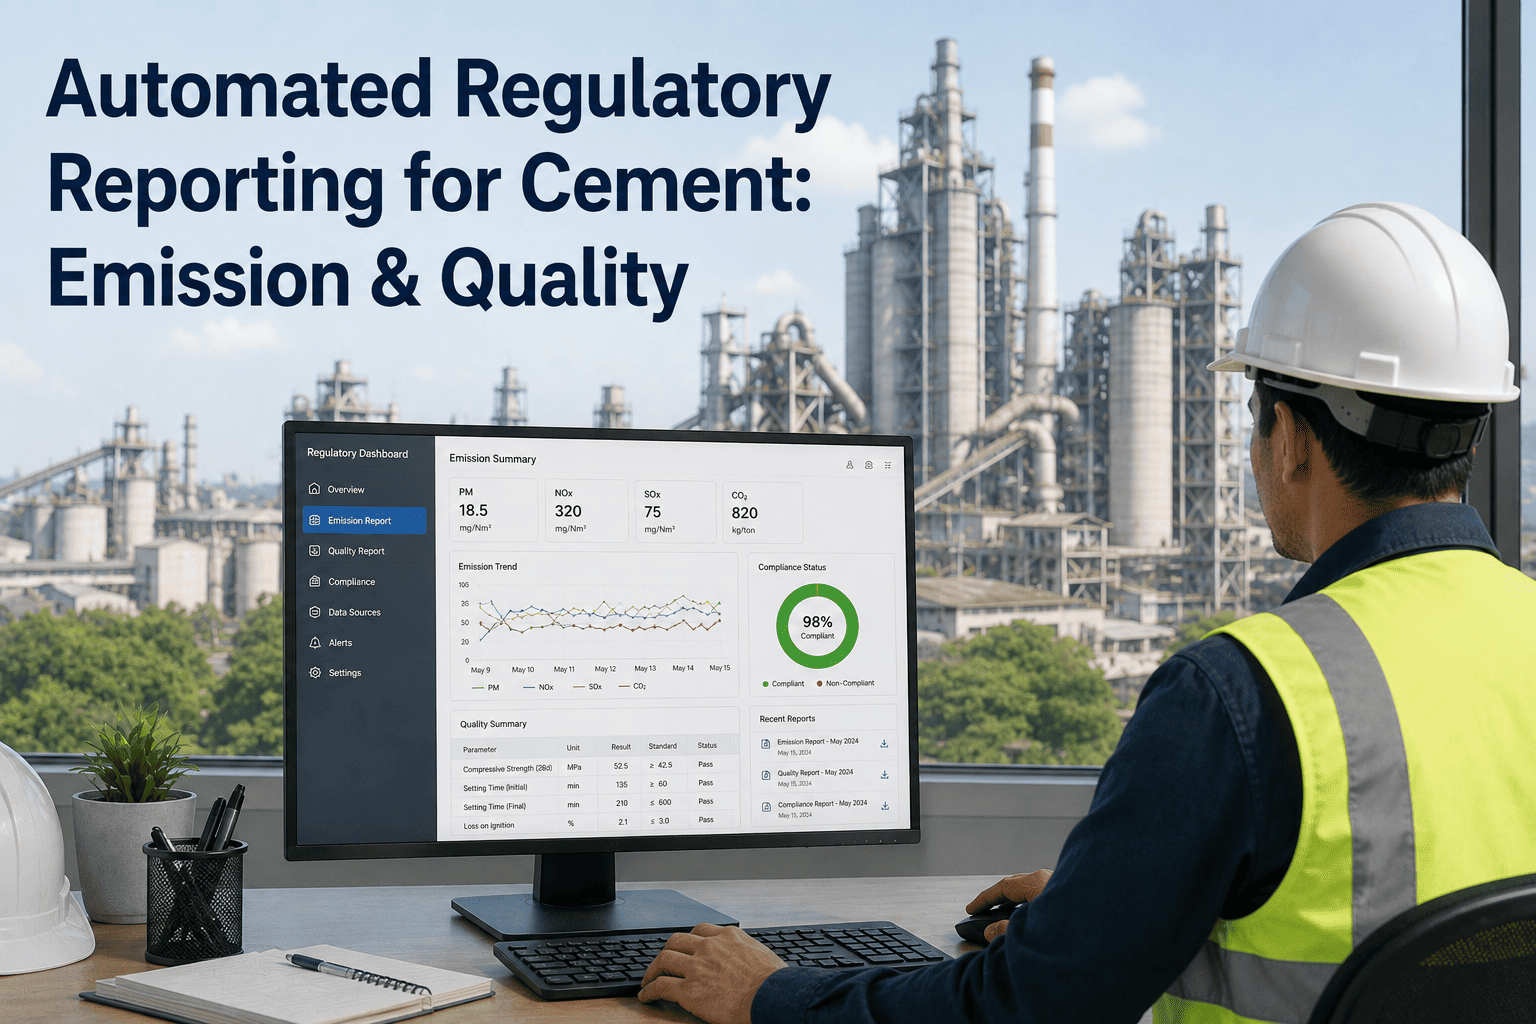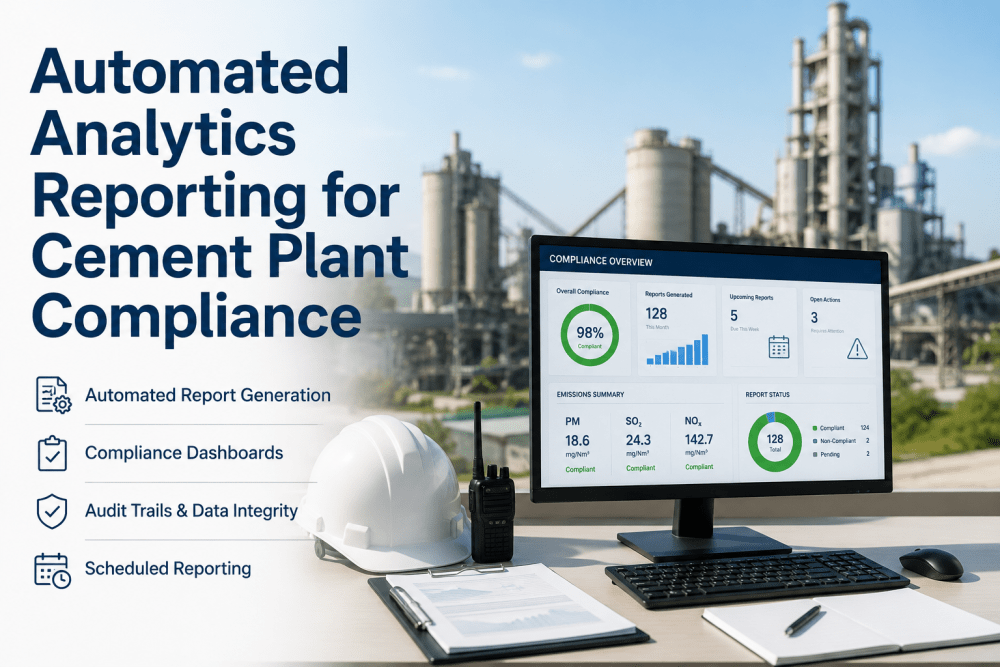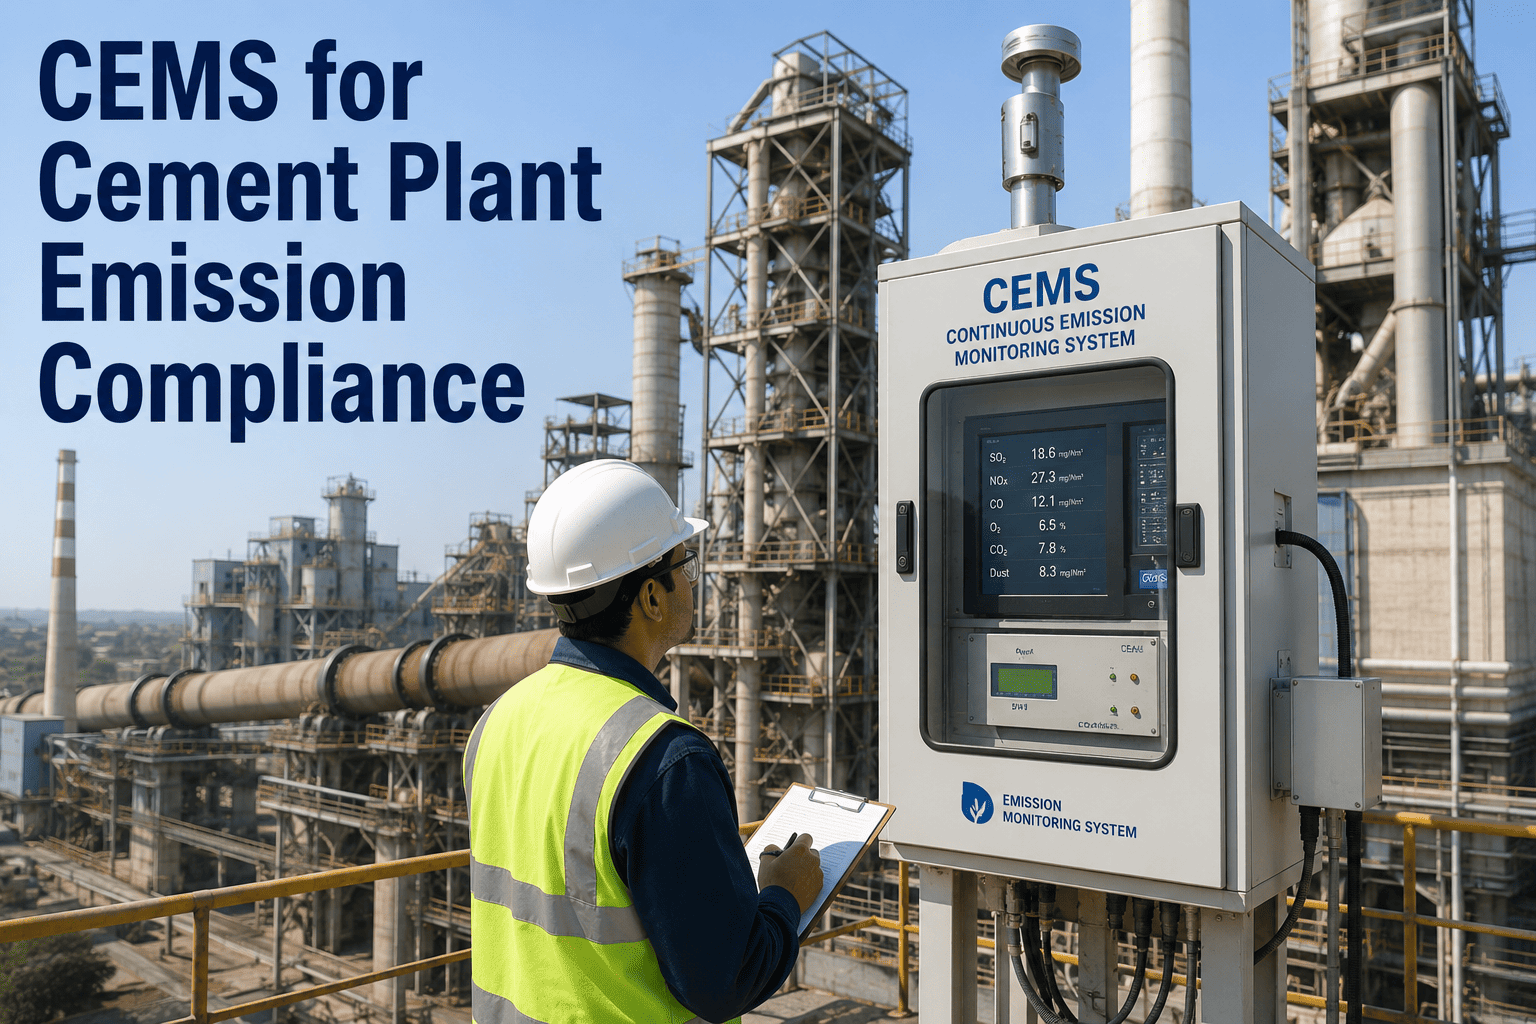
A cement kiln burns at roughly 1,400°C and sends a mix of regulated pollutants up the stack every second it runs — particulate matter, NOx, SO2, mercury, carbon monoxide, and hydrogen chloride among them. Regulators in the US, EU, India, and China all now require continuous, not periodic, monitoring of that stream, and the penalties for a missed reading run from thousands to well over a hundred thousand dollars per day of violation. Most plants have the analyzers. What most plants lack is a system that turns a drifting reading into a maintenance action before the exceedance is recorded. iFactory connects CEMS data directly to maintenance and compliance workflows. Book a compliance workflow demo to see how a threshold breach becomes a work order automatically.
Close the Gap Between a Sensor Reading and a Compliance Action
iFactory turns CEMS analyzer data into automatic work orders, calibration tracking, and audit-ready reporting — before a permit limit is ever crossed.
What Emission Non-Compliance Actually Costs
Emission violations rarely start as a shocking single event. They start as a slow drift that nobody was watching closely enough to catch before the reporting period closed.
typical regulatory penalty range per day of a recorded emission violation
of plants meeting ultra-low NOx standards, the most difficult pollutant to hold in compliance
of plants meeting particulate and SO2 standards, showing the gap is pollutant-specific
typical CEMS reading interval depending on the pollutant and regulatory requirement
The Six Pollutants Every Cement CEMS Program Tracks
Each pollutant carries its own sensor technology, certified measurement range, and regulatory subpart — which is exactly why a spreadsheet-based tracking approach breaks down at scale.
Particulate matter
Measured via beta-ray attenuation or light scattering. Among the higher-compliance pollutants, but baghouse leaks cause rapid spikes.
Nitrogen oxides
Measured via chemiluminescence. The hardest pollutant to hold at ultra-low levels; SNCR reagent performance is the key lever.
Sulfur dioxide
Tracked continuously alongside CO2 and O2 for mass emission rate calculation under Part 75-equivalent frameworks.
Mercury
Certified measurement range as low as 0–5 µg/m³, demanding the most sophisticated instrumentation in the entire CEMS stack.
Carbon monoxide
Monitored as both a combustion efficiency indicator and a direct regulatory limit under most kiln operating permits.
Hydrogen chloride
Required under NESHAP hazardous air pollutant provisions, particularly relevant for plants co-processing alternative fuels.
Overlapping Regulatory Frameworks, One Data Stream
Most cement plants report the same underlying CEMS data to multiple overlapping frameworks, each with its own format, interval, and submission deadline.
See Your Emission Data Connected to Action
iFactory maps your CEMS analyzers to permit thresholds and shows exactly how a warning-level reading becomes a scheduled work order before it becomes a violation.
From Warning to Action: How Thresholds Trigger Response
A single permit limit is not enough to prevent an exceedance. Effective programs configure two thresholds per pollutant, each triggering a different response tier.
Reading tracked and logged, no action required.
Scheduled work order generated for the responsible technician.
Urgent work order with same-shift response requirement.
Reportable event; every prior alert on record for the audit trail.
The iFactory CEMS-to-Compliance Architecture
Analyzer integration
OPC-UA and Modbus connections pull live readings from every CEMS analyzer across every emission point into one data stream.
Threshold configuration
Warning and action thresholds are set per pollutant, per permit, matching the exact limits in your operating permit.
Automatic work order generation
A threshold breach creates a work order automatically, routed to the technician responsible for the relevant equipment.
Calibration and interval tracking
Quarterly certification, semi-annual stack tests, and monthly inspections auto-generate on schedule, with alerts 30 days ahead of each deadline.
Regulatory reporting
Emissions inventory and verified reports are generated directly from monitoring and maintenance records, formatted for submission.
What Changes With Connected Compliance Monitoring
An Environmental Manager's View on Connected CEMS
We had the analyzers and we had the compliance software, but they lived in two different worlds. A NOx reading would drift toward the limit and nobody connected that to a maintenance action until quarterly review. Now a warning-level reading opens a work order on the SNCR system the same day, and our exceedance events have dropped to nearly zero.
Which Maintenance Action Fixes Which Pollutant
A threshold breach is only useful if it routes to the right equipment. These are the most common maintenance actions tied to each pollutant drifting toward its limit.
The Six Compliance Program Gaps We See Most
Most plants are not missing hardware. These are the process gaps that consistently show up between a certified analyzer and a clean compliance record.
Analyzer readings reviewed on a fixed schedule rather than continuously against live thresholds
Calibration and certification dates tracked in a separate system from the emission data itself
No documented link between a warning-level reading and the specific technician responsible for response
Reporting assembled manually each quarter from raw analyzer exports rather than generated continuously
Multi-site operations applying inconsistent threshold definitions across facilities under the same parent permit
Maintenance history for emission-control equipment kept separately from the CMMS used for the rest of the plant
Frequently Asked Questions
Does this replace our existing CEMS analyzers or data acquisition system?
No. iFactory integrates with your existing CEMS hardware and data acquisition system through standard OPC-UA and Modbus protocols. The analyzers keep doing the measurement work they are certified for; what changes is what happens to that data once it is captured.
Can thresholds be configured differently for each regulatory framework we report to?
Yes. Multi-site or multi-jurisdiction operations often carry different permit limits for the same pollutant across facilities. Thresholds, reporting formats, and cadence are configured per site and per framework, so one plant's NESHAP obligations don't get mixed with another's CPCB returns.
How does automatic work order generation reduce actual violation risk?
Most exceedances happen because a drifting reading sat in a dashboard nobody checked in real time. Converting a warning-level reading into an assigned, tracked work order the same day removes that manual review gap, which is where the vast majority of preventable violations originate. Book a demo to see the workflow on your own permit limits.
Is the audit trail defensible for a regulatory inspection?
Every reading, threshold breach, work order, and calibration event is timestamped and archived, giving inspectors a complete record of both the emission data and the maintenance response tied to it. This is generally stronger documentation than a paper log maintained separately from the CEMS data itself.
What is the typical timeline to connect a plant's CEMS to this workflow?
Integration timelines depend on the number of analyzers, emission points, and existing data acquisition infrastructure. Talk to a specialist about your specific CEMS vendor and site count for an accurate scope and schedule.
The Bottom Line on CEMS Compliance
The hardware to measure emissions has existed for decades. What has been missing is the connective layer between a reading and a response — the difference between a dashboard nobody checks and a work order that gets acted on the same shift. Regulatory frameworks will keep tightening, especially on NOx, and the plants that close the sensor-to-action gap now will spend far less time explaining exceedances to a regulator later.
Turn Your CEMS Data Into a Compliance Advantage
Book a 30-minute scoping call. iFactory maps your analyzers, permit limits, and reporting obligations into one connected compliance workflow.