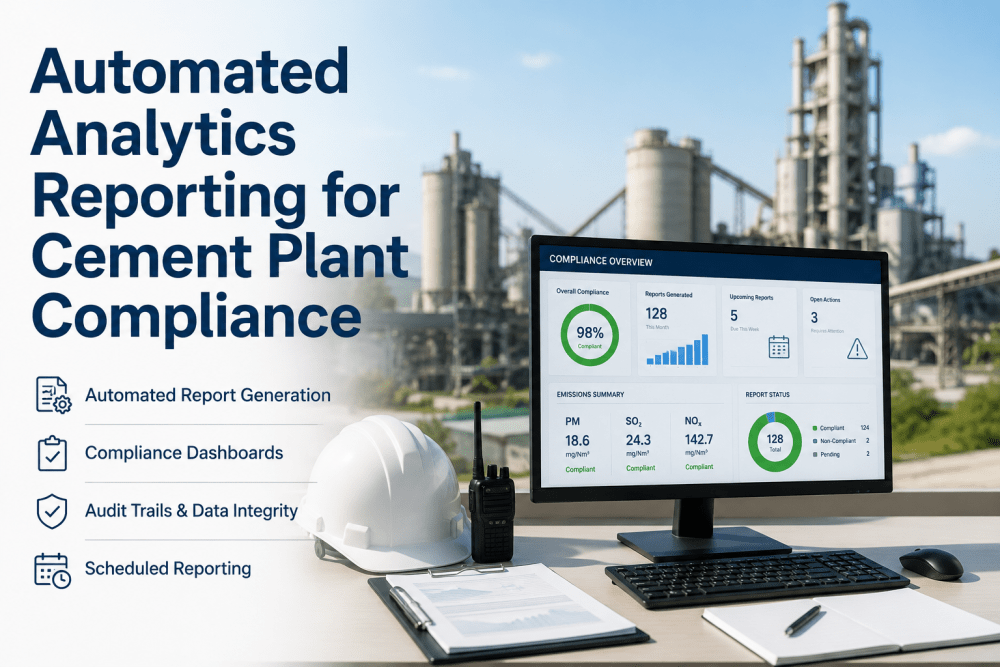
Cement manufacturing plants face a regulatory environment that grows more demanding every year. Stack emissions — particularly sulfur dioxide (SOx), nitrogen oxides (NOx), particulate matter (PM) and carbon dioxide (CO₂) — are now subject to real-time federal and state reporting requirements under the EPA's Part 75 and Part 63 standards. For plant managers and environmental compliance officers, the difference between a $5,000 daily fine and a clean compliance record often comes down to one capability: the ability to predict an emissions exceedance before it happens, not hours after. AI-powered Automated Emissions Monitoring Systems (AEMS) are fundamentally changing how cement producers approach environmental stewardship — shifting from reactive stack readings to predictive, process-correlated intelligence. If your plant is still relying on quarterly audits or manual CEMS calibration, you can book a demo to see how leading producers are transforming compliance into a competitive advantage.
Is Your Plant Ready for Real-Time Emissions Intelligence?
Correlate kiln process parameters with stack emissions data in real time. Predict SOx and NOx spikes before they trigger regulatory violations.
Why Traditional CEMS Are No Longer Sufficient for Cement Compliance
Continuous Emissions Monitoring Systems (CEMS) have been the regulatory backbone of cement plant environmental programs for decades. But hardware-only CEMS were designed for a world where stack readings were isolated data points — not inputs into a living, predictive compliance model. Today, the EPA's 40 CFR Part 75 requires not just measurement, but data availability above 90% uptime, audit trails, and quarterly accuracy certifications. Standalone CEMS hardware cannot deliver predictive context: they tell you what happened at the stack, not why, and never what is about to happen in the next 15 minutes based on kiln feed chemistry or preheater gas temperatures.
AI-powered AEMS platforms bridge this critical gap by fusing process historian data — from raw mill feeders, kiln inlet thermocouples, secondary firing rates, and calciner conditions — with real-time stack analyzer outputs. The result is a digital emissions model of your specific plant that learns the causal relationships between upstream process variables and downstream stack concentrations. When a sulfur surge in the raw material feed begins moving through the preheater, the system predicts the SOx spike 20-40 minutes before it reaches the stack analyzer — giving operators actionable time to intervene. Plants that have already booked a demo consistently report that this process-to-stack correlation layer is the single most impactful upgrade to their compliance programs.
How AI Correlates Process Parameters with Stack Emissions in Cement Plants
The architectural foundation of a modern AEMS is a multi-layer data pipeline that connects every relevant process sensor to a centralized AI inference engine. Unlike generic industrial IoT platforms, a cement-specific AEMS must account for the long and complex thermal chain between raw material preparation and final stack discharge — a journey that can take 30-90 minutes depending on plant configuration. Below is the five-layer architecture that defines best-in-class emissions intelligence platforms.
Raw Material & Feed Chemistry Ingestion
Ingest sulfur content assays, chloride levels, and alkali concentrations from the quarry and raw mill belt weighers. These upstream chemistry inputs are the earliest predictors of combustion-driven SOx and HCl emissions — minutes before any thermal process begins.
Preheater & Calciner Thermal Correlation
Monitor stage-by-stage cyclone temperatures, gas flows, and calcination rates. The AI model identifies the thermal signature patterns in the preheater that precede NOx formation in the kiln burning zone — typically 15-25 minutes of predictive lead time.
Kiln Combustion Parameter Fusion
Fuse oxygen trim data, flame temperature profiles, secondary air ratios, and fuel switching events (coal-to-petcoke transitions) into a unified combustion state vector. Combustion mode changes are the primary driver of rapid NOx and CO exceedances.
CEMS Stack Analyzer Integration & Validation
Connect directly to existing stack analyzers (SICK, Emerson, ABB, Horiba) via OPC-UA or Modbus. The AI layer validates analyzer drift in real time, flags calibration needs before data availability falls below 90%, and substitutes predicted values during certified downtime windows.
Regulatory Reporting & Permit Compliance Automation
Auto-generate EPA Part 75 quarterly reports, Title V permit deviation logs, and state agency excess emissions reports (EER). The system maintains an immutable audit trail with timestamp-locked process data for every exceedance event — eliminating manual compliance documentation entirely.
Pollutant-Specific Monitoring Capabilities and Process Correlations
Each regulated pollutant in a cement plant has a distinct set of upstream process drivers. A purpose-built AEMS maps these causal relationships with trained AI models — enabling intervention strategies that are specific to the pollutant and the operating condition. The table below defines the full monitoring scope for a 1 MTPA integrated cement plant.
| Pollutant | Primary Process Driver | Prediction Lead Time | Intervention Strategy | Regulatory Limit (Typical) | Priority |
|---|---|---|---|---|---|
| SOx (SO₂) | Raw material sulfur content, fuel sulfur | 25–45 min | Feed rate reduction, SNCR injection | 400 mg/Nm³ | Critical |
| NOx | Kiln flame temp, combustion air ratio | 15–30 min | O₂ trim, staged combustion, SNCR/SCR | 500 mg/Nm³ | Critical |
| PM (Particulate) | Baghouse differential pressure, mill load | 5–15 min | Pulse-jet cycle increase, bypass alert | 20 mg/Nm³ | Critical |
| CO | Incomplete combustion, fuel-air imbalance | 8–20 min | Air register adjustment, fuel trim | 500 mg/Nm³ | High |
| HCl | Raw material chloride content, bypass rate | 30–60 min | Bypass adjustment, lime injection | 10 mg/Nm³ | High |
| CO₂ (GHG) | Clinker production rate, fuel mix | Continuous | Blended cement ratio optimization | Scope 1 reporting | Standard |
| Hg (Mercury) | Raw material trace metals, coal quality | 20–40 min | Activated carbon injection | 0.02 mg/Nm³ | Standard |
Six Critical Gaps in Conventional Cement Plant Emissions Programs
Most cement plants pursuing improvements to their environmental compliance programs encounter the same set of structural vulnerabilities. Identifying these gaps before deploying an AEMS platform dramatically accelerates implementation success and helps environmental managers build the business case for leadership investment.
Stack analyzers measure outcomes, not causes. Without upstream process correlation, operators have no advance warning of an exceedance — only an alarm after the violation has already occurred and been logged.
EPA Part 75 requires 90%+ quarterly data availability. Analyzer drift, probe fouling, and maintenance windows routinely push plants below this threshold — triggering substitute data protocols and audit scrutiny.
Compiling Title V excess emissions reports manually from shift logs and CEMS printouts is time-consuming and error-prone. A single transcription error in a state agency report can trigger a formal enforcement inquiry.
Transitions between coal, petcoke, and alternative fuels create transient combustion conditions that spike NOx and CO simultaneously. These events are rarely captured in static permit models and frequently cause unreported exceedances.
CO₂ Scope 1 reporting and criteria pollutant compliance are managed in separate systems, preventing the cross-analysis needed to optimize both simultaneously — especially when evaluating blended cement or alternative fuel strategies.
Baghouse fabric filter failures are the leading cause of visible stack opacity violations. Without predictive differential pressure trending, bag failures go undetected until a visible plume or opacity exceedance triggers a regulatory notice.
Addressing these gaps requires more than upgraded CEMS hardware — it demands an AI inference layer purpose-built for the thermal complexity of cement manufacturing. Environmental managers regularly book a demo to benchmark their compliance risk exposure against industry standards.
End-to-End Emissions Compliance Workflow: From Sensor to Regulatory Report
The following workflow defines how a unified AI emissions platform manages the complete compliance cycle — from real-time sensor ingestion to automated regulatory submission. This process replaces what traditionally requires four separate systems and a dedicated environmental compliance team working across spreadsheets and proprietary CEMS software.
Key Platform Capabilities at Each Workflow Stage
Connect to all major DCS and PLC platforms (Siemens PCS7, ABB 800xA, Rockwell) without requiring hardware replacement. Vendor-neutral integration preserves existing capital investments.
The emissions prediction model retrains automatically as raw material sources, fuel mixes, and production rates evolve — ensuring accuracy without requiring manual recalibration by environmental engineers.
When a predicted exceedance is detected, the system presents the specific corrective action (fuel rate reduction, SNCR reagent increase, mill feed adjustment) ranked by effectiveness and production impact.
Every data point, model prediction, operator action, and exceedance event is logged in a tamper-proof audit trail — satisfying EPA enforcement-level documentation requirements without manual effort.
AI-Powered AEMS vs. Traditional CEMS: A Capability Comparison
For capital investment decisions, plant managers need a clear-eyed comparison between upgrading existing CEMS hardware and deploying an AI-augmented monitoring platform. The following comparison covers the dimensions most critical to cement plant compliance officers and plant engineers evaluating their environmental management roadmap.
Industry Perspective: What Environmental Engineers Are Saying
The transition from traditional CEMS programs to AI-integrated emissions intelligence is now well underway at major North American and European cement producers. Environmental compliance professionals who have deployed predictive AEMS platforms consistently identify the same three transformation milestones in their programs.
Phase 1: Compliance Confidence
In the first 60-90 days, plants report a dramatic reduction in compliance anxiety. Operators who previously waited for stack alarms now act on predicted alerts with confidence — knowing exactly which process variable to adjust and by how much. Exceedance frequency drops by 60-80% in this window.
Phase 2: Process Optimization Insight
By month 6, environmental engineers begin using the emissions correlation data to optimize combustion — not just prevent violations. Understanding which fuel mix ratio minimizes both NOx and specific fuel consumption simultaneously drives measurable reductions in thermal energy costs alongside compliance improvements.
Phase 3: Regulatory Relationship Transformation
After a full year of operation, plants with AI-AEMS platforms report that state agency relationships fundamentally improve. The ability to provide enforcement officers with immutable, process-correlated exceedance data — showing exactly what caused a deviation and what corrective action was taken — transforms regulatory interactions from adversarial to collaborative.
Environmental compliance officers at integrated cement plants consistently report that the ROI calculation for AI-AEMS crosses positive within 8–14 months — driven by avoided penalty costs, reduced compliance labor hours, and measurable fuel optimization savings. The business case is strongest at plants with Title V permits and active state enforcement programs, where a single NOx exceedance event can generate $50,000–$200,000 in penalties.
Modernize Your Cement Plant's Emissions Compliance Today
Deploy a unified AI platform that predicts SOx and NOx exceedances before they reach the stack — built for the thermal complexity of cement manufacturing.
From Stack Measurement to Emissions Intelligence: The Future of Cement Compliance
The cement industry stands at a compliance inflection point. Regulatory agencies are increasing inspection frequency, lowering emission limits, and deploying their own remote sensing technologies to independently verify stack readings. Plants that continue to rely on reactive CEMS programs — where the first indication of a problem is a stack alarm after a violation has already occurred — are accepting escalating risk with every production shift.
AI-powered Automated Emissions Monitoring Systems represent the maturation of industrial environmental management. By fusing process historian data with stack analyzer outputs through trained correlation models, these platforms transform emissions compliance from a defensive cost center into a strategic capability. The plants winning on compliance today are the same plants optimizing combustion, reducing fuel costs, and building regulatory goodwill through transparent, data-rich engagement with enforcement agencies. The technology to achieve this is available now — the only question is which plants will lead the transition.
AI Emissions Monitoring — Common Questions Answered
How accurate are the SOx and NOx predictions from AI correlation models?
Prediction accuracy depends on the quality and completeness of the process data connected to the model. In well-instrumented cement plants with 12+ months of historical process and stack data for initial training, SOx prediction models typically achieve 85–92% accuracy at 30-minute lead times. NOx models, which correlate more directly to measurable combustion parameters (O₂ trim, flame temperature), often reach 88–94% accuracy. The model continuously improves as it accumulates more plant-specific operating data — accuracy increases by 3–6% in the second year of deployment.
Can the AEMS platform connect to our existing DCS and CEMS hardware without a full replacement?
Yes. The platform is designed for brownfield integration and uses vendor-neutral protocols — OPC-UA, Modbus TCP, BACnet, and REST API — to connect directly to existing DCS systems (ABB 800xA, Siemens PCS7, Rockwell FactoryTalk) and stack analyzers (SICK, Emerson, Horiba, ABB). No CEMS hardware replacement is required. The typical integration project takes 8–14 weeks from kickoff to live monitoring, depending on the number of data points and the age of the existing historian infrastructure.
Does AI-generated predicted emissions data satisfy EPA reporting requirements?
AI-predicted data is used operationally to prevent exceedances — it does not replace certified CEMS measurements for regulatory reporting. The platform's value for compliance documentation lies in its ability to maintain 90%+ CEMS data availability (reducing substitute data events), generate automated Part 75 and Title V reports from validated stack analyzer data, and provide process-correlated context for exceedance events that satisfies EPA enforcement documentation requirements. The AI layer enhances, rather than replaces, the certified measurement infrastructure.
What is the typical ROI timeline for an AI-AEMS deployment at a cement plant?
ROI timelines vary by plant size, permit conditions, and historical exceedance frequency. For a 1 MTPA plant with an active Title V permit in a state with aggressive enforcement, the typical payback period is 8–14 months. The primary ROI drivers are: avoided penalty costs ($50,000–$200,000 per exceedance event), reduced compliance labor (15–25 hours per week in manual reporting), and combustion optimization savings ($80,000–$250,000 per year in fuel cost reduction). Plants with frequent NOx exceedance histories typically see the fastest payback.
Does deploying an AEMS mean we can reduce our CEMS maintenance investment?
Not entirely — certified CEMS analyzers remain a regulatory requirement under Part 75 and most state Title V permits. However, the AEMS platform significantly reduces CEMS-related compliance risk by flagging analyzer drift in real time (before quarterly calibration catches it), predicting maintenance windows based on probe fouling trends, and generating automated QA/QC logs that reduce the manual burden of CEMS data validation. The net effect is lower total compliance program cost, not CEMS elimination.