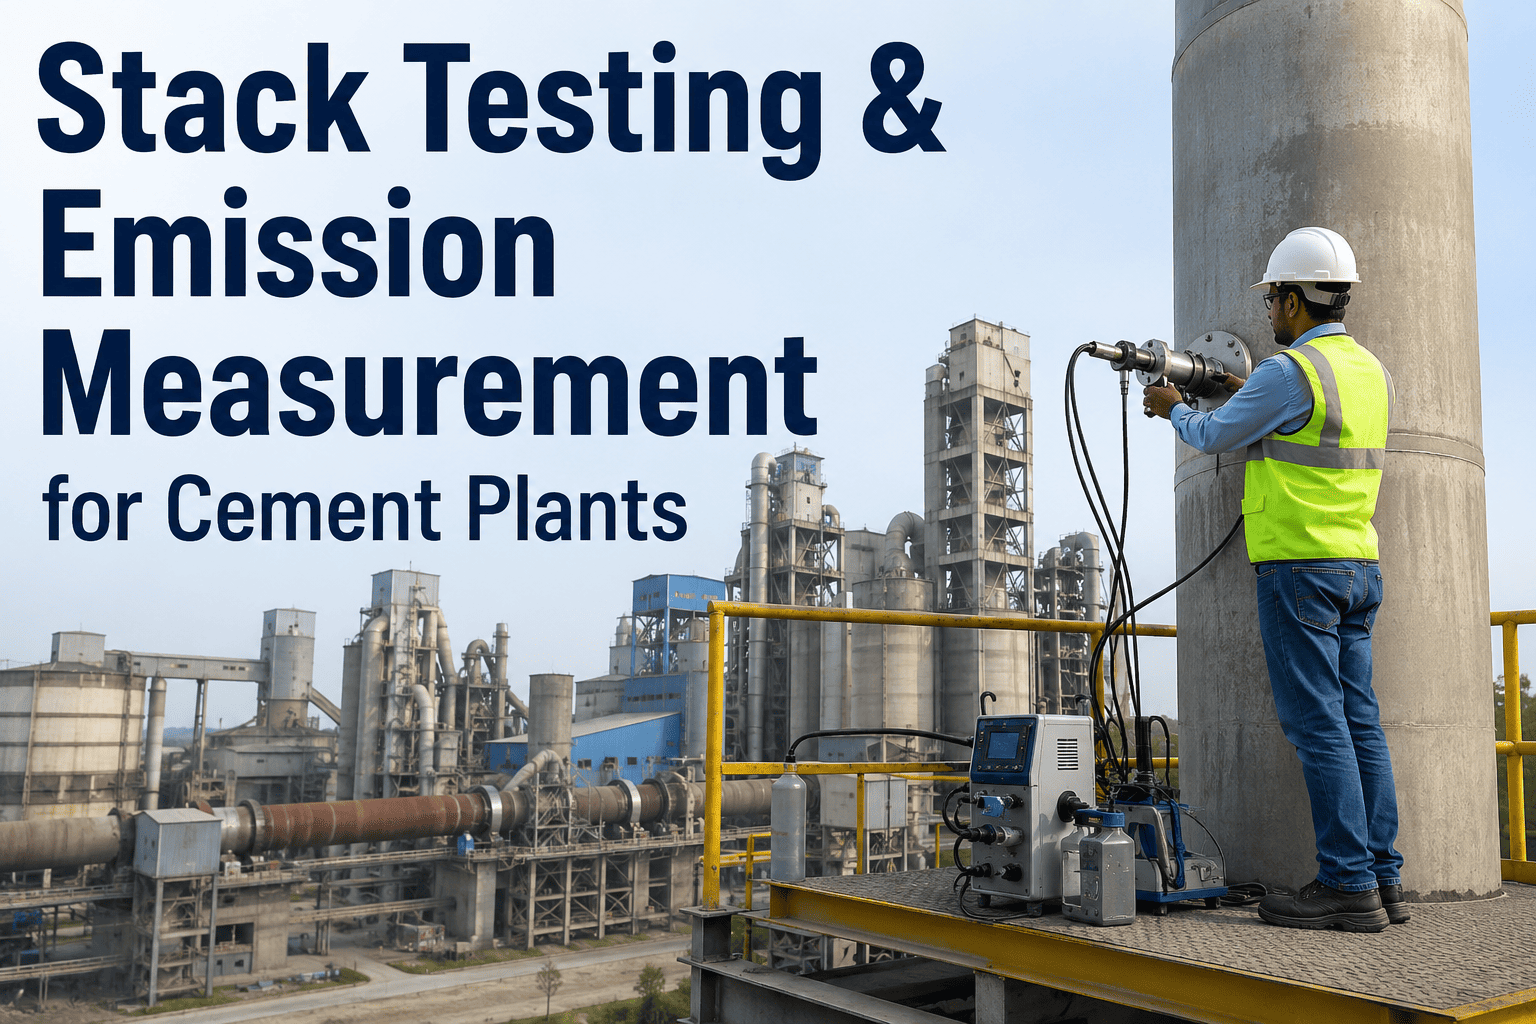
In cement manufacturing, stack emission testing is not merely a regulatory checkbox—it is a critical operational discipline that directly impacts plant compliance, environmental footprint, and community relations. Modern cement plants must navigate a complex web of EPA standards, local air quality mandates, and ever-tightening emission limits for particulate matter (PM), nitrogen oxides (NOx), sulfur dioxide (SO2), and carbon monoxide (CO). This comprehensive guide delivers a deep technical walkthrough of stack testing methodologies, from isokinetic sampling principles to gas analysis protocols, ensuring your facility meets rigorous compliance requirements while optimizing process efficiency. Whether you are a plant manager overseeing a multi-kiln facility or an environmental engineer tasked with emission verification, understanding the nuances of stack testing is essential. At iFactory, we have engineered advanced monitoring solutions that integrate seamlessly with your existing infrastructure, providing real-time data analytics and predictive maintenance capabilities. Book a Demo to see how our platform transforms your emission data into actionable intelligence.
Mastering Cement Plant Stack Testing for EPA & Local Compliance
Achieve precise emission measurement, reduce non-compliance risk, and optimize your dust control systems with proven isokinetic sampling techniques.
The Critical Role of Stack Testing in Cement Plant Operations
Stack emission testing serves as the primary method for quantifying pollutants released from cement kilns, clinker coolers, and raw mills. Accurate measurement is the foundation of any credible emission inventory and is indispensable for demonstrating compliance with Title V operating permits. Beyond regulatory necessity, stack data enables operators to fine-tune combustion parameters, optimize raw feed composition, and identify fugitive emission sources. The stakes are high: non-compliance can result in substantial fines, mandatory process shutdowns, and reputational damage that erodes stakeholder trust. A robust stack testing program, aligned with EPA Method 1 through Method 9 protocols, provides the rigorous framework needed to ensure every measurement is defensible. iFactory's analytics platform integrates directly with your continuous emission monitoring systems (CEMS) and manual stack test results, delivering a unified dashboard for real-time compliance tracking and historical trend analysis. This integration empowers your team to shift from reactive compliance to proactive emission management.
Isokinetic Sampling Fundamentals
Isokinetic sampling ensures that the velocity of gas entering the sampling nozzle exactly matches the stack gas velocity. This eliminates particle size bias and guarantees a representative sample. The procedure requires precise measurement of stack gas velocity using a Type S pitot tube and a manometer, followed by adjustment of the sampling flow rate. Even minor deviations can skew PM concentration results by 10-20%, leading to false compliance or non-compliance declarations. Modern automated isokinetic sampling systems, such as those integrated with iFactory's IoT sensors, continuously adjust flow rates in real time, reducing human error and improving repeatability.
Particulate Matter (PM) Measurement
PM emissions from cement plants consist of raw material dust, clinker dust, and combustion fly ash. EPA Method 5 is the standard for measuring PM concentration, involving a heated filter maintained at 160°C to prevent condensation of moisture and volatile compounds. The filter is weighed before and after sampling in a controlled environment. For PM2.5 and PM10 fractions, a cyclone or impactor is used upstream of the filter. The mass collected, divided by the sampled gas volume corrected to standard conditions (dry, 20°C, 101.3 kPa), yields the emission concentration in mg/Nm³. iFactory's cloud-based platform stores all gravimetric data and automatically generates compliance reports in the format required by your local agency.
Gas Analysis: NOx, SO2, CO, and O2
Gaseous pollutants are measured using extractive or in-situ analyzers. Extractive systems draw a sample through a heated line to prevent condensation, then pass it through a series of gas conditioners and analyzers. Chemiluminescence is the preferred method for NOx detection, while non-dispersive infrared (NDIR) is commonly used for SO2 and CO. Paramagnetic or zirconia cell analyzers measure O2. Cross-sensitivity between gases must be corrected using advanced algorithms. iFactory's edge computing modules perform real-time cross-sensitivity compensation and data validation, ensuring that your reported values are accurate and audit-ready.
Moisture Content Determination
Moisture in stack gas dilutes pollutant concentrations and affects volumetric flow calculations. EPA Method 4 involves condensing water vapor from a known volume of stack gas and measuring the collected liquid. Alternatively, a psychrometric method using wet-bulb and dry-bulb temperatures can be employed. High moisture levels, common in wet-process cement kilns, require careful correction of all emission concentrations to a dry basis. iFactory's data ingestion pipeline automatically applies moisture correction factors to both continuous and manual test data, eliminating calculation errors.
Velocity Traverse and Flow Rate Calculation
Accurate flow rate is essential for converting concentration to mass emission rate. EPA Method 1 and Method 2 specify a traverse of the stack cross-section with at least 12 sampling points for circular stacks and 16 for rectangular stacks. At each point, velocity pressure is measured with a pitot tube, and static pressure and temperature are recorded. The average velocity is computed using the Bernoulli equation, then multiplied by the stack area to obtain volumetric flow. iFactory's mobile app guides technicians through the traverse procedure, recording GPS location, time, and measurements for full traceability.
Quality Assurance and Quality Control (QA/QC)
A rigorous QA/QC program is non-negotiable for defensible stack test data. Pre-test calibration of all instruments, field blanks, leak checks, and post-test verification are mandatory. For isokinetic sampling, the isokinetic variation must be within 10% of the true velocity. Duplicate or triplicate runs are required to assess precision. iFactory's platform includes a built-in QA/QC checklist that enforces these procedures and flags any deviations in real time, ensuring that your data meets the stringent requirements of EPA 40 CFR Part 60 or local equivalents.
Step-by-Step Stack Testing Protocol
Pre-Test Planning
Define test objectives, select sampling locations per EPA Method 1, and ensure stack access ports are unobstructed. Review process conditions and schedule a stable operating period.
Instrument Calibration
Calibrate pitot tubes, thermocouples, manometers, gas analyzers, and balances using certified standards. Document all calibration data in iFactory's digital log.
Preliminary Velocity Traverse
Perform a full velocity traverse to determine the average stack gas velocity and flow rate. Identify any cyclonic flow that might invalidate the sampling location.
Isokinetic Sample Collection
Insert the sampling nozzle at each traverse point, adjusting the sampling flow rate to match the local velocity. Collect particulate and gaseous samples simultaneously.
Post-Test Gravimetric Analysis
Transport filters and impingers to the laboratory in sealed containers. Weigh filters after equilibration in a desiccator. Calculate PM concentration and mass emission rate.
Data Validation and Reporting
Validate isokinetic variation, check for leaks, and review all QA/QC criteria. Generate a comprehensive report using iFactory's automated reporting engine, which formats data for agency submission.
Ready to Streamline Your Stack Testing Workflow?
iFactory's AI-driven platform automates data collection, validation, and reporting, reducing manual effort by 60%.
Key EPA Methods for Cement Plant Stack Testing
| EPA Method | Parameter | Application in Cement Plants |
|---|---|---|
| Method 1 | Sampling Location | Determines proper traverse points for representative sampling |
| Method 2 | Velocity & Volumetric Flow | Measures stack gas velocity using Type S pitot tube |
| Method 3A | Gas Composition (O2, CO2) | Determines dry molecular weight for flow correction |
| Method 4 | Moisture Content | Condensation method for stack gas moisture |
| Method 5 | Particulate Matter (PM) | Isokinetic sampling for total PM concentration |
| Method 7E | NOx | Chemiluminescence for nitrogen oxides |
| Method 6C | SO2 | NDIR or fluorescence for sulfur dioxide |
| Method 10 | CO | NDIR for carbon monoxide |
| Method 9 | Visible Opacity | Visual determination of plume opacity by certified observer |
Common Stack Testing Challenges
- High moisture content causing filter plugging and condensation in sample lines
- Cyclonic or swirling flow patterns that violate Method 1 assumptions
- Rapidly changing process conditions during testing (e.g., kiln upsets)
- Cross-sensitivity between gaseous pollutants in analyzers
- Inadequate access ports or platforms for safe equipment setup
iFactory's Solutions
- Heated sample lines with automatic moisture traps and purge cycles
- 3D CFD-based flow modeling to identify optimal sampling locations
- Real-time process data integration to trigger holds during unstable periods
- Advanced multivariate calibration algorithms for gas analyzers
- Custom-designed stack access solutions with safety interlocks
Frequently Asked Questions About Stack Testing
What is isokinetic sampling and why is it critical for cement stack testing?
Isokinetic sampling is a technique where the velocity of gas entering the sampling nozzle is exactly equal to the velocity of the stack gas at that point. This condition is critical because any mismatch in velocity will cause either oversampling (if nozzle velocity is lower) or undersampling (if nozzle velocity is higher) of particulate matter, leading to biased concentration results. In cement plants, where PM emissions can be highly variable due to raw material changes and kiln conditions, maintaining isokinetic conditions within 10% of the true stack velocity is essential for obtaining representative samples that are defensible to regulators. Our platform integrates with automated isokinetic controllers that adjust flow rates in real time, reducing technician workload and improving data quality. For more details, visit our support page.
How often should cement plants conduct stack emission testing?
The frequency of stack testing is dictated by your facility's Title V permit and the applicable EPA standards (e.g., NSPS Subpart F for cement plants). Typically, initial compliance testing is required within 180 days of startup, followed by annual or semi-annual tests depending on the pollutant and the permit conditions. Continuous emission monitoring systems (CEMS) may be required for certain pollutants, but periodic manual stack tests remain mandatory for validating CEMS accuracy and for measuring pollutants not covered by CEMS. iFactory's compliance calendar automatically tracks testing deadlines and sends reminders to your environmental team, ensuring you never miss a required test. You can schedule a consultation via our booking page to review your specific permit requirements.
What are the most common errors in stack testing and how can they be avoided?
Common errors include: (1) Leaks in the sampling train, which dilute the sample with ambient air; (2) Improper nozzle positioning, especially in stacks with stratified flow; (3) Inadequate probe heating leading to condensation of moisture and volatile compounds; (4) Incorrect calculation of isokinetic variation due to faulty velocity measurements; and (5) Contamination of filters during handling or transport. These errors can be minimized by following a stringent QA/QC protocol that includes pre-test leak checks, calibration of all instruments against NIST-traceable standards, and use of a digital data acquisition system that enforces procedural steps. iFactory's mobile app provides step-by-step guidance and real-time validation, flagging potential issues before they compromise your test. Learn more about our QA/QC features on our support portal.
How do I choose between extractive and in-situ gas analyzers for cement stack testing?
Extractive analyzers draw a sample from the stack through a heated line and condition it before analysis, allowing for measurement of multiple gases with high accuracy and the ability to use reference methods for calibration. However, they require more maintenance and are susceptible to sample line losses for reactive gases like NO2. In-situ analyzers measure directly inside the stack, offering faster response times and lower maintenance, but they are typically limited to single-gas measurement and may be affected by stack vibrations and temperature gradients. For cement plants, a hybrid approach is often best: use extractive systems for comprehensive compliance testing and in-situ sensors for real-time process control. iFactory's platform can integrate data from both types, providing a unified view. Contact us via our demo booking link to discuss the optimal configuration for your plant.
What is the role of moisture correction in stack emission reporting?
Moisture in stack gas dilutes pollutant concentrations, so reporting results on a dry basis (i.e., removing the effect of water vapor) is required by most regulations to allow comparison across different processes and conditions. The moisture content is measured using EPA Method 4, which typically involves passing a known volume of stack gas through a series of impingers maintained at ice bath temperature to condense water vapor. The volume of condensate is measured and converted to a moisture fraction. All pollutant concentrations are then corrected by dividing by (1 - moisture fraction). Failure to apply this correction can result in reported concentrations that are artificially low by 5-15%, potentially leading to non-compliance if the actual dry-basis emission rate exceeds the limit. iFactory's data processing pipeline automatically applies moisture correction using real-time or manual moisture data. For more information, visit our support documentation.
Take Control of Your Emission Compliance Today
iFactory provides end-to-end stack testing management, from automated data collection to regulatory report generation. Reduce non-compliance risk and operational costs.