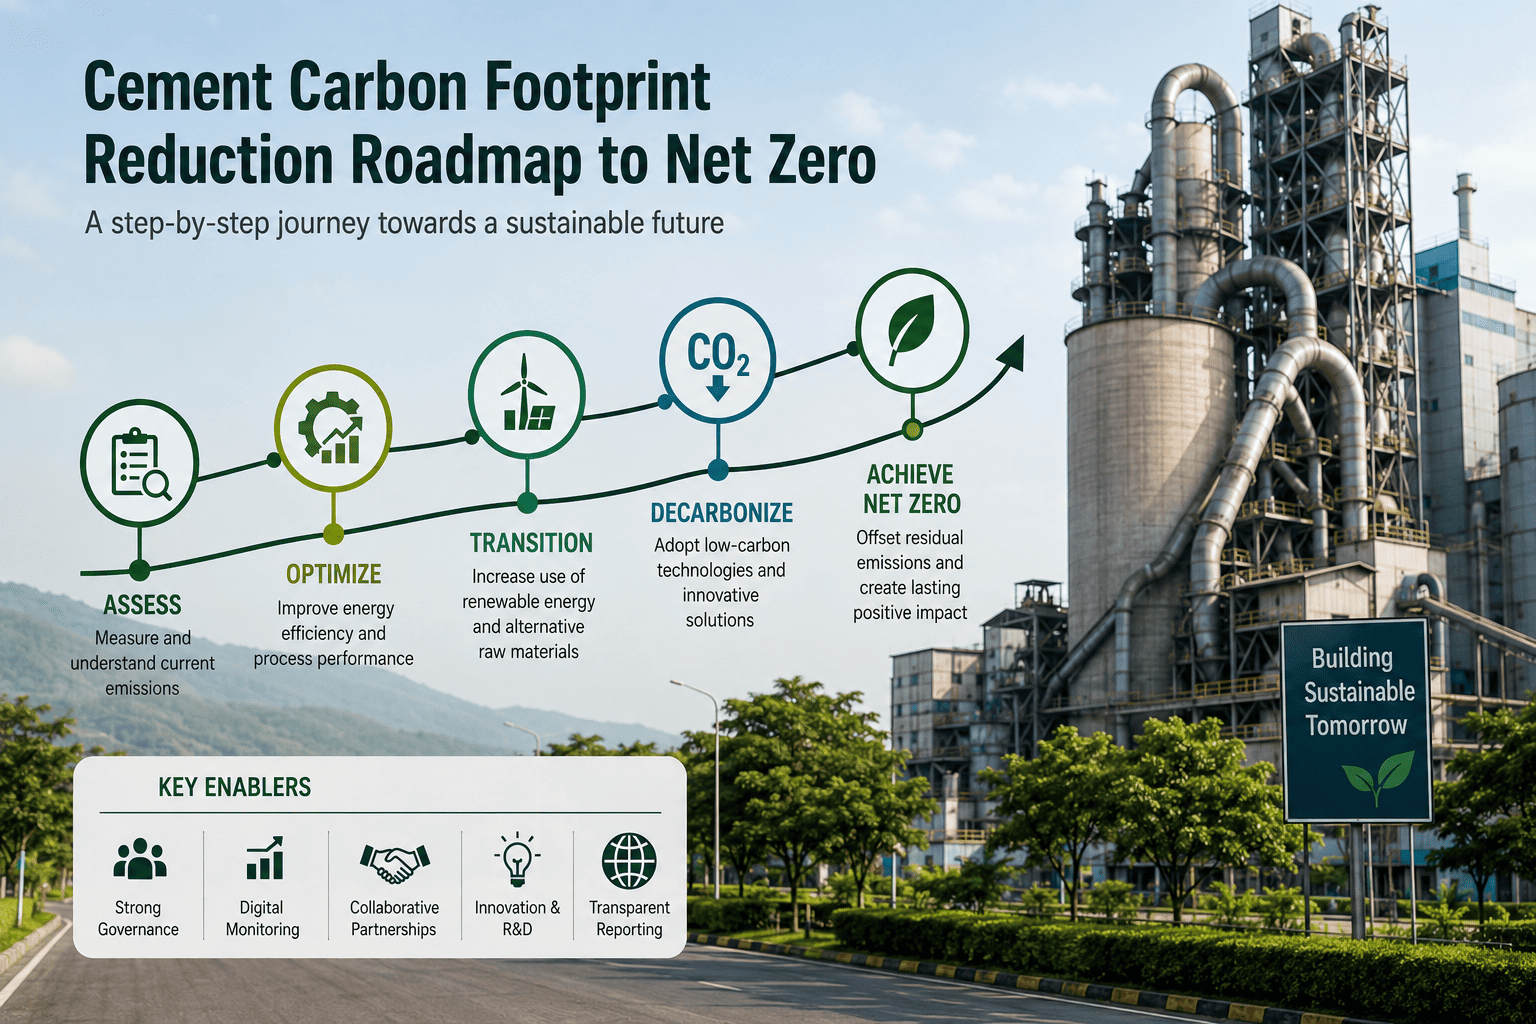
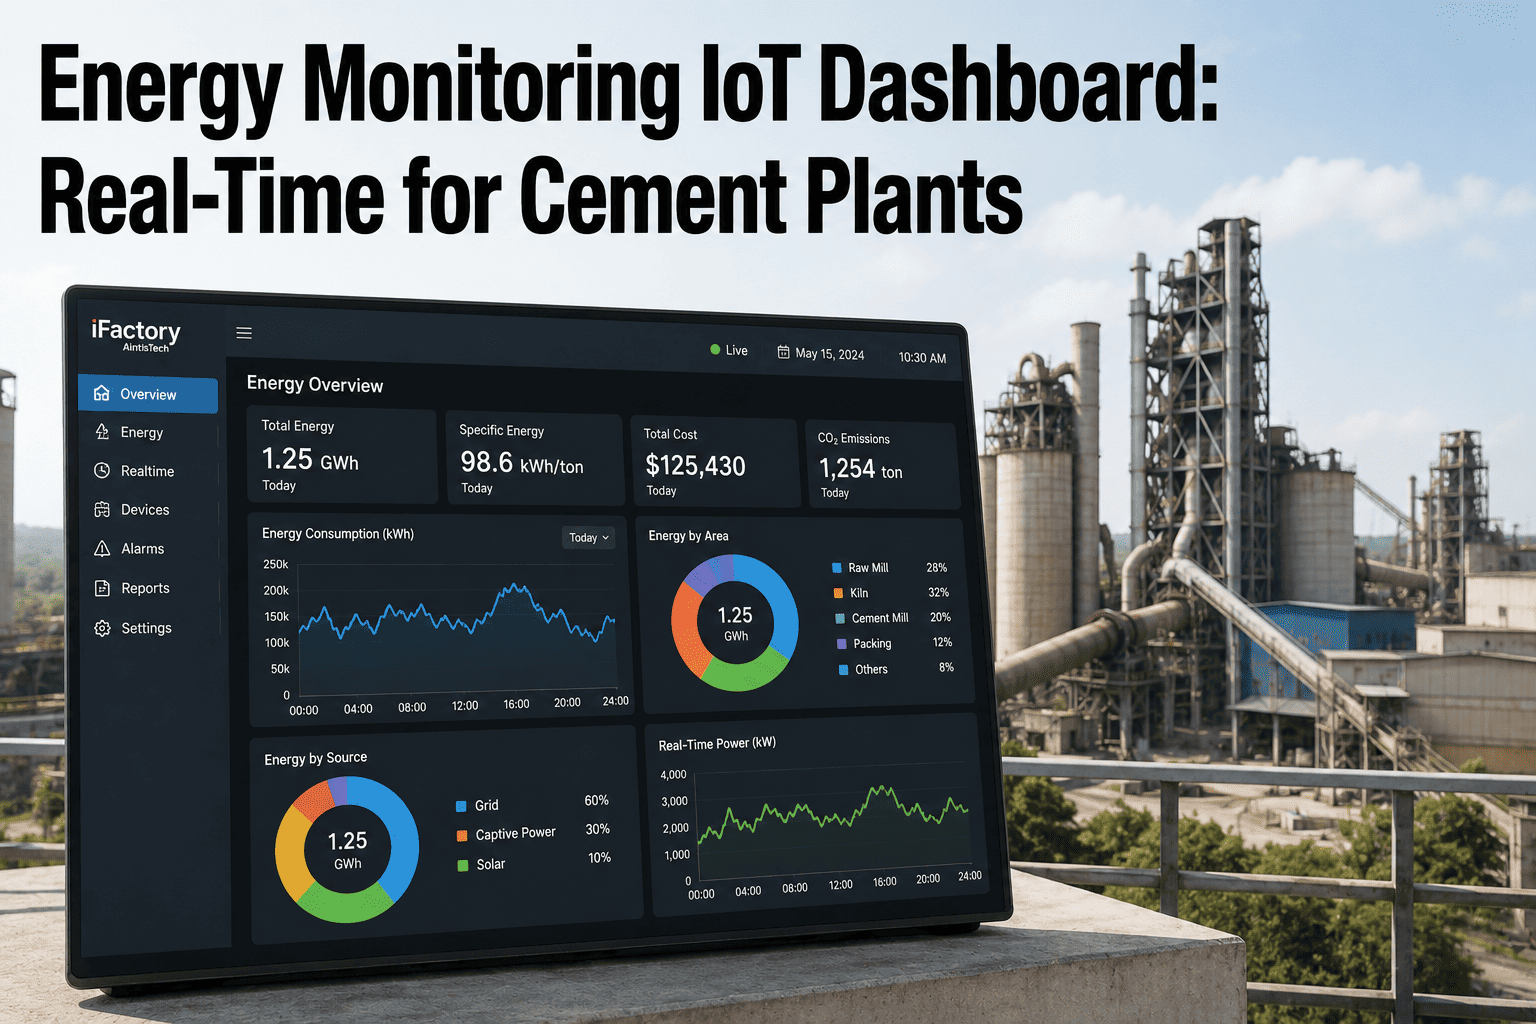
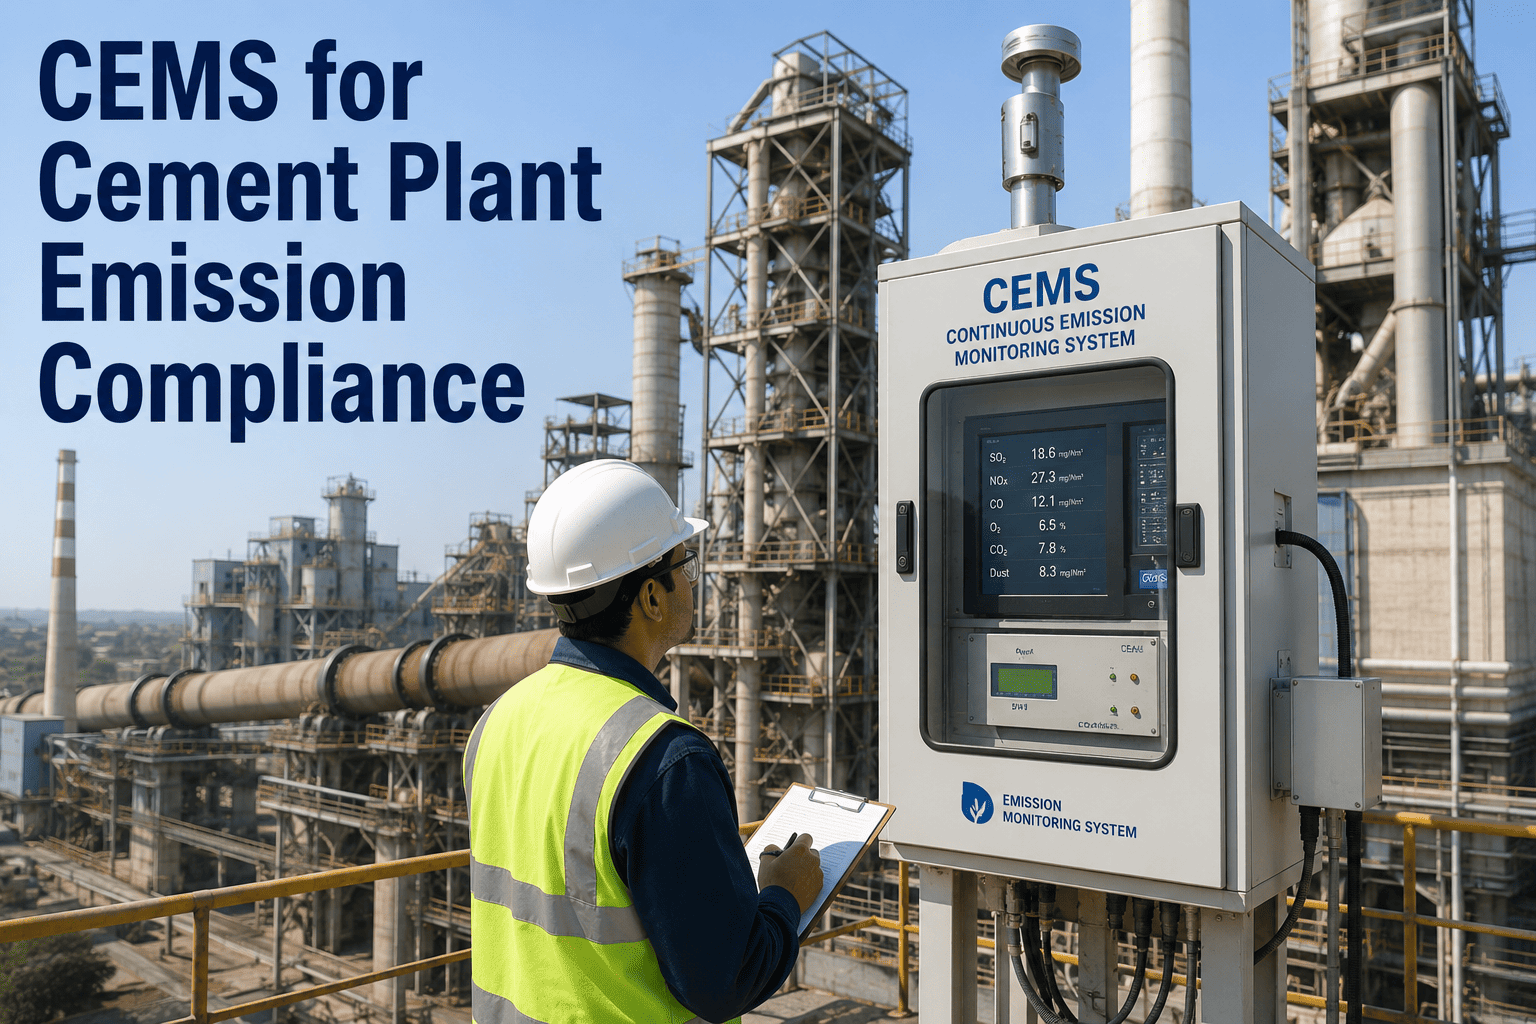
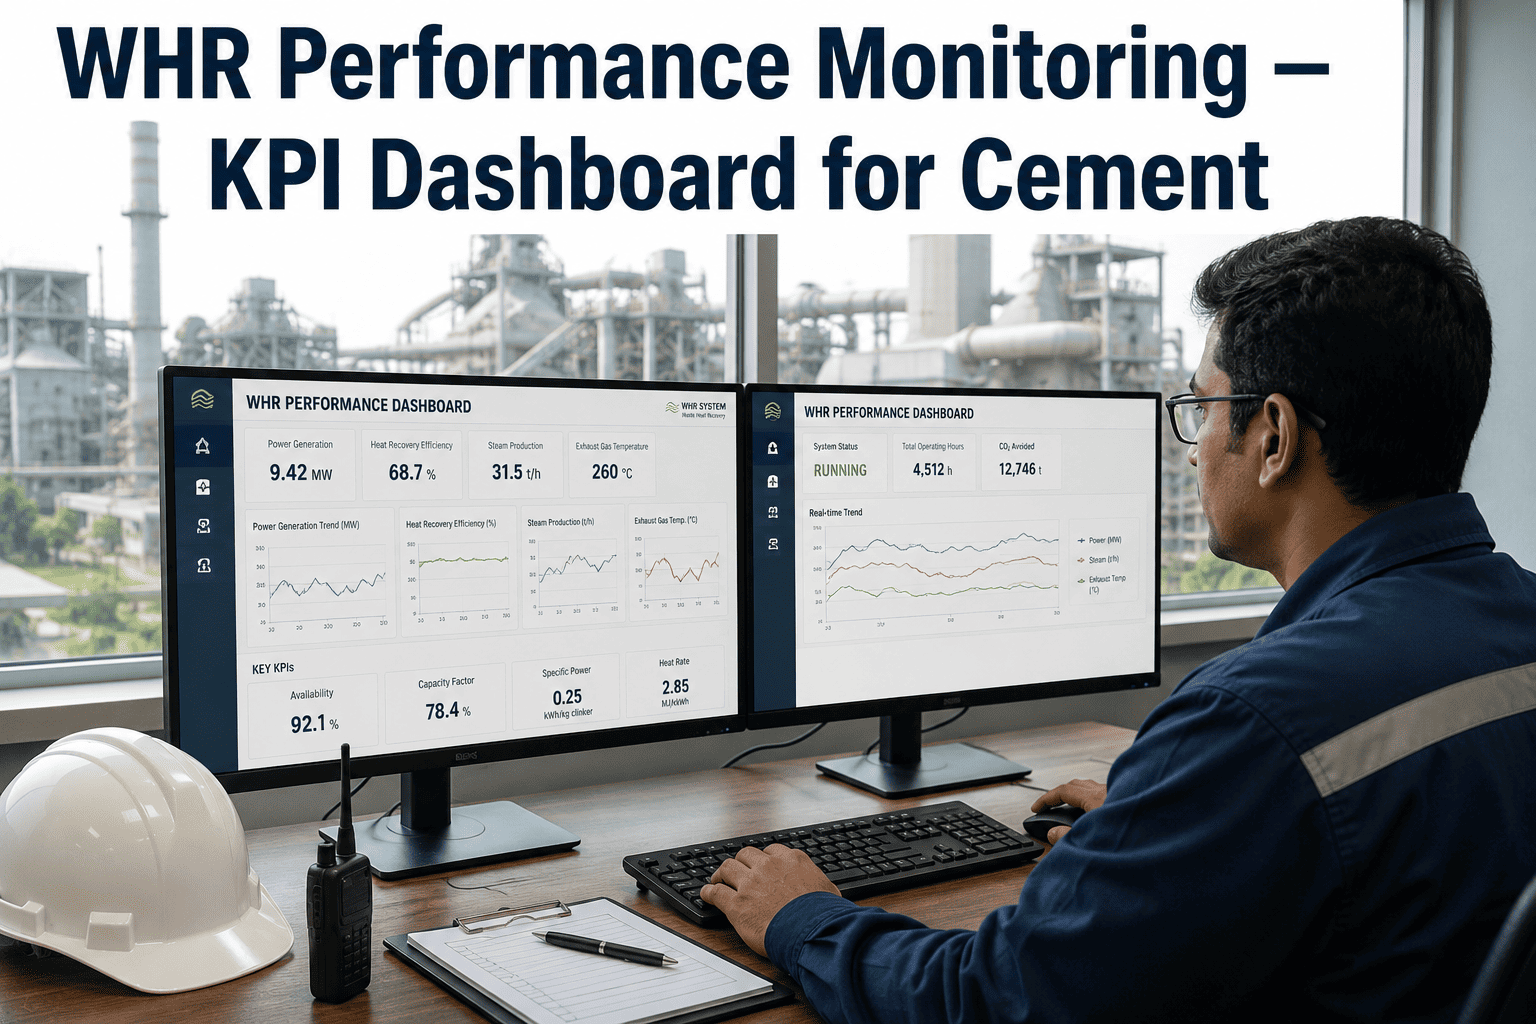
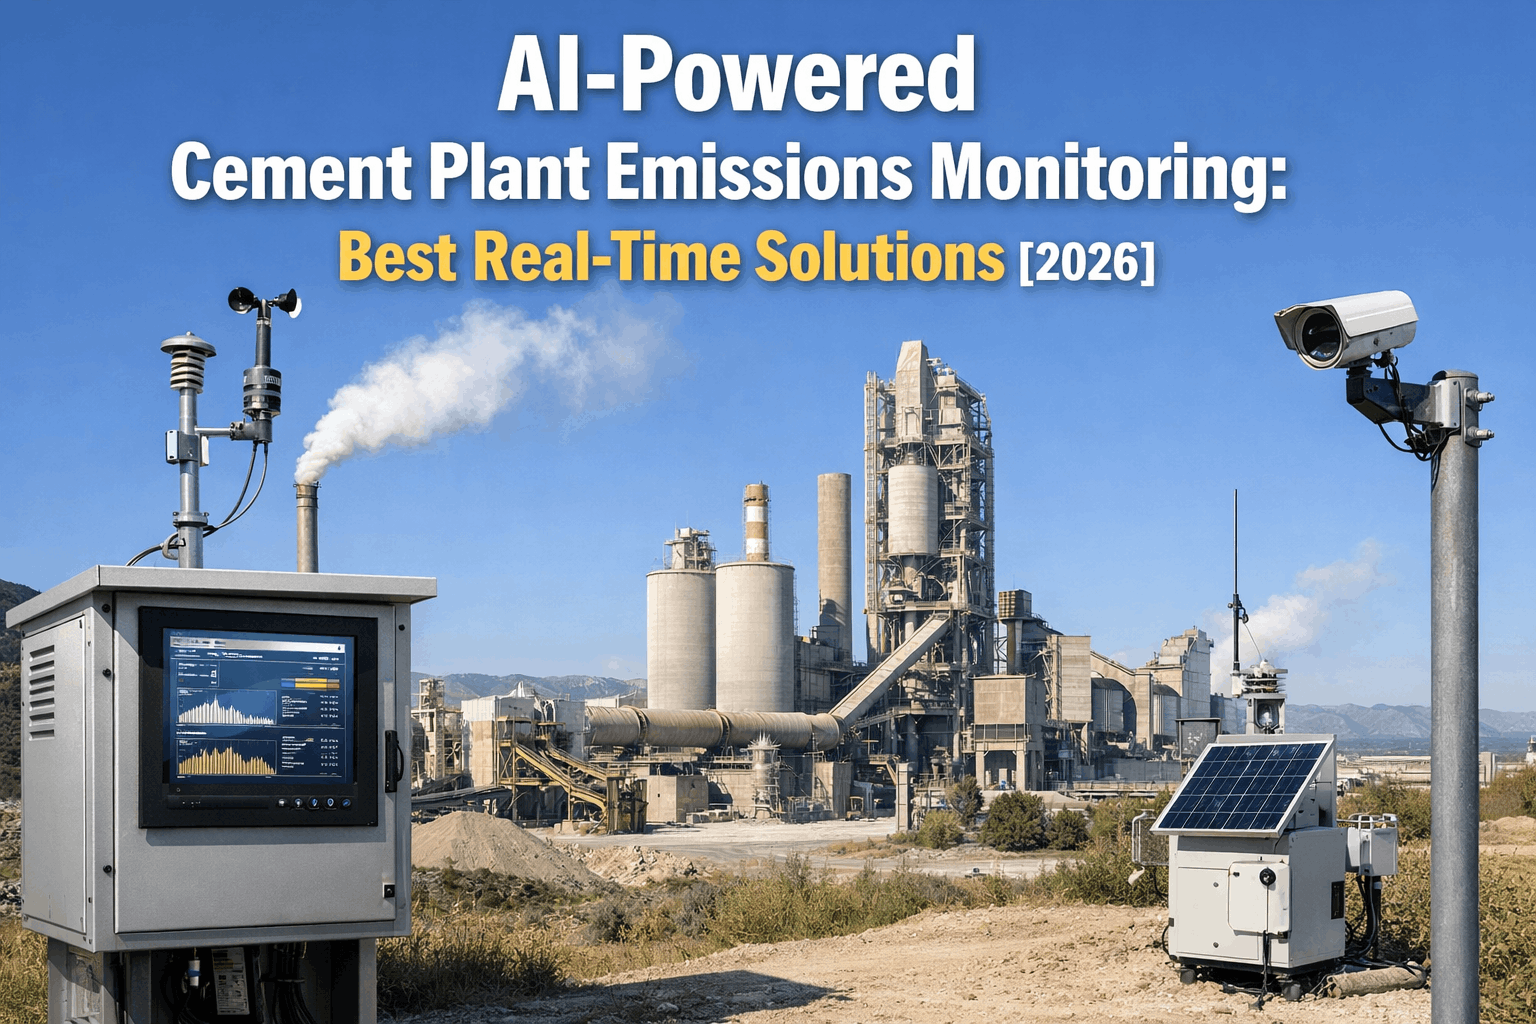
For the global cement industry, decarbonization is no longer a corporate social responsibility initiative—it is a core operational requirement driven by carbon taxes, CBAM mandates, and investor ESG scrutiny. Digital twin technology for cement manufacturing is fundamentally rewriting how plants model, monitor, and optimize their carbon footprint. By creating a live virtual replica of the chemical calcination process, kiln combustion, and electricity consumption, a digital twin analytics platform allows operations teams to calculate real-time CO2 intensity per tonne of clinker with unprecedented precision. For cement producers under pressure from rising carbon prices and tightening regulatory thresholds, adopting AI-driven emission tracking is the operational foundation that separates market leaders from those facing stranded asset risks. This guide explores how real-time emission dashboards, clinker factor optimization, and automated sustainability reporting combine to deliver measurable environmental intelligence across every layer of cement production. Book a demo to see these carbon benchmarks in action.
See Your Plant's Carbon Footprint in Real-Time
iFactory's emissions tracking platform delivers live CO2 per tonne analytics, alternative fuel optimization, and automated ESG reporting built for the cement industry.
Why Real-Time Carbon Tracking is the New OEE for Cement Plants
At the core of digital carbon tracking is the convergence of CEMS (Continuous Emission Monitoring Systems) data, fuel chemistry analysis, and physics-based kiln models. When a kiln's digital twin detects a 1% shift in alternative fuel moisture, it doesn't just log a thermal deviation—it simulates the downstream effect on calcination efficiency and correlates the pattern against real-time CO2 emission rates to recalculate the carbon intensity per tonne of clinker. This is the difference between retroactive annual reporting and genuine operational carbon intelligence. Manufacturers who book a demo with iFactory consistently report that the ability to link carbon intensity directly to shift-level operational decisions is the moment their sustainability strategy becomes actionable.
Real-Time Scope 1 & 2 Tracking
Track direct emissions from calcination and combustion (Scope 1) and indirect emissions from purchased electricity (Scope 2) in one unified dashboard. State changes in the kiln or grinders propagate to the carbon model within milliseconds.
Clinker Factor Optimization
Physics-informed models simulate the carbon reduction potential of increasing mineral components (limestone, slag, fly ash). Optimize your cement-to-clinker ratio without compromising structural strength or performance.
Alternative Fuel (AF) Analytics
Model the carbon impact of varying substitution rates for waste-derived fuels. Balance thermal substitution rate (TSR) with kiln stability to maximize carbon credits while maintaining production throughput.
CBAM & ESG Audit Automation
Automatically generate time-stamped, verified emission reports for CBAM compliance and corporate ESG disclosures. Reduce audit preparation time from weeks to minutes with a persistent digital evidence locker.
Carbon-Twin APM: How Real-Time Data Eliminates Greenwashing Risks
Digital twin platforms resolve the gap between "estimated" and "actual" emissions by monitoring the kiln at the molecular level. Thermal profiles from the burning zone, chemical signatures from the raw meal, and energy gradients across the grinding mills are analyzed continuously against carbon intensity curves. When a process deviation occurs—even one that wouldn't trigger a production alarm—the platform quantifies the incremental carbon cost in kilograms of CO2 per tonne. Plants that have deployed this approach with iFactory report that booking a demo led to the discovery that 15–20% of their carbon footprint was driven by invisible process inefficiencies that were easily corrected once visualized.
Digital Transformation in Cement: A Framework for Net-Zero Readiness
The financial impact of carbon tracking compounds as global carbon markets mature. A cement plant operating without real-time intensity data is effectively "flying blind" in a market where carbon is the most volatile input cost. The platform identifies specific causal chains: clinker factor drift, inefficient preheater performance, or excessive fan energy use. It quantifies the carbon gap in real kilograms per tonne and dollars per shift. This level of granularity is what sustainability leads need to justify CCUS (Carbon Capture) investments or alternative fuel infrastructure, and it is why operations directors routinely request a demo before finalizing their 2030 Net-Zero roadmaps.
| Emission Capability | Traditional Approach | Digital Twin Approach | Financial/ESG Impact |
|---|---|---|---|
| Scope 1 Tracking | Annual mass-balance estimates | Continuous CEMS-linked live monitoring | +15–20% reporting precision |
| Alternative Fuel Mix | Static feed-rate control | Dynamic TSR optimization vs. stability | 12–18% fuel cost reduction |
| Clinker-to-Cement Ratio | Batch sampling & manual adjust | Real-time strength-prediction modelling | –10% CO2 intensity per tonne |
| Audit Compliance | Manual spreadsheet reconciliation | Persistent digital audit trail | Audit prep time cut by 80% |
| CCUS Readiness | Post-hoc gas analysis | Predictive flue-gas concentration modelling | Accelerated ROI on carbon capture |
— Chief Sustainability Officer, Global Cement Group
The Three Phases to a Carbon-Smart Cement Plant
Deploying a carbon-focused digital twin analytics platform follows a structured three-phase architecture that balances the urgency of ESG compliance with the operational stability of a 24/7 kiln operation.
Emission Baseline & CEMS Integration
Connect existing CEMS hardware, energy meters, and fuel analysis feeds into a unified data historian. Establish a validated emission baseline for all production states. Timeline: 8–12 weeks.
Digital Twin Model Calibration & TSR Optimization
Commission the kiln's digital twin using physics-based models. Activate AI-driven Alternative Fuel (AF) optimization and Clinker Factor modelling to start capturing intensity reductions. Timeline: 6–10 weeks.
Closed-Loop Decarbonization & ESG Automation
Integrate carbon metrics with ERP and ESG reporting modules. Enable autonomous parameter corrections for kiln stability and clinker factor governance. Timeline: Ongoing.
Carbon Performance Gains Across Key Cement KPIs
The gains from deploying a carbon-smart digital twin span every dimension—from energy efficiency to regulatory readiness. The chart below benchmarks the average improvement cement plants achieve within 12 months of full deployment, based on iFactory data across clinker, grinding, and blending operations.
Carbon Tracking in Cement Plants — Frequently Asked Questions
How is real-time CO2 per tonne calculated without laboratory clinker analysis?
iFactory uses a "Soft Sensor" approach. We correlate real-time kiln feed chemistry, CEMS stack data, and fuel energy signatures with historical lab benchmarks. This allows for a continuously updated intensity model that is accurate to within 1% of lab-verified quarterly audits.
Can the platform track Scope 2 emissions from grinding and logistics?
Yes. By integrating with site energy meters and procurement logs, the platform calculates the real-time carbon intensity of every MWh consumed, adjusted for the time-of-use and grid carbon intensity, providing a complete Scope 1 & 2 profile.
Does the platform support CBAM (Carbon Border Adjustment Mechanism) reporting?
Absolutely. iFactory's reporting module is built to the specific technical standards required by European CBAM mandates, ensuring that exported cement has a verified, third-party auditable carbon intensity certificate.
How does the digital twin help with Alternative Fuel (AF) substitution?
High AF rates often destabilize the kiln. The digital twin simulates the thermal and chemical impact of AF changes 15–20 minutes before they occur, allowing operators to adjust secondary air or flame geometry to maintain stability while maximizing substitution.
What is "Clinker Factor Optimization" and how much CO2 can it save?
It is the process of reducing the percentage of clinker in finished cement by substituting mineral components like slag or calcined clay. Our AI models simulate the impact on cement strength and setting time, allowing plants to safely reduce their clinker factor by 10–20%—the single biggest lever for emission reduction.
Is the platform compatible with existing CEMS hardware?
Yes. iFactory is hardware-agnostic and integrates with all major Continuous Emission Monitoring Systems (e.g., ABB, Sick, Thermo Fisher) via standard industrial protocols like Modbus or OPC-UA.
How does digital carbon tracking prepare a plant for future CCUS (Carbon Capture)?
Successful carbon capture requires highly stable flue-gas concentrations and thermal profiles. By using a digital twin to stabilize kiln operations today, plants create the optimal operational environment for CCUS infrastructure investment tomorrow.
What is the typical time-to-value for a carbon-smart rollout?
Most plants achieve a "Carbon-Live" dashboard within 8 weeks and see their first measurable intensity reductions through clinker factor and AF optimization within the first 6 months.
Deploy a Carbon-Smart Cement Plant Today
iFactory's emissions tracking platform delivers real-time carbon intelligence, automated ESG compliance, and AI-driven kiln optimization — built for the future of sustainable cement.