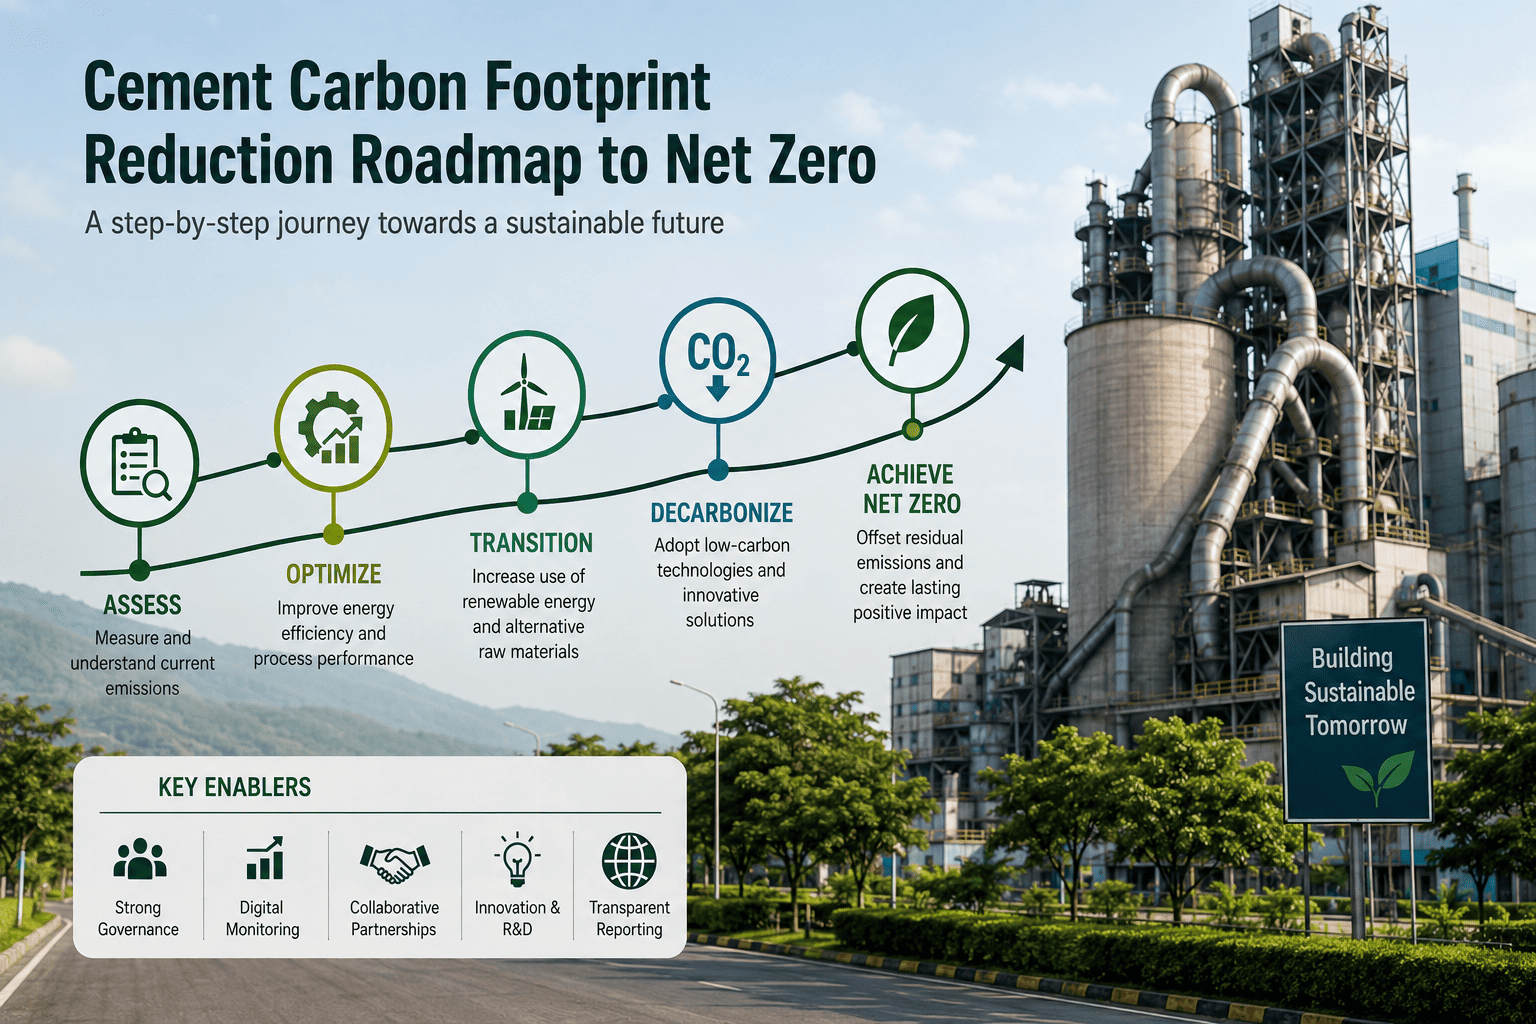
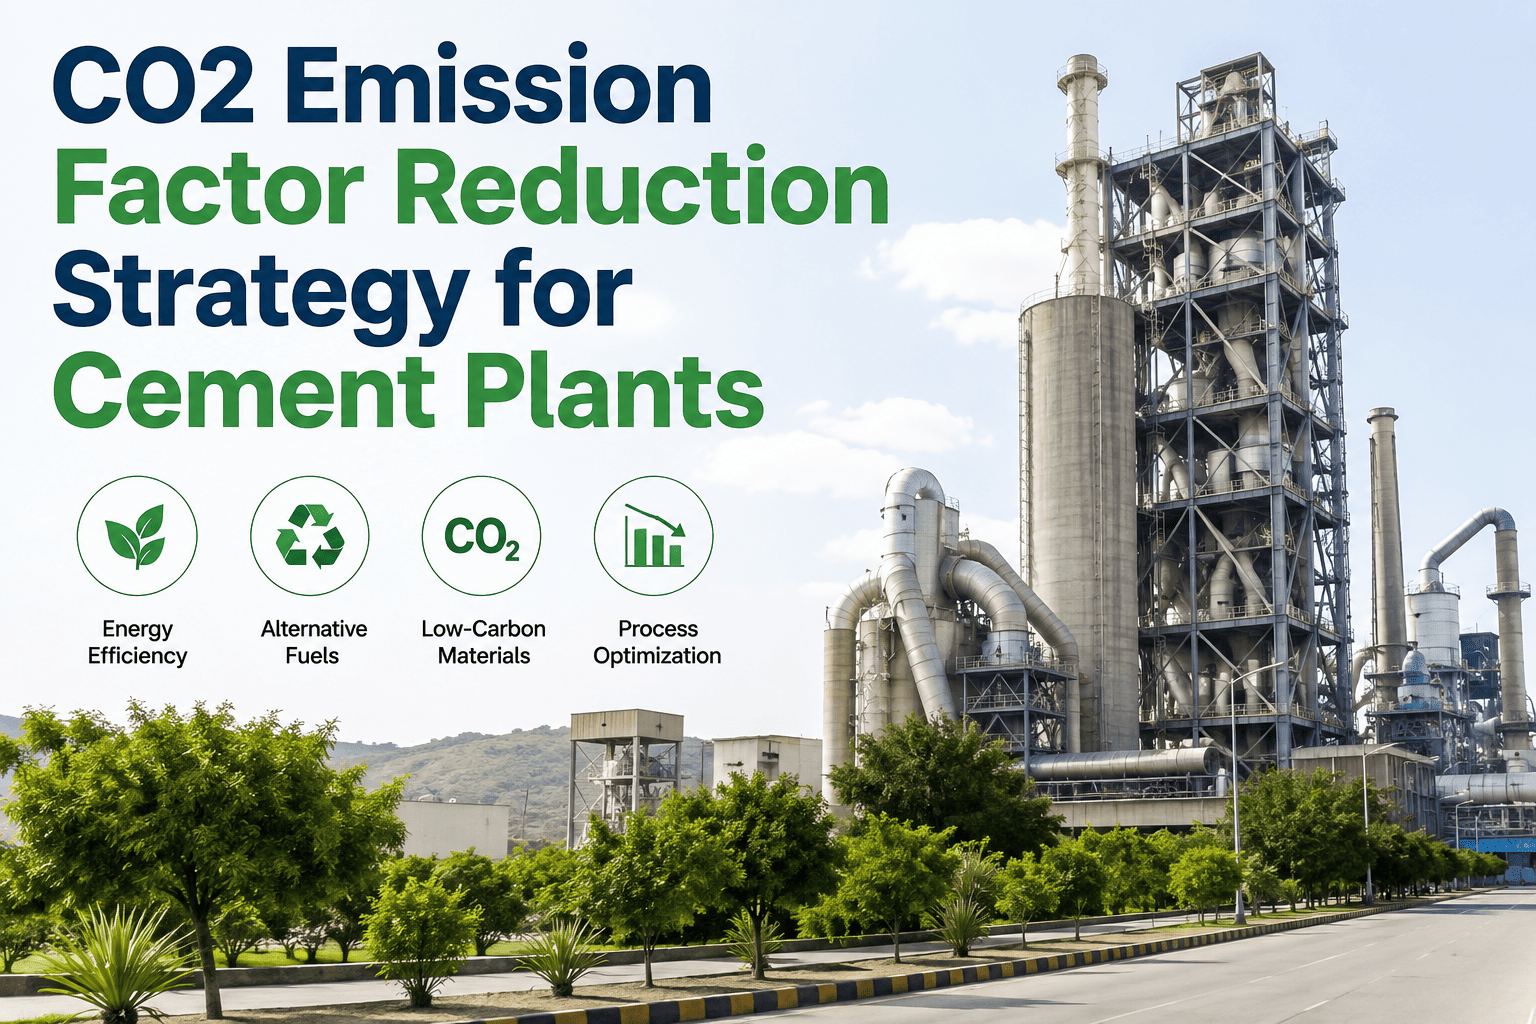
Cement plants chasing a net-zero target eventually run into the same uncomfortable math: business-as-usual would put the global sector on track to emit roughly 98 gigatons of CO2 between now and 2050, which is about double the carbon budget the industry can afford under a 1.5°C pathway. Closing that gap isn't a single project — it's a sequence, because the levers that cut emissions cheaply today (energy efficiency, alternative fuels) run out of headroom well before 2050, and the levers that finish the job (carbon capture, transformative kiln technology) aren't commercially ready yet at the cost or scale a typical plant needs. What separates plants with a credible roadmap from plants with a slide deck is knowing which lever to pull in which decade, and tracking progress against that sequence instead of chasing every initiative at once. If you want to see where your own plant sits against this sequence, a roadmap walkthrough takes less time than building the spreadsheet yourself.
CARBON & CCUS · CEMENT
The Cement Industry's Net-Zero Roadmap, Decoded Into Four Levers and Three Decades
Clinker factor reduction, alternative fuels, energy efficiency, and CCUS don't all activate at once — here's the sequence the IEA, GCCA, and RMI roadmaps agree on, and what it means for building your own plant's timeline.
6% → 43%
Global alternative fuel share, current versus projected by 2050 across roadmap scenarios
75%
Target clinker-to-cement ratio by 2050, down from today's typical blend, before counting SCM replacement
~30%
Share of remaining 2050 emissions that CCUS is expected to carry, after every other lever is exhausted
75–150%
Current production cost premium for early near-zero-emission cement using carbon capture, versus conventional output
01
The Sequencing Problem
Why Every Credible Roadmap Uses the Same Order of Operations
Roadmap models from the IEA, the Global Cement and Concrete Association, and the Mission Possible Partnership all converge on a similar shape, even though they disagree on exact percentages: efficiency and clinker-ratio levers do the heavy lifting before 2030, alternative fuels and material substitution carry the middle decade, and carbon capture only becomes dominant after 2040 once the cheaper levers are used up. This ordering isn't arbitrary — it reflects which technologies are commercially proven today versus which ones need another decade of cost curve and infrastructure to mature.
The practical consequence for a plant building its own roadmap is that spending scarce capital on carbon capture readiness before energy efficiency and fuel-switching projects are exhausted usually produces a worse return than sequencing it properly. Efficiency and fuel-switching projects typically pay back in three to seven years from fuel cost savings alone, while CCUS retrofit economics still depend heavily on policy support and captured-CO2 offtake markets that vary widely by region.
1
NOW – 2030
Efficiency & Fuel Switching
Kiln efficiency upgrades and alternative fuel ramp-up deliver the largest near-term reduction per dollar spent.
2
2030 – 2040
Clinker Substitution & Material Efficiency
Lower clinker ratios and blended cements decouple emissions from production growth at scale.
3
2040 – 2050
CCUS & Transformative Technology
Carbon capture, electrification, and novel chemistries close the final and hardest-to-abate gap.
02
Phase One
Now to 2030: The Levers Your Plant Can Pull This Year
This phase is where most plants already have the infrastructure and payback economics to move immediately, and where the biggest gap usually exists between what a roadmap slide promises and what's actually being tracked on the plant floor.
Kiln Thermal Efficiency Upgrades
Waste Heat Recovery Power Generation
Grid Electricity Decarbonization
Depends on regional grid mix
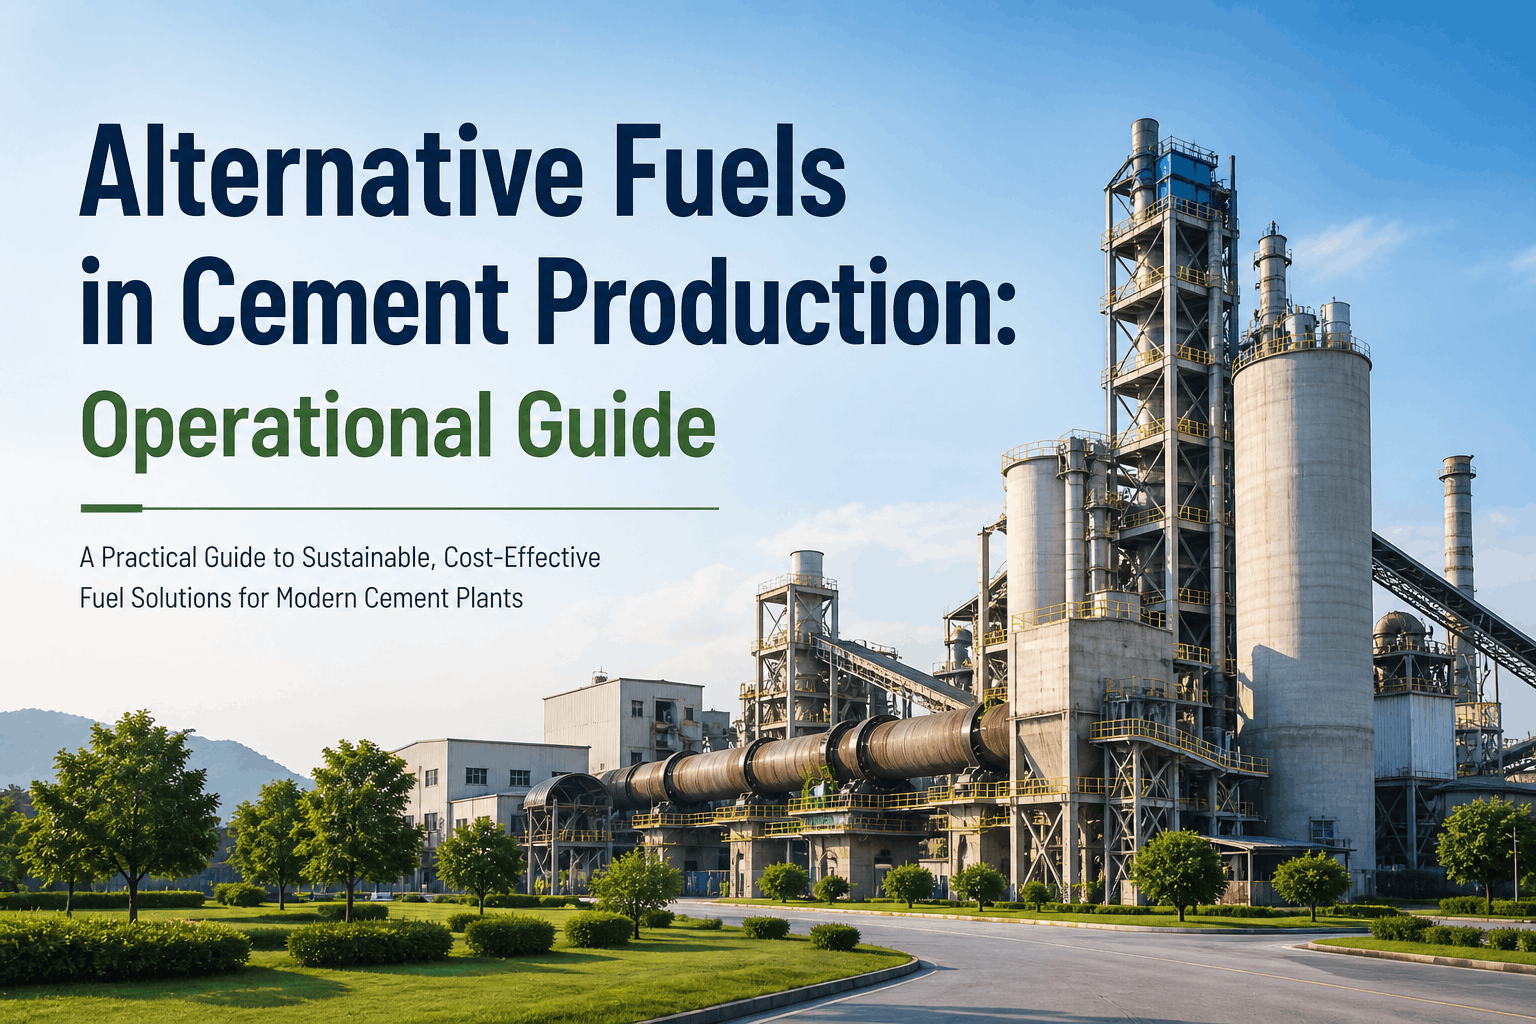
Alternative fuel adoption is the clearest example of a lever with room to run: global usage sits at roughly 6% today against a 2030 target near 22%, meaning most plants worldwide have barely begun this transition. Every percentage point of coal or petcoke displaced by refuse-derived fuel, biomass, or qualifying waste streams reduces both fuel cost and combustion-linked emissions simultaneously, which is exactly why roadmap models treat it as the second-highest-priority lever after raw efficiency gains.
TRACK YOUR PHASE-ONE PROGRESS
See Which Levers You've Actually Pulled — Not Just Planned
Most plants overestimate how far their alternative fuel and efficiency programs have actually progressed until the numbers are pulled from live kiln data instead of last year's sustainability report.
03
Phase Two
2030 to 2040: Rethinking What "Cement" Actually Contains
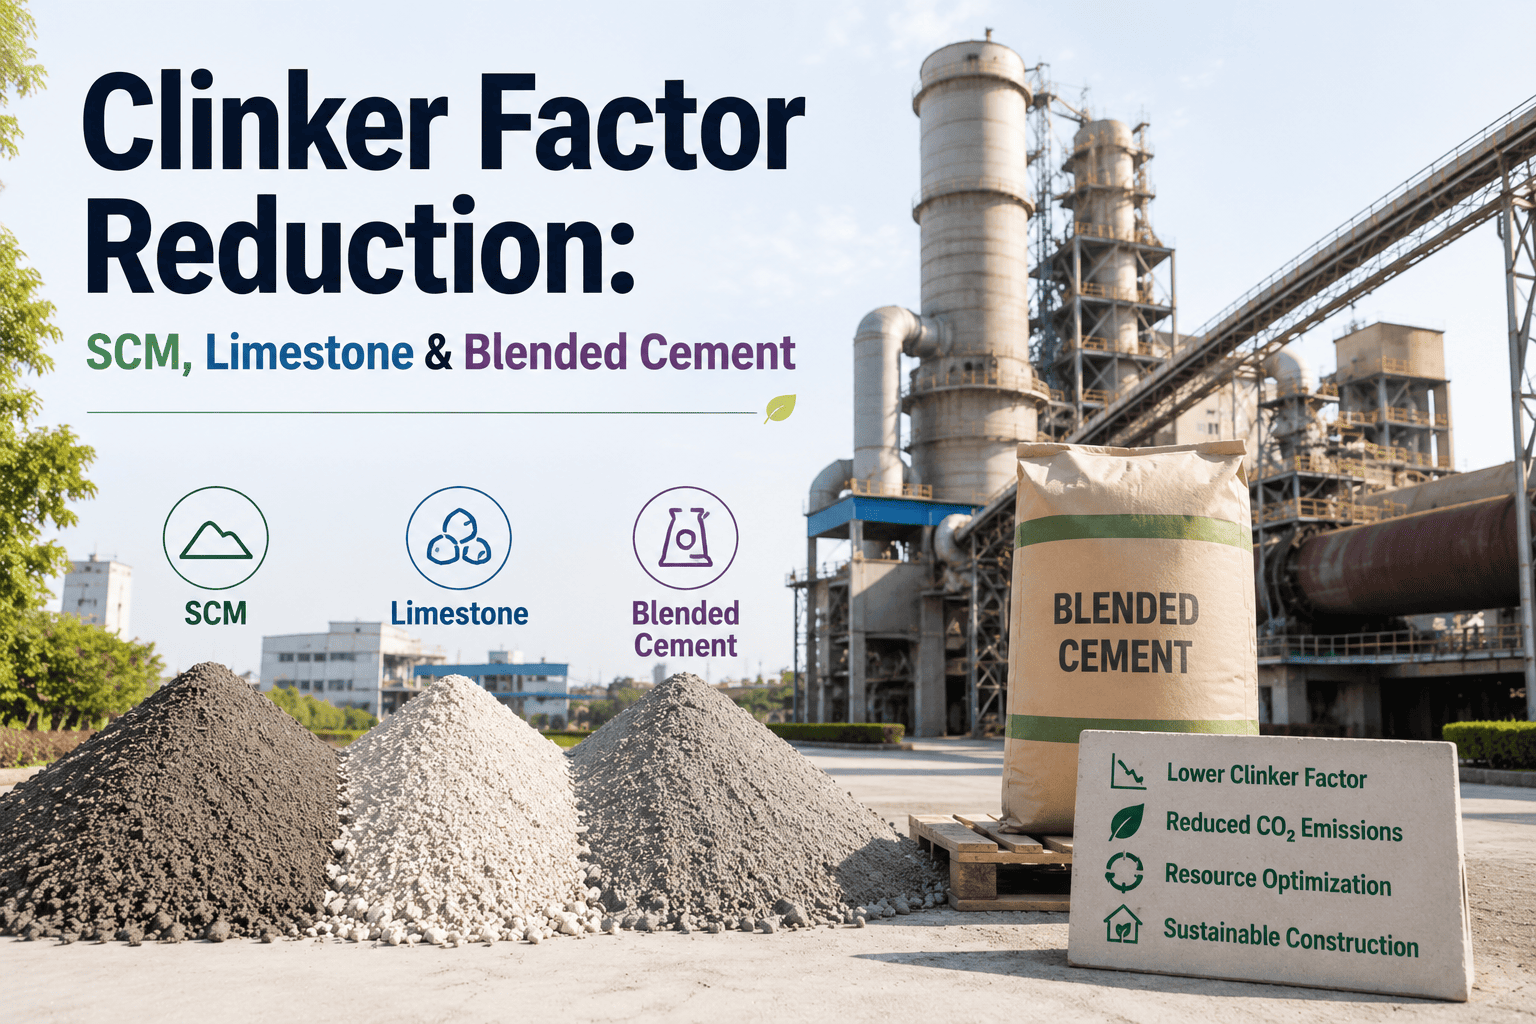
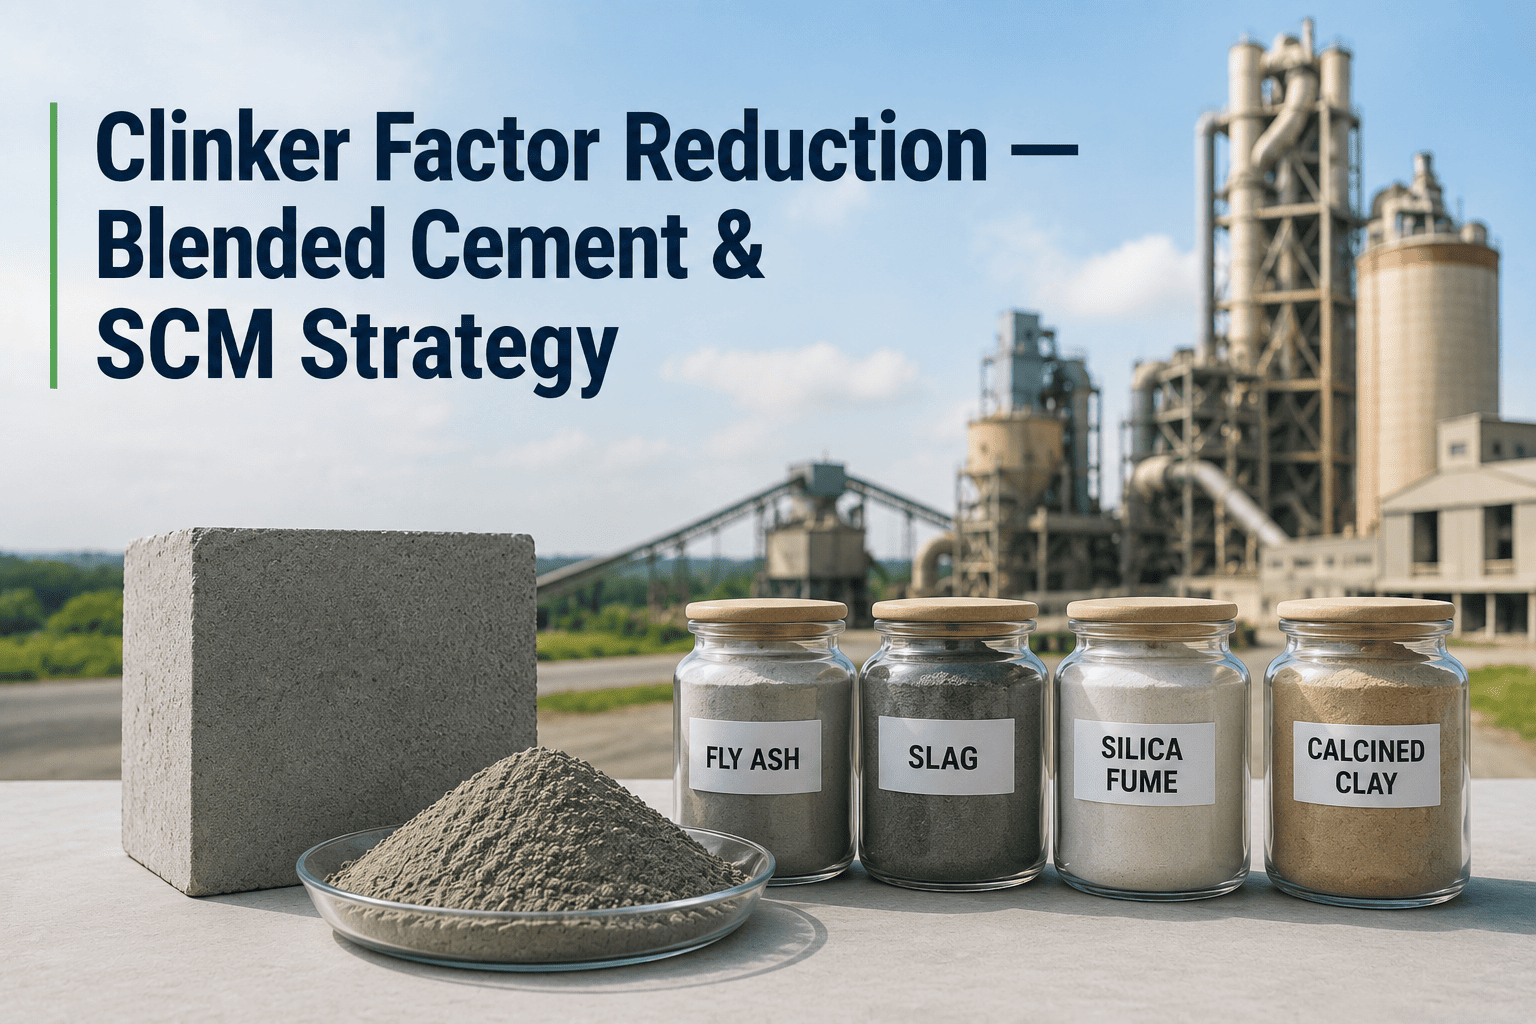
The middle decade of every net-zero roadmap is dominated by a single structural shift: reducing how much clinker sits inside every tonne of finished cement. Roadmap targets call for bringing the global clinker-to-cement ratio down to around 75% by 2050, not counting further reduction from supplementary cementitious materials layered on top — and because calcining limestone into clinker is responsible for close to half of the industry's process emissions, this lever attacks the hardest chemical constraint in the entire production process rather than just the energy going into it.
Portland Limestone Cement (Type IL)
Blended cements incorporating higher limestone content and lower clinker fractions are already commercially proven and increasingly accepted in building codes, offering a lower-carbon option without requiring new plant technology.
Fly Ash and Slag Substitution
Supplementary cementitious materials from coal power and steel production reduce clinker demand further, though availability varies by region as those source industries themselves decarbonize and shrink over time.
Material and Demand Efficiency
Reducing over-specification in concrete mix design and improving construction-site efficiency lowers total cement demand, which several roadmap models treat as reducing the annual CO2 that even needs to be captured later by up to 25%.
04
Phase Three
2040 to 2050: Where CCUS Carries the Final, Hardest Third
Even after full efficiency, fuel-switching, and clinker-ratio gains are captured, roadmap models still project a substantial residual emissions gap — this is the segment carbon capture, utilization, and storage is built to close, expected to handle roughly 30% of remaining sector emissions by 2050. The technology itself isn't new, but deploying it at cement-plant scale, cost, and reliability is still in early commercial stages.
| Production Pathway |
Relative Cost vs Conventional |
Commercial Maturity |
| Conventional Portland cement |
Baseline |
Fully mature |
| High alternative-fuel, low-clinker blend |
Comparable to slightly lower |
Commercially proven |
| Near-zero-emission cement with CCS |
75–150% higher |
Early commercial, ~35 Mt global capacity by 2030 |
| Transformative pathways (electrification, hydrogen, oxyfuel) |
Not yet commercially benchmarked |
Pilot and R&D stage |
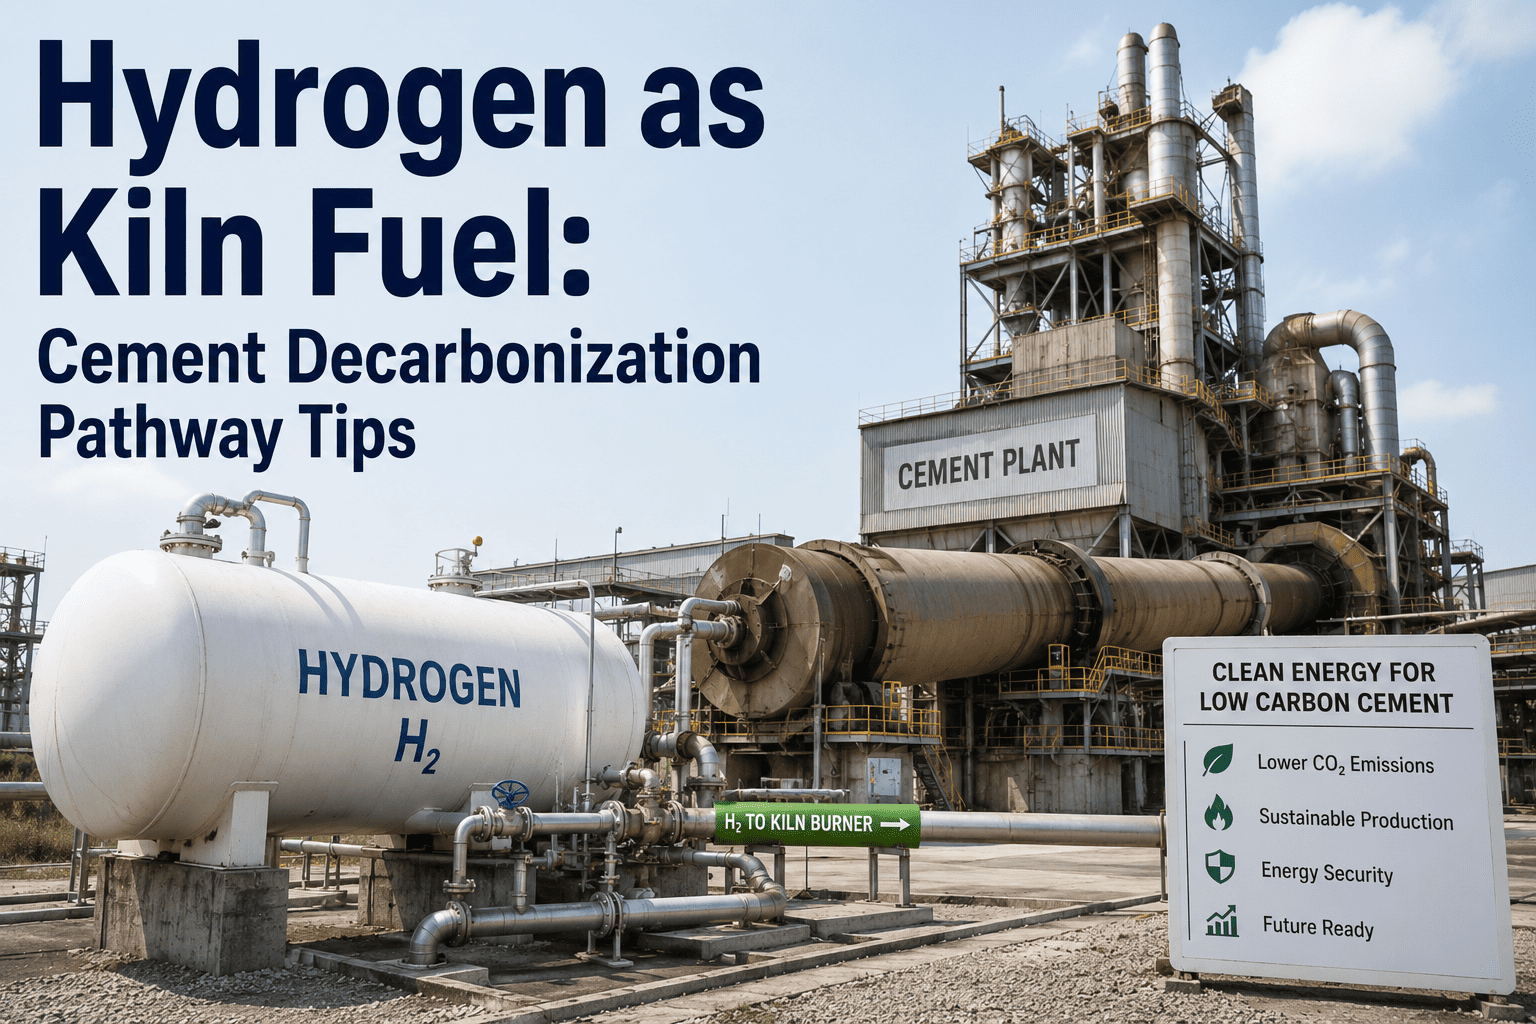
The cost premium for CCS-based near-zero cement is real today, but roadmap consensus is that combining it with material efficiency and SCM adoption lowers the overall cost of the transition, because less total CO2 needs to be captured in the first place. This is also why plants are advised to start digitizing flue-gas composition and thermal profile data now, well before capture infrastructure is installed — being "capture-ready" on the data side shortens the runway once the technology and policy support catch up.
05
Building Your Own Roadmap
Five Questions to Answer Before You Set a Net-Zero Target Year
A roadmap that exists only as a target percentage and a target year isn't a plan — it's a hope. Plants that convert the global sequence above into something they can actually execute against tend to answer these questions first.
1
Where does your plant's current clinker-to-cement ratio and alternative fuel share sit against the 2030 global benchmark, using your own metered data rather than an industry average?
2
Which efficiency upgrades — preheater staging, waste heat recovery, kiln refractory — still have unclaimed payback available before you allocate capital toward capture-readiness projects?
3
What alternative fuel and SCM supply actually exists within economic transport distance of your plant, rather than assuming national averages apply locally?
4
Is your flue-gas composition and thermal profile data being logged in a form that would support a CCUS feasibility study today, or would that be a multi-month data-collection exercise first?
5
Who reviews progress against the roadmap quarterly, and what happens when a lever underperforms its planned contribution for two quarters running?
Frequently Asked
Net-Zero Roadmap Questions Cement Plant Teams Ask First
Do we need to invest in carbon capture now, or can it wait until later in our roadmap?
For most plants, the near-term priority is exhausting efficiency, fuel-switching, and clinker-ratio levers first, since those typically pay back in three to seven years and require proven technology already available today. Carbon capture remains the right long-term answer for the residual emissions those levers can't reach, but committing capital to it before cheaper levers are saturated usually produces a worse return per tonne of CO2 avoided. What plants can and should do now is start digitizing flue-gas and thermal data so a future capture project isn't delayed by a data-collection gap — a
roadmap review can help map where your plant sits on that sequence.
How much can alternative fuels realistically reduce our emissions without a major capital project?
Global alternative fuel usage sits at roughly 6% today, with sector targets calling for around 22% by 2030 and over 40% by 2050, which means most plants have substantial room to grow their blend before hitting supply or kiln-stability constraints. Ramping refuse-derived fuel, biomass, or qualifying waste streams typically requires kiln feed system adjustments rather than a full rebuild, making it one of the fastest levers to move without a multi-year capital cycle. The ceiling depends heavily on local waste-fuel availability and permitting, which is worth mapping against your specific plant location.
What is the difference between clinker factor reduction and material efficiency, and do we need both?
Clinker factor reduction lowers the proportion of clinker inside each tonne of finished cement by blending in limestone, fly ash, or slag, which directly cuts the calcination emissions tied to that tonne. Material efficiency instead reduces the total tonnage of cement and concrete needed in the first place, through better mix design and less over-specification in construction. Roadmap models treat these as complementary rather than substitute levers — pursuing both together is what allows some scenarios to cut the total CO2 that even needs to be captured later by up to a quarter.
Why does the cost premium for near-zero-emission cement stay so high, and when is it expected to fall?
Early commercial carbon capture facilities carry costs 75% to 150% above conventional cement production today, driven by capital intensity, energy demand for capture and compression, and limited economies of scale since global near-zero capacity is still only around 35 million tonnes as of 2030 projections. That premium is expected to decline as more capture projects reach final investment decision and policy mechanisms like carbon pricing or offtake guarantees mature, similar to the cost curve seen in early-stage renewable power. Pairing capture with material efficiency and SCM adoption is the approach most roadmaps recommend to soften the transition cost in the meantime.
How do we know if our plant's roadmap is actually on track versus just aspirational?
A roadmap is only as credible as the data tracking it — if clinker ratio, alternative fuel share, and thermal energy intensity are pulled from live plant metering rather than annual sustainability report estimates, deviations show up in weeks instead of a year later at audit time. The most common failure mode is a plant setting a 2030 or 2050 target percentage without a quarterly checkpoint tied to actual kiln data, which means underperformance on one lever goes unnoticed until it's too late to correct within that phase. Reviewing your current tracking setup through
support is a practical way to close that gap before it compounds.
FOUR LEVERS · THREE DECADES · ONE PLATFORM
Turn the Global Roadmap Into Your Plant's Own Numbers
iFactory tracks clinker ratio, alternative fuel share, thermal efficiency, and capture-readiness data from the same digital twin — so your roadmap is measured against your own kiln, not an industry average.