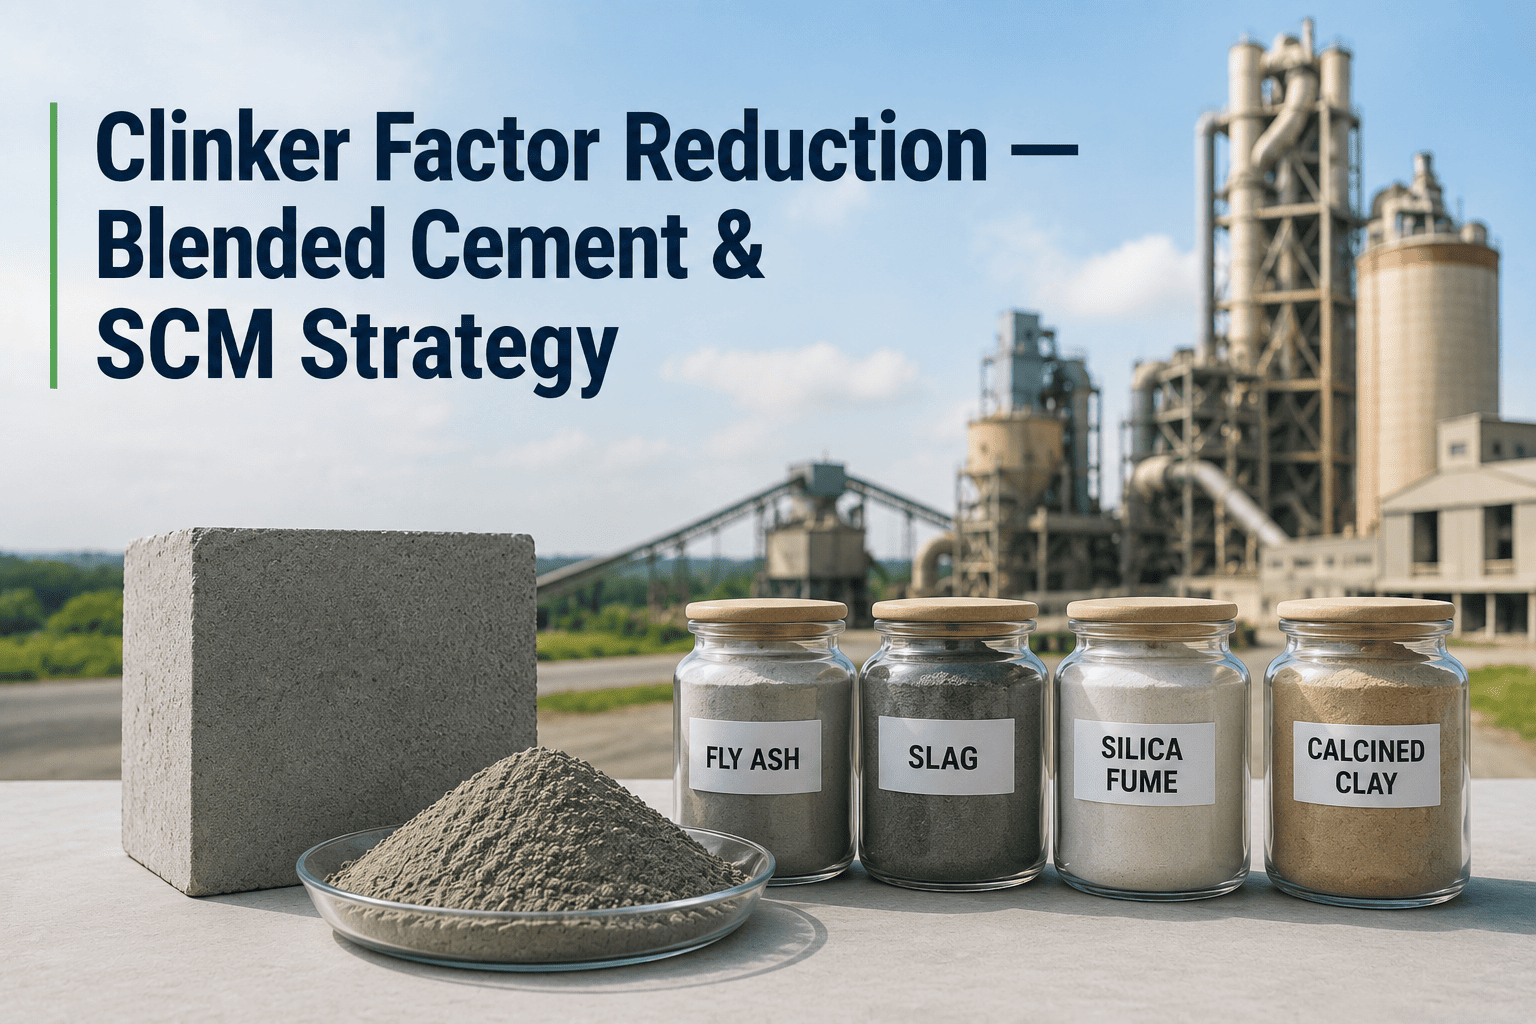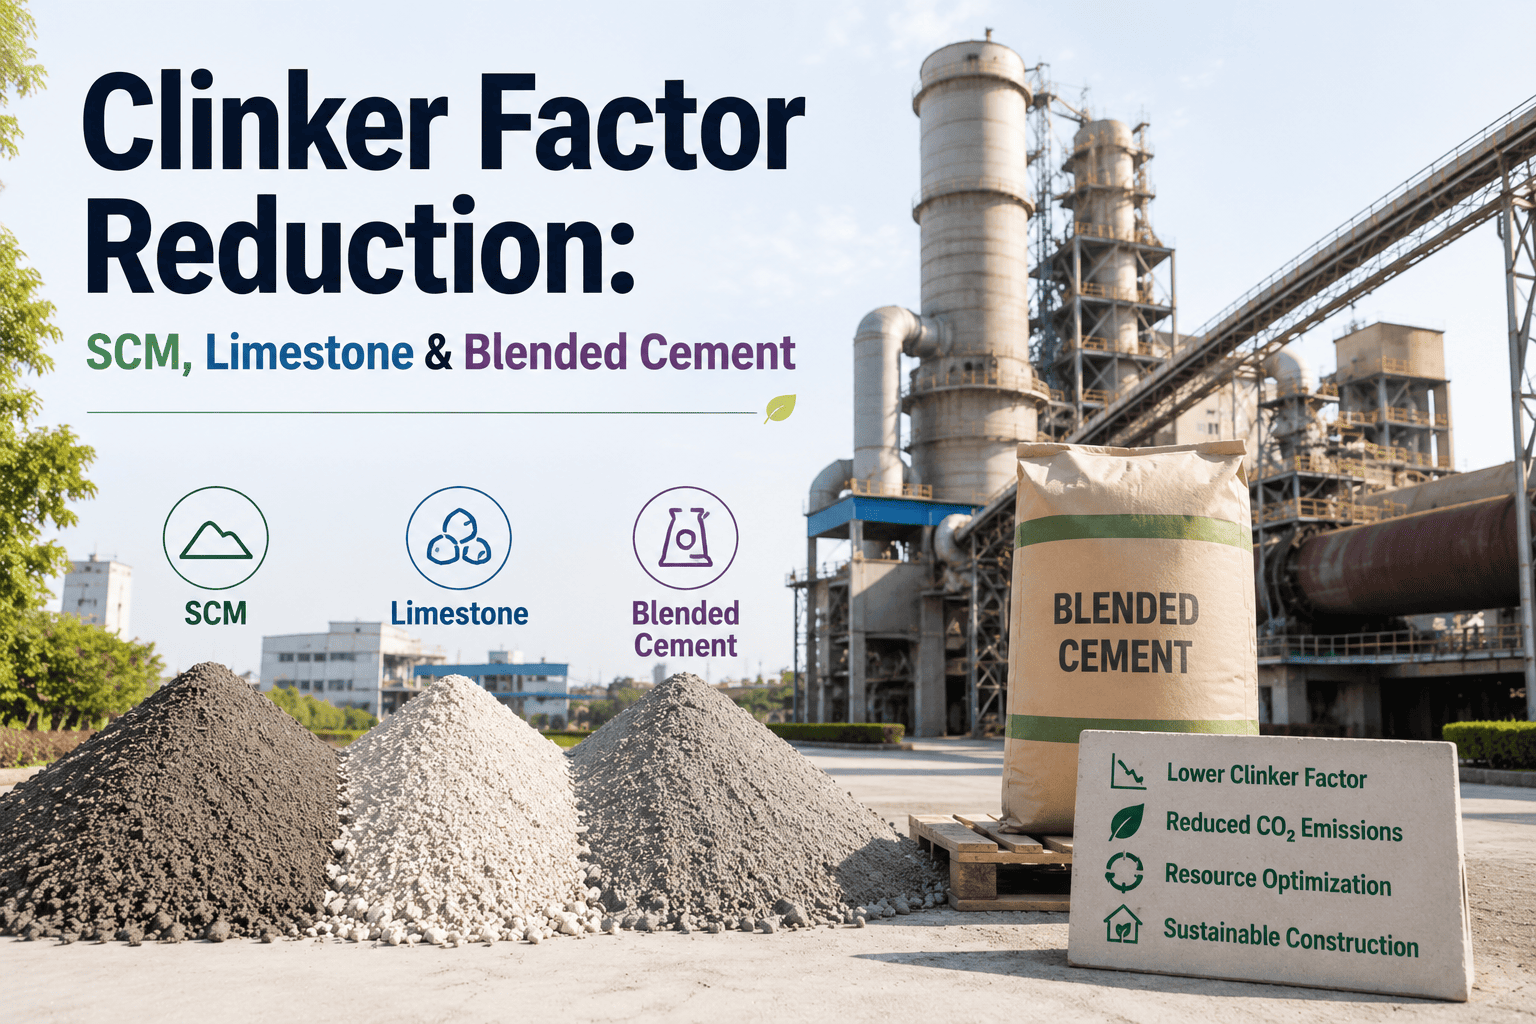
Every ton of clinker fired in a kiln releases close to a ton of CO2, split between the calcination of limestone and the fuel burned to reach kiln temperature, which is exactly why the fastest lever most cement plants have for lowering their carbon footprint isn't a new kiln at all — it's the clinker factor, the share of clinker inside every ton of finished cement. Blending clinker with supplementary cementitious materials and additional ground limestone lets a plant produce the same volume of cement while feeding far less material through the kiln in the first place, and iFactory helps producers plan, trial, and verify every blend through a Book a Demo.
Cut Clinker Per Ton, Not Strength Per Bag
SCM blending and limestone substitution let a plant hold cement performance steady while shrinking the clinker share of every ton produced — and every point that clinker factor drops is CO2 that never leaves the kiln.
What Clinker Factor Actually Measures, And Why It Moves The CO2 Number Directly
Clinker factor is simply the ratio of clinker to total cementitious material in a finished ton of cement, expressed as a percentage. A bag of ordinary portland cement typically sits near the top of that range, since it is made almost entirely of ground clinker with a small amount of gypsum added to control setting time. Every other ingredient in a blended cement — fly ash, ground granulated blast furnace slag, natural pozzolan, or ground limestone — displaces clinker on a roughly ton-for-ton basis, which means the clinker factor and the embodied carbon of the cement move together almost in lockstep. Because calcining limestone to make clinker is responsible for a large share of cement's process emissions, and firing the kiln to clinkering temperature accounts for most of the rest, reducing the clinker factor by ten percentage points removes a comparable share of both emission sources at once, without requiring any change to the kiln itself. This is why clinker factor reduction is usually the least capital-intensive decarbonization lever available to a cement plant: the kiln, the calciner, and the fuel mix can all stay exactly as they are, while the finish mill simply grinds a different recipe.
The reason clinker factor gets so much attention from plant management and from corporate sustainability teams alike is that it is one of the few carbon levers a plant can move on a timescale of months rather than years. Switching kiln fuel to alternative or lower-carbon sources, installing carbon capture, or upgrading a preheater tower all require significant capital, lead time, and often a full plant shutdown to implement. Adjusting a finish mill recipe, by contrast, can begin with a lab trial this week and reach commercial-scale production within a quarter once the blend is validated against the relevant standard. That speed is also why clinker factor is usually the first metric a plant tracks when it sets a public decarbonization target, since it gives visible, quarter-over-quarter progress long before slower capital projects come online.
Four Materials That Displace Clinker Without Displacing Performance
Not every SCM behaves the same way once it enters the mix, which is why a blending program has to be matched to whatever materials are actually available near the plant rather than copied wholesale from another site's recipe. Reactivity, particle fineness, and even the color of the finished cement all vary by source, so a material that works well at one plant may need a different replacement rate or a finer grind at another before it performs the same way.
Fly Ash
A byproduct of coal combustion, fly ash reacts slowly with the calcium hydroxide released as clinker hydrates, which improves long-term strength and reduces permeability even though early strength develops more gradually than in straight OPC. Replacement rates commonly range from 15 to 35 percent depending on the ash's calcium content and how consistently the source power plant burns its coal.
Ground Granulated Slag
Slag from blast furnace iron production carries latent hydraulic properties of its own once activated by the alkalinity of clinker hydration, allowing replacement rates well beyond what fly ash alone typically supports. Some slag cements run 50 percent replacement or higher while still meeting general-purpose strength classes, provided the slag is ground to a comparable fineness as the clinker it displaces.
Natural Pozzolan
Volcanic ash, calcined clay, and similar naturally occurring materials react with hydration byproducts in much the same way as fly ash, and are attractive where a plant sits near a natural deposit rather than a coal or steel supply chain. Calcined clay in particular has drawn renewed interest because it does not depend on the output of another industry that may itself be decarbonizing and shrinking its byproduct supply over time.
Ground Limestone
Finely ground limestone is largely inert chemically but improves particle packing in the finished cement, and recent codes now permit higher limestone additions than older standards allowed, unlocking additional clinker reduction at low cost. Because limestone is typically quarried on site or nearby, it is also the SCM least exposed to the supply and freight volatility that affects fly ash and slag.
Track Clinker Factor And CO2 Per Ton On Every Batch, Not Just The Monthly Average
iFactory connects mill proportioning data, SCM feed rates, and lab strength results into one live view, so blend adjustments show up in the CO2 number the same shift they're made.
Clinker Factor And CO2 Impact Across Common Cement Types
The table below lines up common cement designations against their typical clinker factor range and the approximate CO2 reduction per ton compared with straight ordinary portland cement, based on the SCM levels each designation typically allows.
| Cement Designation | Typical Clinker Factor | Approx. CO2 Reduction Per Ton |
|---|---|---|
| Ordinary Portland Cement | 92-97% | Baseline |
| Portland Limestone Cement | 80-90% | 5-10% lower |
| Portland Pozzolan Cement | 65-80% | 15-25% lower |
| Slag Cement Blend | 35-55% | 25-40% lower |
| Composite Cement (SCM + Limestone) | 50-70% | 20-35% lower |
These ranges shift depending on local standards, the reactivity of the specific SCM source, and the strength class the finished cement must meet, so a plant's actual reduction should be validated against its own trial blends rather than assumed from published averages.
What Has To Be Balanced Before A Blend Goes Into Production
Raising the SCM or limestone content of a cement is straightforward to do at the mill; the harder part is confirming the resulting cement still meets every performance requirement the market and the applicable standard expect from it. A blend that passes strength testing but fails on workability or durability in the field can undo months of trial work in a single customer complaint, which is why optimization is treated as a full engineering exercise rather than a simple proportioning change.
Reactivity Matching
Each SCM source reacts at a different rate, so the replacement level has to be set against the actual reactivity of the batch on hand rather than a generic industry figure. Reactivity testing on every incoming shipment, not just the first sample from a new supplier, keeps the blend design accurate as sources shift over time.
Strength Development Curve
Higher SCM blends often show lower strength at early ages even when 28-day and 90-day strength meet or exceed OPC, which matters for applications with tight formwork removal schedules. Documenting the full curve, not just the design-age result, gives customers the confidence to plan around a slower early gain rather than discovering it on the job site.
Water Demand And Workability
Fine limestone and some pozzolans change water demand and admixture response, so blend trials need to confirm workability at the water-cement ratio actually used on site. A recipe validated only in a lab mixer can behave differently in a ready-mix truck once real admixture dosing and haul time are factored in.
Supply Availability And Logistics
A blend that looks ideal on paper is only useful if the SCM source can be delivered consistently, since fluctuating supply forces frequent recipe changes that complicate quality control. Plants that secure a secondary source or a small on-site buffer stock tend to hold their target clinker factor more steadily through supply disruptions than those relying on a single supplier.
A Staged Path From Current Clinker Factor To Target Clinker Factor
Plants that successfully push clinker factor down over time tend to move in stages rather than jumping straight to the maximum SCM level a standard permits, since each stage needs to be validated before the next increase is trusted in the market. Moving too quickly risks a strength or workability issue reaching a customer before the plant has confidence in the new recipe, which can set an entire program back by months while trust is rebuilt.
Characterize Available SCM Sources
Test the reactivity, fineness, and consistency of every fly ash, slag, or pozzolan source within economical hauling distance before committing to a blend design.
Run Trial Blends At Increasing Replacement Levels
Move up in modest increments, confirming strength, setting time, and workability at each step before advancing to the next replacement percentage.
Validate Full Strength Development Curves
Carry trial samples through early, 28-day, and 90-day testing to confirm the blend meets every strength requirement the target market specifies, not just the 28-day figure.
Calibrate The Finish Mill For The New Recipe
Blended materials often require different grinding times or separator settings to reach target fineness, so mill calibration needs revisiting whenever the recipe changes materially.
Monitor Blend Ratios And CO2 Impact In Production
Once in production, continuous monitoring of feed rates against target ratios catches drift before it shows up as an off-spec batch or a missed carbon reduction target.
Where Clinker Factor Reduction Programs Run Into Trouble
Most setbacks in a blending program trace back to a small set of avoidable issues, and knowing them in advance saves a plant from rediscovering them the expensive way. None of these issues are unusual or hard to plan around, but each one has derailed a blending program somewhere at some point, which is exactly why they show up repeatedly in post-mortems across the industry.
Early Strength Shortfall
Pushing SCM levels up without adjusting curing guidance or fineness can leave early-age strength below what fast-turnaround construction schedules require.
Inconsistent SCM Supply Quality
A fly ash or slag source that varies batch to batch forces constant blend adjustment, and without tight incoming quality checks, that variability shows up in the finished cement.
Over-Blending Limestone
Limestone addition improves packing up to a point, but beyond the level a standard and the mix design support, it dilutes strength faster than it saves clinker.
Ignoring Carbonation And Durability Testing
Higher SCM blends can shift carbonation resistance and chloride ingress behavior, so durability testing for the intended exposure class should run alongside strength testing, not after.
We were running close to a 94% clinker factor across most of our product line and knew there was room to move, but every trial blend we tried by hand took weeks to get lab results back before we could adjust the next batch. Once we had live visibility into mill feed ratios alongside our lab data, we brought our blended line down to a 68% clinker factor within two quarters without a single strength complaint from a customer, and our reported CO2 per ton on that line dropped by nearly a quarter.
Frequently Asked Questions
Q: How low can clinker factor go without compromising strength?
There is no single answer, since it depends heavily on the reactivity of the SCM source, the cement grade being targeted, and the applicable standard's limits for each cement type. Slag-heavy blends have reached clinker factors in the 30 to 40 percent range in commercial production while still meeting structural strength classes, though this typically requires slower early strength gain that must be planned for in construction scheduling. Portland pozzolan and portland limestone cements more commonly settle in the 65 to 85 percent range, which balances a meaningful clinker reduction against minimal changes to handling and curing practice. iFactory's process data can help identify where a specific plant's SCM sources top out. Reach out through Support Contact to review your available materials.
Q: Does reducing clinker factor require new grinding equipment?
In most cases no, since existing finish mills can typically handle blended cements with adjustments to grinding time, separator settings, or feed proportioning rather than requiring new capital equipment. Some plants do eventually invest in a dedicated SCM grinding circuit if slag or pozzolan needs finer grinding than clinker to reach comparable reactivity, but this is usually a later-stage investment rather than a prerequisite for starting a blending program. A Book a Demo session can walk through what your current mill configuration can support before any capital is committed.
Q: How do we know which SCM source is right for our plant?
The right SCM source is largely determined by what is available within economical transport distance, since freight costs on a bulky, low-value material like fly ash or slag can quickly erase the cost advantage of displacing clinker. Beyond availability, reactivity testing on representative samples is essential, because two shipments labeled the same way can behave very differently in a mix depending on their source and processing history. Most plants end up running a blend of two or more SCM sources rather than relying on a single supply, both to manage cost and to buffer against supply interruptions from any one source.
Q: Will customers accept a higher-SCM blended cement in place of standard OPC?
Acceptance generally depends on whether the finished cement meets the strength class and setting time the customer's application requires, rather than on the blend recipe itself, and most modern standards already define blended cement categories with their own accepted strength classes specifically for this reason. Ready-mix producers and precast operations that plan their curing schedules around the strength curve of a blended cement typically see no practical difference in outcome, while very fast-turnaround applications may need either a higher early-strength blend or adjusted curing practice.
Q: How quickly can a plant see the CO2 benefit reflected in reporting?
Once a blend is validated and moved into regular production, the CO2 per ton reduction shows up immediately in any reporting system that calculates emissions from actual clinker content rather than from a fixed plant-wide average, since the blend ratio directly determines the clinker mass per ton of finished cement. Plants relying on manual, periodic calculations may only see this reflected at the next reporting cycle, which is one of the reasons continuous production data matters as much for carbon reporting as it does for quality control.
Lower Your Clinker Factor With Data You Can Trust On Every Batch.
iFactory brings mill data, SCM quality checks, and lab results into one place so your blending program moves forward with confidence instead of guesswork.