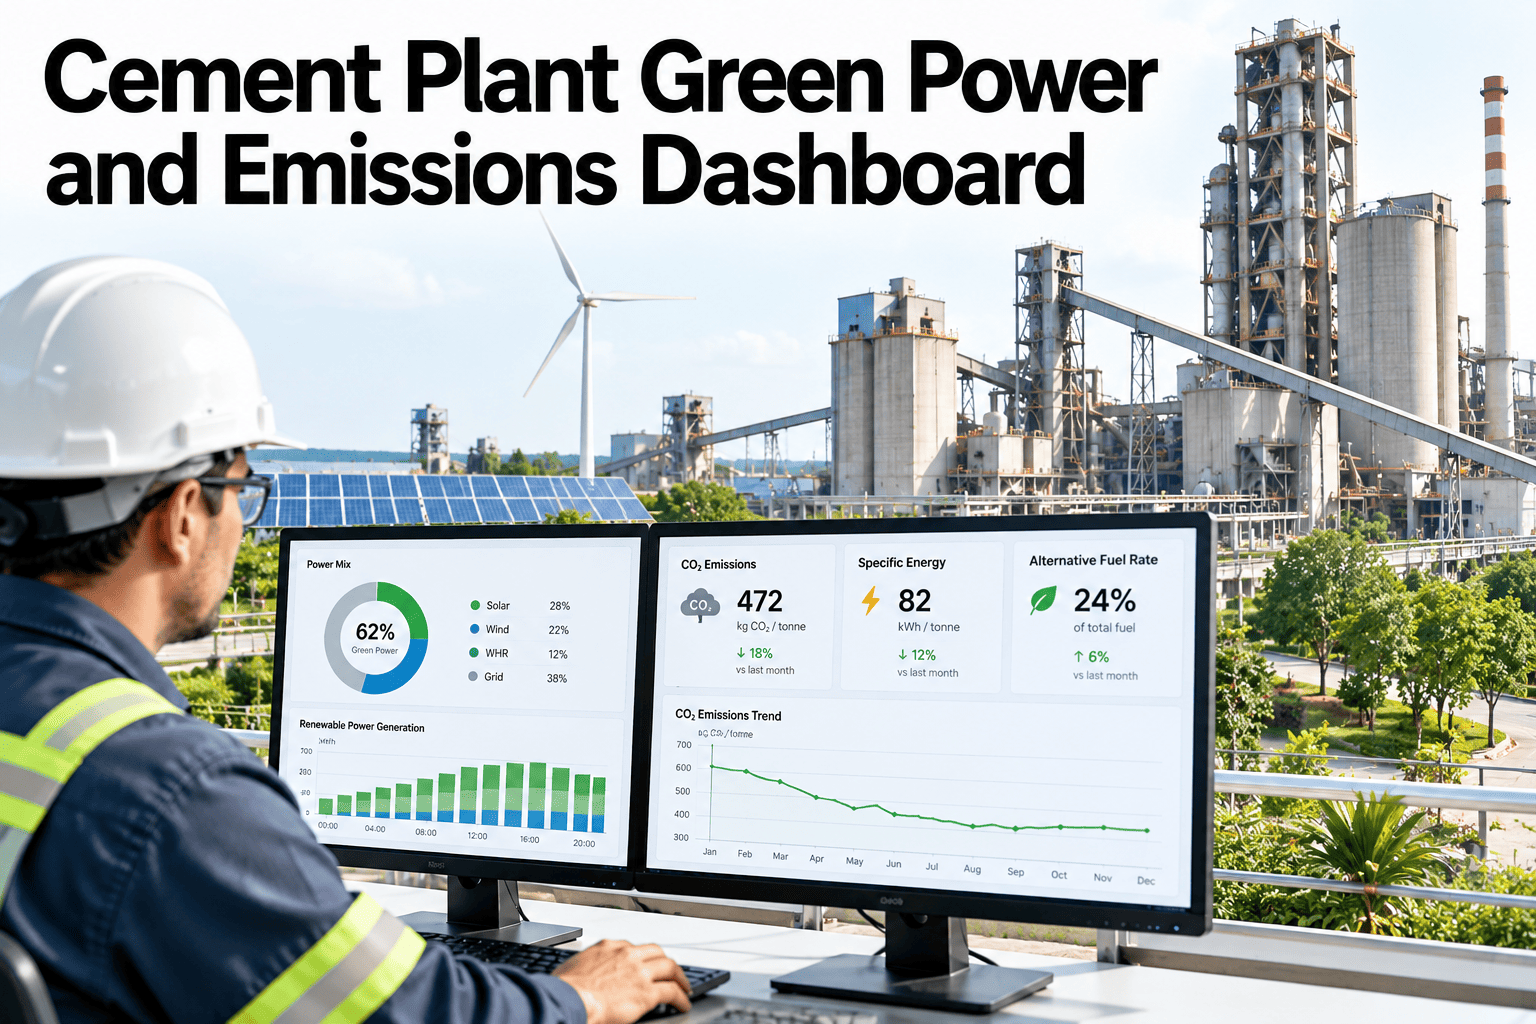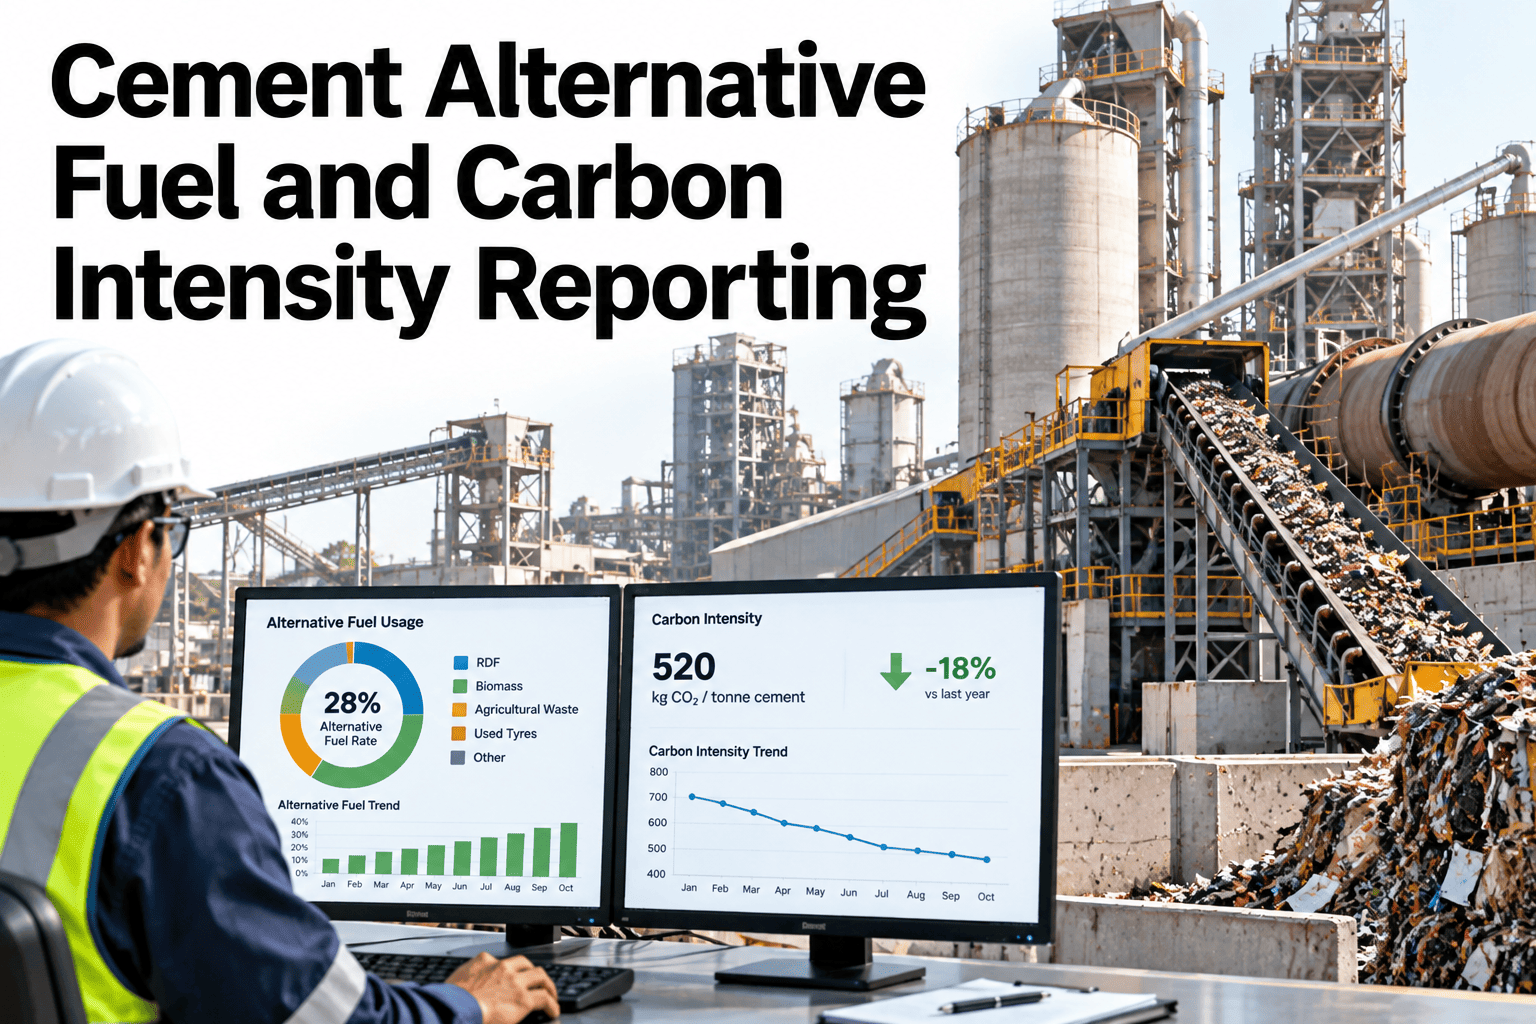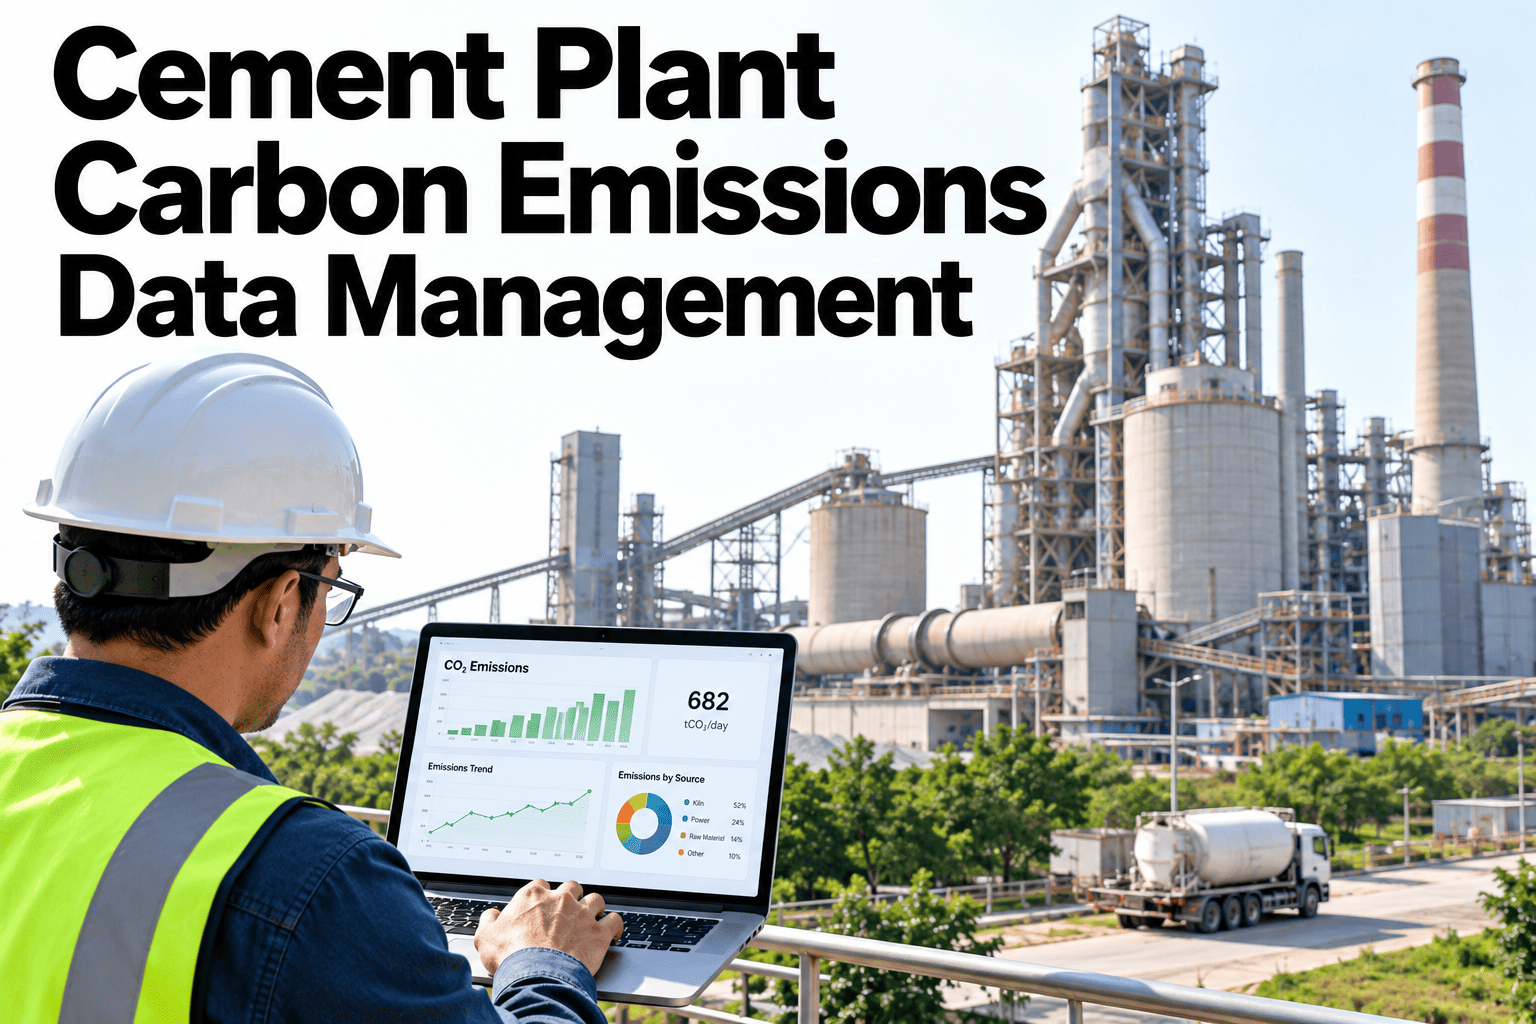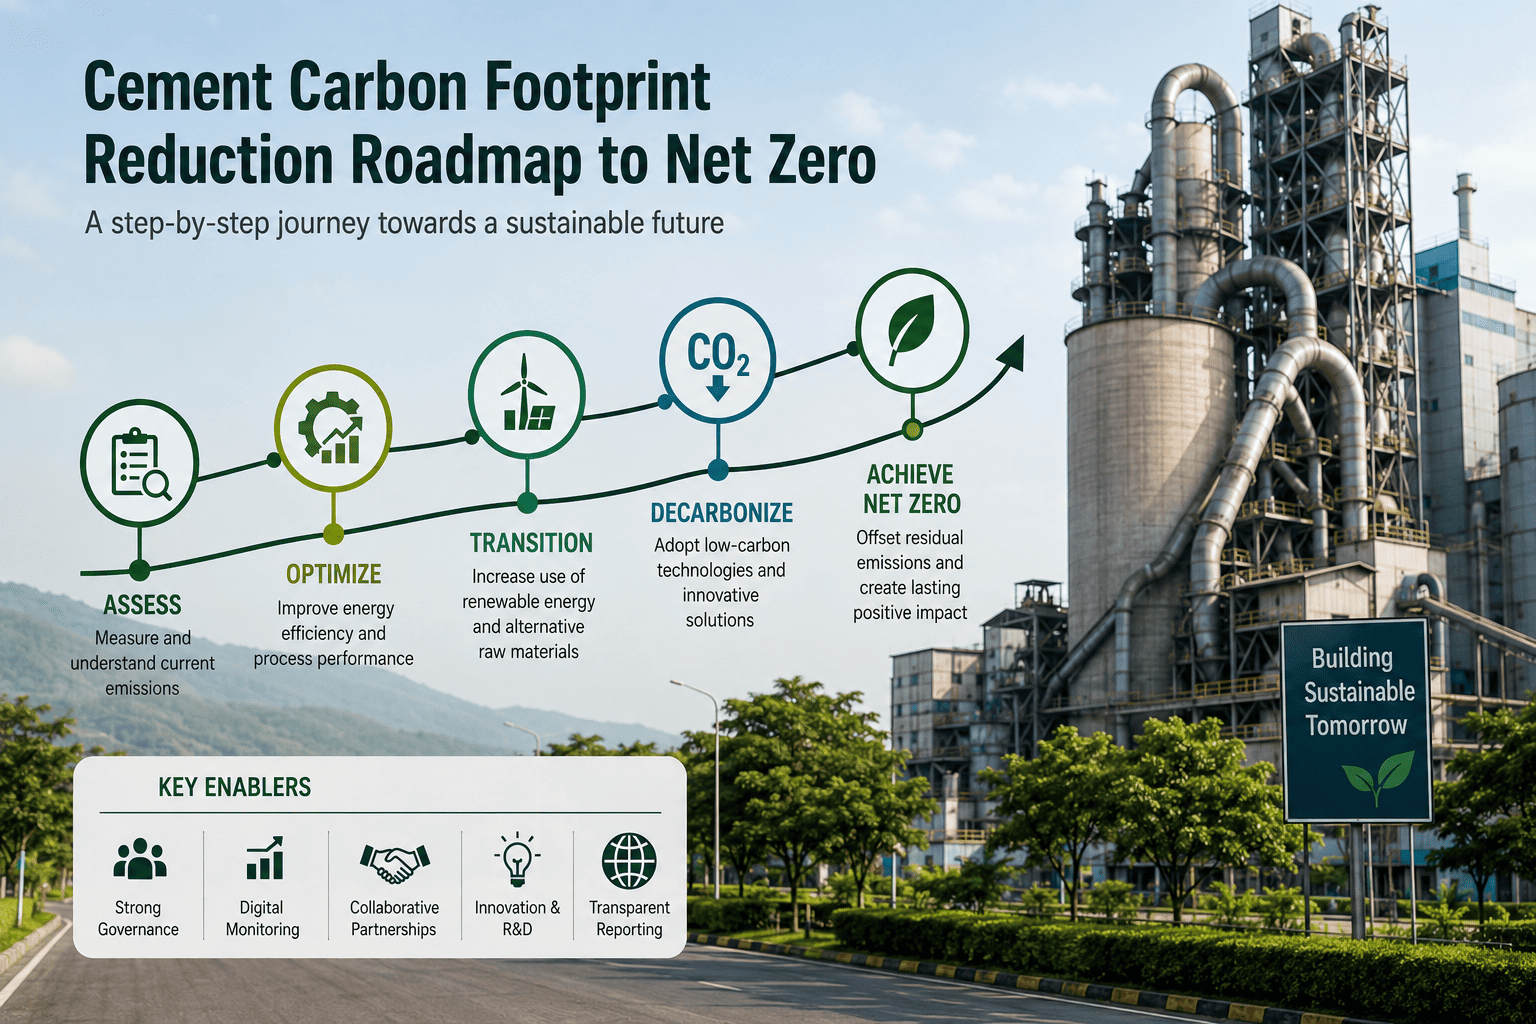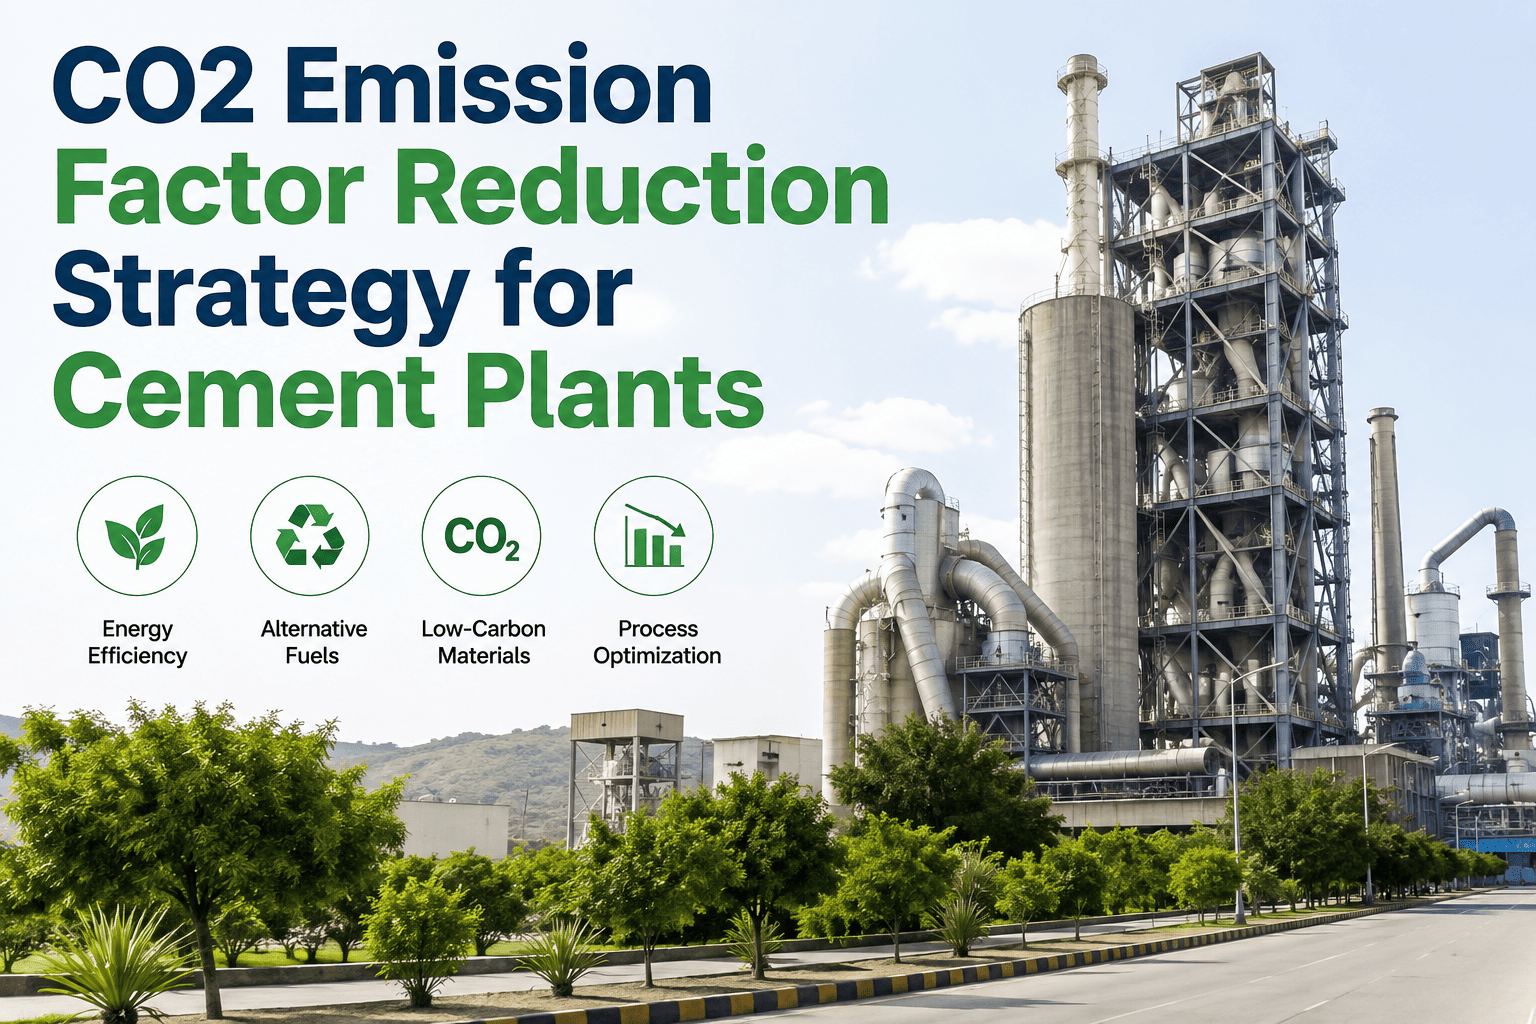
Every cement plant carries a fixed chemical reality: heating limestone to make clinker releases carbon dioxide no matter how efficient the kiln is, and that single reaction accounts for roughly 60 to 65 percent of the sector's direct emissions before a single burner is even lit. The remaining share comes from burning fuel to reach the 1,450°C needed for sintering, which means a real emission factor reduction strategy has to work on two fronts at once — the chemistry of what goes into the kiln and the energy used to run it. Plants that treat these as one combined program instead of two separate initiatives are the ones actually moving their emission factor, not just their sustainability report. A demo walks through how continuous emission tracking ties both levers together on one dashboard.
Why Emission Factor Work Fails When It's Treated as One Initiative
Most plants that start a decarbonization push begin with the fuel mix, because swapping coal for alternative fuels is visible, fundable, and easy to report on. That's a legitimate lever, but it only touches the 35 to 40 percent of emissions tied to combustion — it does nothing to the calcination share, which is larger and driven entirely by how much clinker the kiln actually has to produce. A plant that hits an ambitious alternative fuel substitution rate while leaving its clinker factor untouched has optimized the smaller half of the problem and left the larger half exactly where it started.
The plants making real year-over-year progress run clinker factor reduction, fuel substitution, and thermal efficiency as three coordinated workstreams reporting into the same emission factor target, rather than three departments each claiming their own win. That coordination is also what regulators and carbon-market auditors are increasingly asking to see — not isolated project wins, but a documented, verifiable trend line in tonnes of CO2 per tonne of cementitious product, tracked continuously rather than recalculated once a year for an annual sustainability filing.
Clinker Factor: The Lever With the Biggest Ceiling and the Slowest Pace
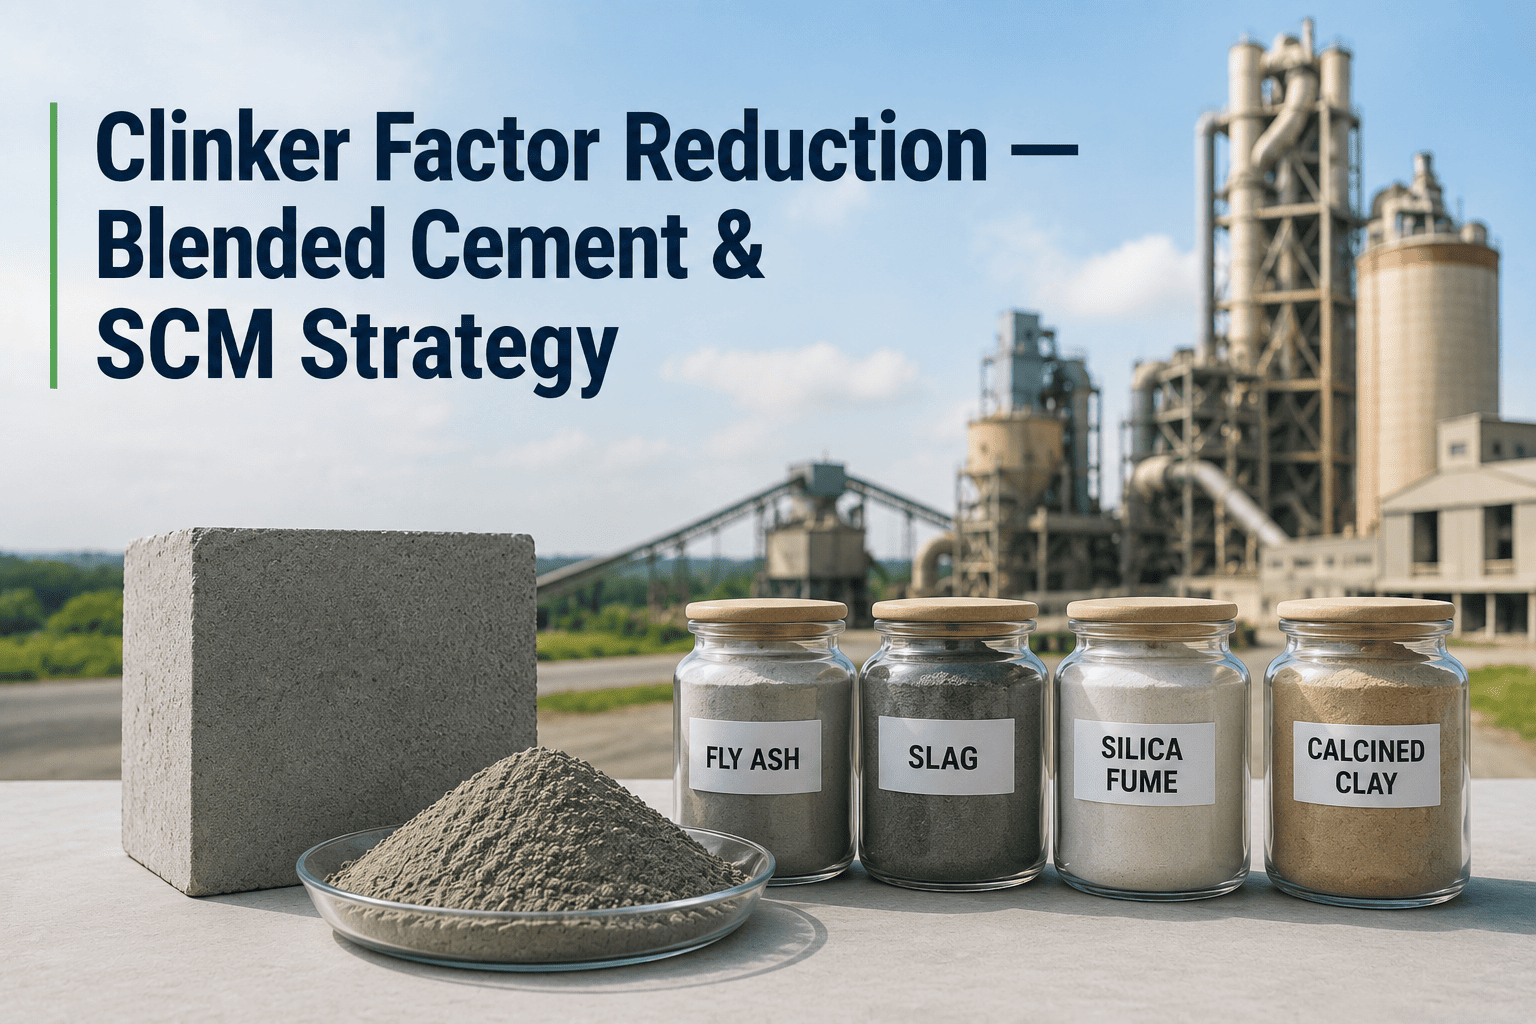
Lowering the clinker factor is the single most effective lever available because it reduces the emission source at its root rather than cleaning up after it, but it's also the slowest to move because every substitution has to survive durability testing, code approval, and — often the real bottleneck — a customer or specifier who's used to ordinary Portland cement and needs convincing that a blended product performs the same in their application. Fly ash and slag availability are themselves shrinking as coal power and blast furnace steelmaking decline in many regions, which is pushing plants toward calcined clay and limestone calcined clay cement (LC3) blends as the more scalable long-term substitute.
The realistic ceiling matters here too. Industry roadmaps generally treat a clinker factor in the 0.60 to 0.65 range as an achievable target for most plants within the next several years without a fundamental process redesign, down from a conventional factor closer to 0.85 to 0.95. Getting there isn't a single decision — it's a running program of raw material qualification, blend ratio testing by product line, and strength-development monitoring to confirm every batch still meets the specification the customer is buying against.
Alternative Fuels: What Actually Moves the Combustion Share
Alternative fuel programs succeed or stall based on supply consistency, not ambition. A plant that can secure a steady stream of biomass or refuse-derived fuel at a stable moisture and calorific value will see a real, sustained reduction in its combustion emission factor; a plant that treats alternative fuel as an opportunistic top-up whenever a cheap load becomes available will see numbers that swing month to month and never build into a defensible trend. The table below reflects how the major alternative fuel categories compare on emissions performance and operational complexity.
| Fuel Type | CO2 Emission Factor vs. Coal | Operational Complexity |
|---|---|---|
| Biomass (sawdust, agricultural residue) | 35-45% lower | Moderate — supply and moisture variability |
| Refuse-derived fuel (RDF) | 15-25% lower | Higher — feedstock sorting and chlorine control |
| Tire-derived fuel (TDF) | 10-20% lower | Moderate — steel wire handling, SO2 monitoring |
| Sewage sludge | 20-30% lower | Higher — odor and handling infrastructure |
| Hydrogen (pilot-scale) | Up to ~28% lower (combustion only) | Very high — storage, burner retrofit |
Thermal Efficiency: The Lever Every Plant Already Has Data For
Thermal efficiency improvements don't require new suppliers, new blend approvals, or new fuel contracts — they work with the plant that already exists, which is why they're usually the fastest lever to start moving even though their ceiling is lower than clinker factor reduction. Kiln shell radiation loss, air leakage into the preheater tower, and an underperforming clinker cooler all show up as extra fuel burned per tonne of clinker, and every extra unit of fuel is an extra unit of combustion emissions on top of what the process chemistry already requires.
Waste heat recovery systems that capture exhaust gas heat from the preheater and clinker cooler for power generation are the highest-profile thermal efficiency project, but the groundwork that makes them worth the capital investment is the same operational discipline that improves specific fuel consumption on its own: consistent kiln feed, stable burning zone temperature, and a coating and refractory condition that isn't forcing the operator to run hotter than the process needs. A kiln running an unstable flame or losing coating in the burning zone typically burns measurably more fuel per tonne of clinker than one running a controlled, steady profile.
Why the Reporting Layer Is Becoming Its Own Requirement
A reduction strategy only counts as real once it can be verified, and that verification bar is rising fast. The EU's Carbon Border Adjustment Mechanism now requires exporters to report embedded emissions per tonne of cement with a level of granularity that a once-a-year spreadsheet reconciliation can't reliably produce, and ISO 14001 and 50001 recertification cycles increasingly expect energy and emissions data to trace back to the equipment level rather than a plant-wide estimate. Plants that can show a continuous, equipment-linked emission factor trend are in a materially stronger position during both a CBAM audit and an internal capital allocation review than plants presenting a single annual number with no supporting detail.
This is also where the three levers stop being separate departments and start needing a shared system. Clinker factor data usually lives with the quality lab, fuel substitution data lives with procurement or the kiln control room, and thermal efficiency data lives with maintenance and process engineering. Without a common place where all three feed into the same emission factor number, a plant can be improving on paper in three different departments while the combined trend line barely moves — and nobody notices until the annual rollup makes it obvious.
Sequencing Capital Across the Three Levers
Every plant runs on a finite capital budget, and one of the most common strategy mistakes is spreading that budget thinly across all three levers at once instead of sequencing investment based on payback speed and dependency. Thermal efficiency fixes — sealing air leakage, restoring cooler performance, correcting shell insulation gaps — tend to have the shortest payback because they reduce fuel consumption directly without touching product specification or supply chain, which makes them the natural first capital call even on a constrained budget. Alternative fuel infrastructure, from feed handling systems to burner modifications, sits in the middle: meaningful capital outlay, but a fuel cost offset that usually pays it back within a few years once supply contracts are stable. Clinker factor investment — new grinding capacity for SCMs, calcined clay processing, product reformulation testing — is the largest and slowest-paying lever, which is exactly why it needs to start early even though its financial return lands last.
This sequencing logic is also why the reporting layer matters as much as the physical investment itself. A capital committee reviewing a clinker factor project two years into a five-year payback needs to see the thermal efficiency and fuel substitution gains already banked and visible in the same emission factor trend line, or the slower lever can look like it's underperforming when it's actually on schedule. Keeping all three workstreams inside one continuously updated view protects the long-payback investment from being judged against the wrong timeline.