The cement industry stands at a historical inflection point, where the path to Net-Zero 2050 requires a fundamental restructuring of chemical, thermal, and mechanical processes. Achieving a deep decarbonization roadmap demands more than incremental efficiency; it requires the integration of Carbon Capture (CCUS), alternative fuel substitution, and clinker factor reduction into a single, unified operational intelligence layer. Digital twin technology is the catalyst for this transformation, providing the predictive modeling environment necessary to simulate complex decarbonization levers without compromising clinker quality or plant stability. For cement producers navigating the transition from high-carbon fossil fuels to circular, low-carbon manufacturing, adopting an AI-driven decarbonization roadmap is the only path to maintaining license to operate in a carbon-constrained global market. This guide explores how digital twin simulation, Waste Heat Recovery (WHR) optimization, and real-time carbon intensity analytics provide the roadmap for the future of sustainable cement. Book a demo to see your plant's net-zero roadmap.
Map Your Strategic Path to Net-Zero Cement
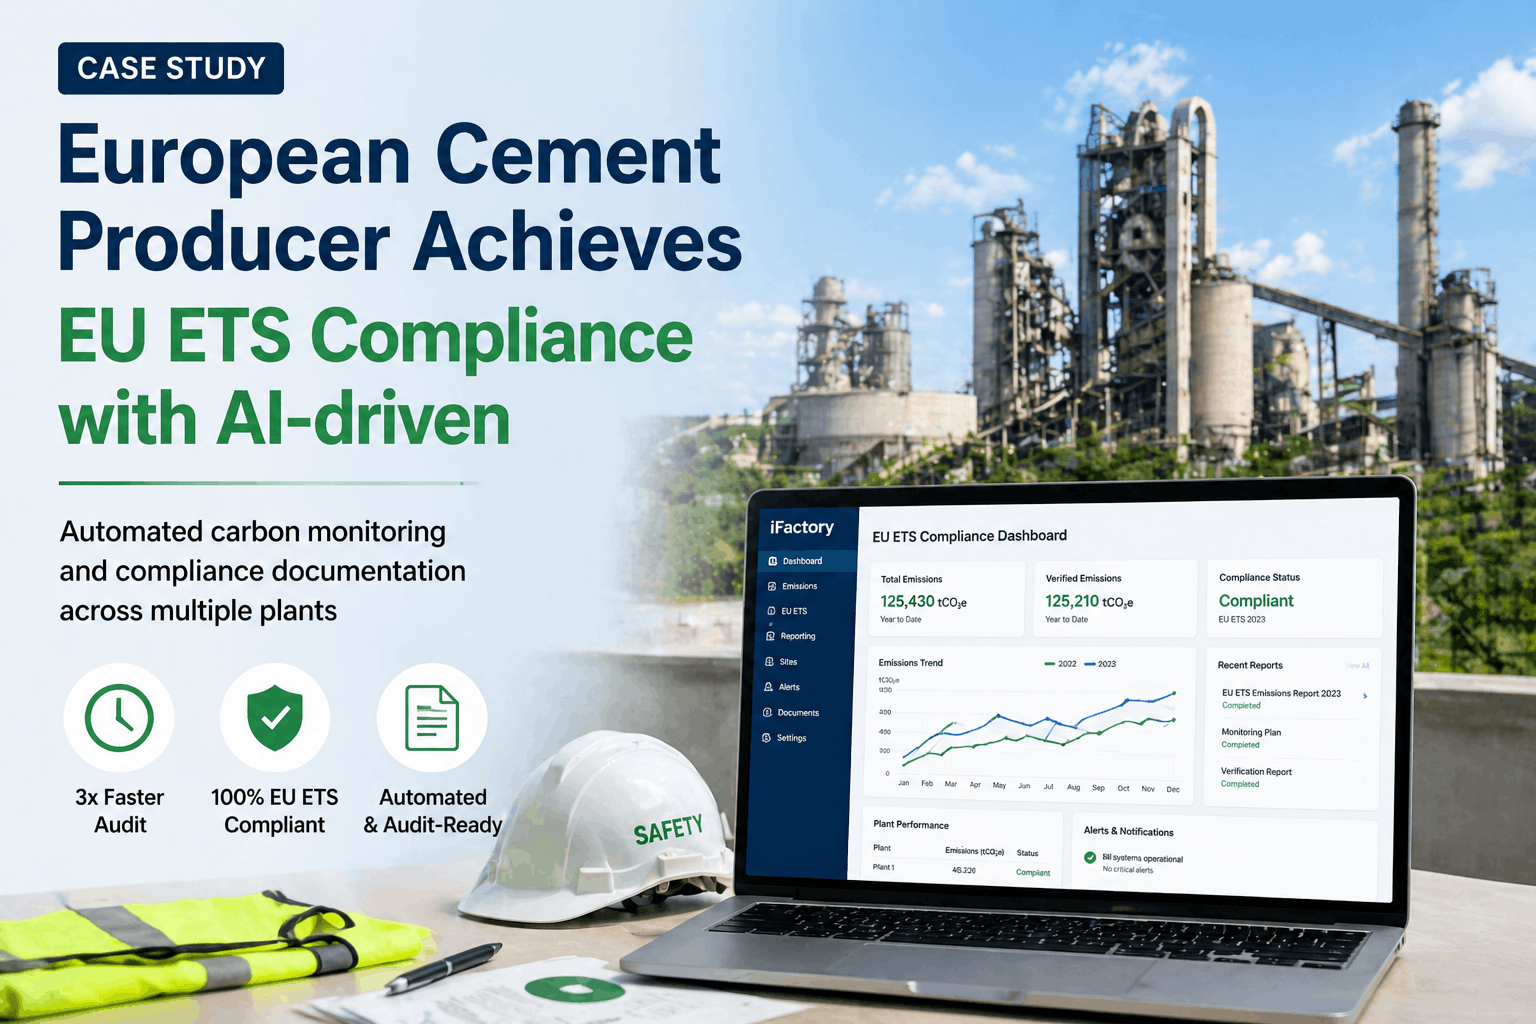
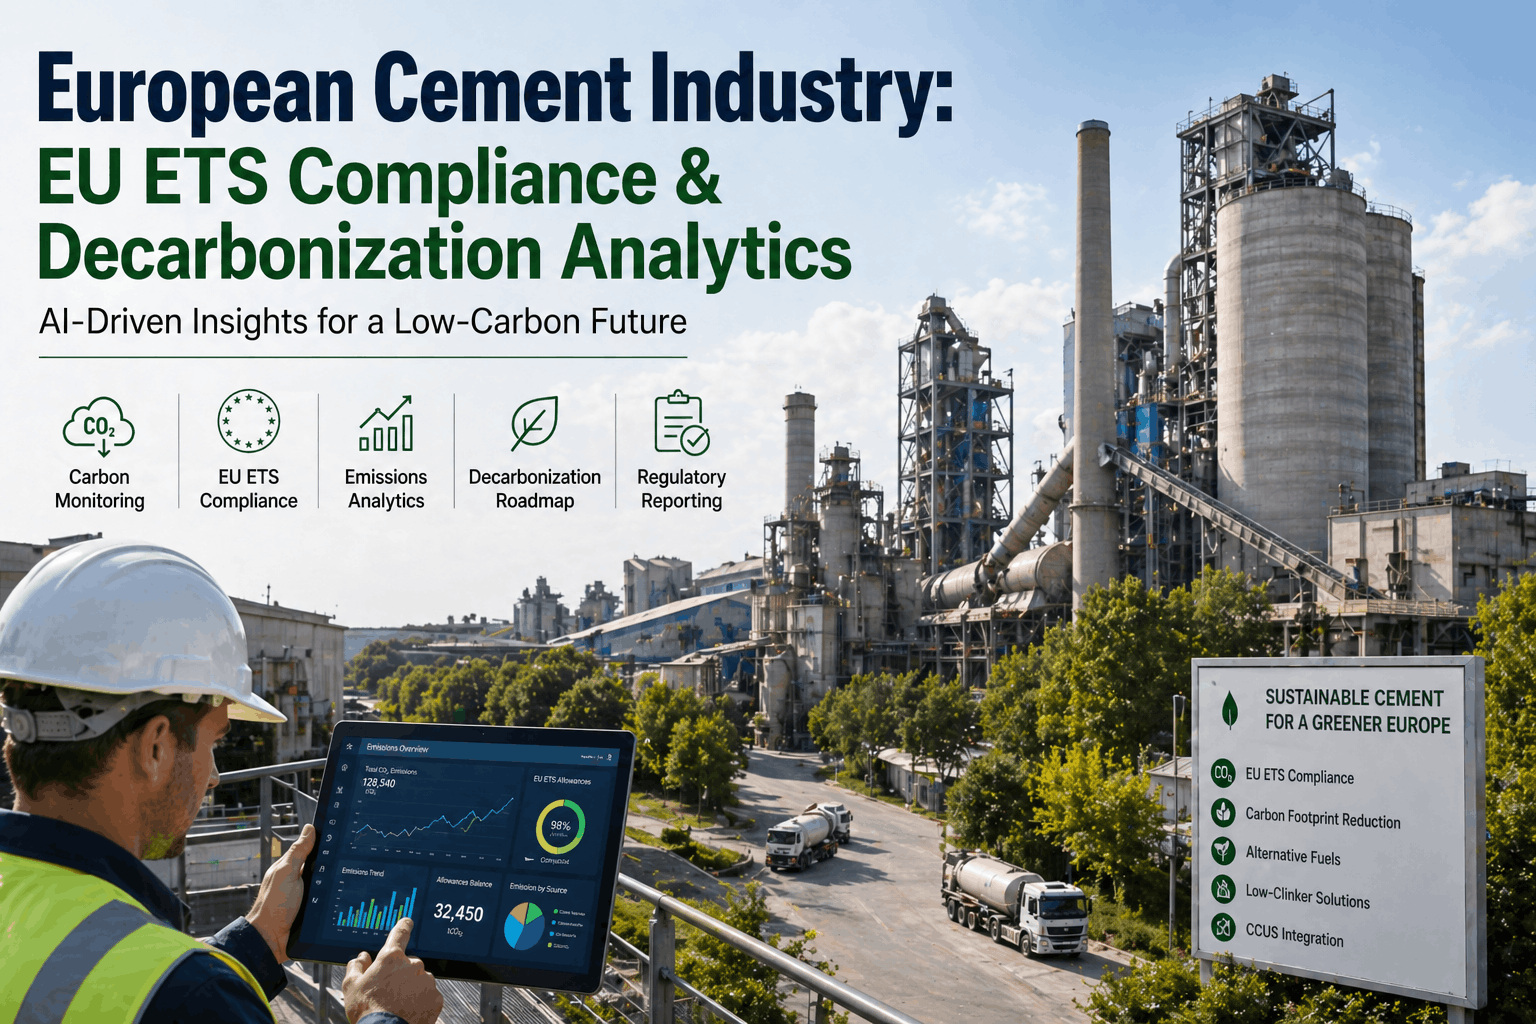
iFactory's decarbonization platform coordinates CCUS readiness, alternative fuel substitution, and clinker optimization within a single intelligent digital twin.
The Four Pillars of the Cement Decarbonization Roadmap
Achieving Net-Zero requires a coordinated attack on both chemical process emissions (calcination) and thermal/electrical energy intensity. When a digital twin models a decarbonization roadmap, it doesn't just track CO2—it simulates the interdependencies between clinker chemistry, kiln temperature profiles, and alternative fuel moisture. This is the difference between an ESG report and a genuine manufacturing intelligence software for sustainability. Manufacturers who book a demo with iFactory consistently report that the ability to model these trade-offs in real-time is what finally makes their 2050 carbon targets feel achievable.
Clinker Factor Reduction (LC3)
Simulate the integration of calcined clays and limestone (LC3 technology) to reduce clinker-to-cement ratios by up to 40%. The digital twin predicts strength development and setting times, ensuring high-performance green cement.
Thermal Substitution (AF & TSR)
Maximize the use of waste-derived and biomass fuels. iFactory's AI models compensate for the moisture and chemical volatility of alternative fuels, maintaining kiln stability at substitution rates exceeding 80%.
Waste Heat Recovery (WHR)
Capture and repurpose thermal energy from the kiln preheater and cooler. The digital twin optimizes WHR cycles to generate carbon-free electricity, reducing Scope 2 emissions and grid dependency.
Carbon Capture Readiness (CCUS)
Model flue-gas concentrations and thermal profiles required for high-efficiency carbon capture. Prepare your plant for post-combustion or oxyfuel capture infrastructure with a verified data foundation.
The Financial Logic of Decarbonization: ROI Through Carbon Efficiency
Decarbonization is the single biggest driver of CapEx in the cement industry, but it also offers a fundamental restructuring of OpEx through fuel savings and carbon credit recovery. Digital twin platforms identify the specific causal chains: clinker factor drift, inefficient WHR performance, or excessive fan energy use. It quantifies the decarbonization gap in real kilograms per tonne and dollars per shift. This level of granularity is what finance teams need to approve sustainability CapEx with confidence, and it is why operations directors routinely request a demo before completing their annual carbon budget submissions.
Asset Performance Management (APM) for the Decarbonization Era
The transition to low-carbon cement creates new operational risks. Alternative fuels are abrasive and chemically aggressive, while clinker substitution can impact early-strength consistency. Digital twin platforms mitigate these risks by providing a "Simulation Sandbox" where engineers can model recipe changes before execution. This capability is not a competitive advantage; it is a compliance necessity. Cement manufacturers who have integrated iFactory's sustainability platform report that this contextual audit trail reduces SBTi-alignment preparation time from months to under 4 hours. For operations teams still managing this work manually, a demo conversation is the fastest path to quantifying the ROI of a digital decarbonization roadmap.
| Roadmap Lever | Traditional Approach | Digital Twin Approach | Financial/ESG Impact |
|---|---|---|---|
| Alternative Fuel Use | Static feed (low substitution) | Dynamic TSR optimization vs. stability | –$400k+ annual fuel spend |
| Clinker Factor (SCM) | Batch testing (slow reaction) | Continuous strength-prediction modeling | 18–25% CO2 intensity reduction |
| WHR Power Output | Manual boiler/turbine control | AI-driven thermal cycle optimization | +12% carbon-free power generation |
| ESG Reporting | Annual spreadsheet consolidation | Persistent, real-time digital carbon log | Reporting labor cut by 85% |
| CCUS Integration | Generic engineering estimates | Flue-gas concentration digital twin | Accelerated carbon capture ROI |
— VP of Operations, Global Green Cement Alliance
The Three Phases of a Digital Decarbonization Rollout
Deploying a decarbonization analytics platform in a cement manufacturing environment follows a structured architecture that balances the urgency of carbon targets with the stability of kiln production. This roadmap ensures that data quality is validated before autonomous optimization is activated.
Carbon Baseline & Asset Instrumentation
Instrument kilns, grinders, and WHR systems with high-fidelity IoT sensors. Establish a validated carbon historian that tracks Scope 1 & 2 emissions in real-time. This phase defines the data ceiling for all future optimization. Timeline: 8–14 weeks.
Digital Twin Intelligence & TSR Activation
Commission the kiln's digital twin models. Activate AI-driven Thermal Substitution Rate (TSR) optimization and clinker factor modelling. This is where the plant begins capturing measurable carbon and cost reductions. Timeline: 6–10 weeks.
Closed-Loop Optimization & CCUS Readiness
Integrate digital twin outputs with process controls for autonomous stability. Model flue-gas profiles for CCUS integration. This phase transforms the plant into an active decarbonization engine. Timeline: Ongoing.
Decarbonization Impact Across Key Cement Industry KPIs
The gains from deploying a digital decarbonization roadmap span every operational dimension—from intensity reduction and energy efficiency to regulatory readiness. The chart below benchmarks the average improvement cement plants achieve within 12 months of full deployment, based on iFactory customer data across clinker and grinding facilities.
Cement Decarbonization Roadmap — Frequently Asked Questions
What is the "Clinker Factor" and why is it the first step in the roadmap?
The clinker factor is the ratio of clinker to finished cement. Since clinker production is responsible for 90% of a plant's emissions, reducing this ratio by using Supplementary Cementitious Materials (SCMs) like slag or calcined clay is the fastest and most cost-effective way to lower carbon intensity.
How does a digital twin help manage the chemically aggressive nature of Alternative Fuels (AF)?
Alternative fuels (waste, biomass) have volatile moisture and chlorine levels that can damage kiln refractories and destabilize production. The digital twin simulates these chemical impacts 15–20 minutes before they occur, allowing operators to adjust fuel mixes and kiln geometry to prevent damage.
Is Carbon Capture (CCUS) ready for large-scale cement plant deployment?
CCUS is currently in the pilot and demonstration phase for cement. However, the 2050 roadmap requires CCUS to handle the final 30% of emissions. Preparing today involves digitizing your flue-gas data and thermal profiles to ensure your plant is "CCUS-Ready" when the infrastructure matures.
What is LC3 cement and how does the platform support its production?
LC3 (Limestone Calcined Clay Cement) is a low-carbon cement that reduces clinker by 50%. Producing it requires precise thermal control of the clay calciner. iFactory's digital twin models the calcination process to ensure consistent reactivity and color of the LC3 blend.
How does Waste Heat Recovery (WHR) impact the decarbonization roadmap?
WHR captures heat that would otherwise be lost to the atmosphere and converts it into electricity. This can reduce a plant's Scope 2 emissions by 20–30% and significantly lower grid dependency and utility costs.
How does the platform align with Science Based Targets (SBTi)?
iFactory's reporting module is built around the GHG Protocol and SBTi standards. It provides the immutable, time-stamped evidence of carbon reduction required for validated science-based certification and ESG audit readiness.
Can the digital twin predict the impact of hydrogen-enriched combustion?
Yes. We are already modeling hydrogen injection as a thermal booster. The digital twin simulates the flame temperature shifts and potential NOx increases associated with hydrogen, allowing for safe experimental deployment of green hydrogen in kilns.
What is the typical ROI for a digital decarbonization investment?
Payback typically occurs within 9–18 months through a combination of alternative fuel savings, energy efficiency gains, and carbon credit recovery (where carbon markets exist). The regulatory risk mitigation value—preserving the license to operate—is an additional, foundational ROI factor.
Deploy a Decarbonization Roadmap That Delivers Real ROI
iFactory's sustainability platform delivers real-time asset intelligence, alternative fuel optimization, and clinker reduction modelling — purpose-built for the future of green cement.