The cement industry's thermal energy requirement — approximately 3.0 to 3.6 million BTU per ton of clinker in a modern dry-process preheater-precalciner kiln — is a fundamental constraint on decarbonization because 60 to 65% of that energy must reach temperatures above 1,450 degrees Celsius in the kiln burning zone, temperatures that conventional electric resistance and induction heating technologies have not been able to deliver at industrial scale. That technical barrier is the reason cement production generates approximately 7 to 8% of global CO2 emissions despite contributing less than 1% of global GDP — and it is the reason that cement has been classified as a hard-to-abate sector in every industrial decarbonization framework published by the IEA, the GCCA, and the U.S. Department of Energy. The electrification pathway for cement is not a single technology replacement. It is a multi-decade system transition that includes electric kiln technologies for the calcination step (where 60% of process CO2 is released), green hydrogen combustion for the high-temperature sintering step, renewable energy-powered grinding and material handling, and carbon capture powered by clean electricity to address the remaining process emissions. The capital investment required for full electrification of a 1.5 million ton per year cement plant is estimated at $180 million to $350 million depending on the technology pathway selected and the plant's existing infrastructure — but the annual operating cost savings from reduced fossil fuel consumption and carbon compliance exposure range from $8 million to $22 million at current and projected carbon pricing scenarios. iFactory's Energy Monitoring and Emissions Tracking modules give cement plant energy managers and sustainability teams the digital infrastructure to track the electrification transition in real time — monitoring electrical energy consumption across every process area, tracking renewable energy certificate procurement and retirement, measuring CO2 reductions against science-based targets, and generating the energy and emissions data required for GCCA sustainability reporting and investor-grade decarbonization disclosures. Book a Demo to see iFactory's energy transition tracking platform configured for your plant's electrification pathway and decarbonization targets.
Cement Plant Energy Profile — Current Fossil Fuel Consumption vs. Electrification Potential by Process Area
Understanding the electrification pathway for a cement plant requires mapping the current energy profile by process area — quantifying the thermal and electrical energy consumed at each step, the temperature requirements, and the technology options available for electrifying each energy input. The table below presents the current energy consumption profile for a 1.5 million ton per year dry-process cement plant, the electrification technologies available for each process area, and the estimated CO2 reduction potential of each technology pathway.
Electrification Technologies for Cement Production — Current Maturity, Cost, and CO2 Reduction Potential
The electrification of cement production is not a single technology pathway but a portfolio of technologies at different stages of commercial maturity — each with a different CO2 reduction potential, capital cost profile, and deployment timeline. The technology assessment below covers the five primary electrification technology categories relevant to U.S. cement plants, organized by the process step they address.
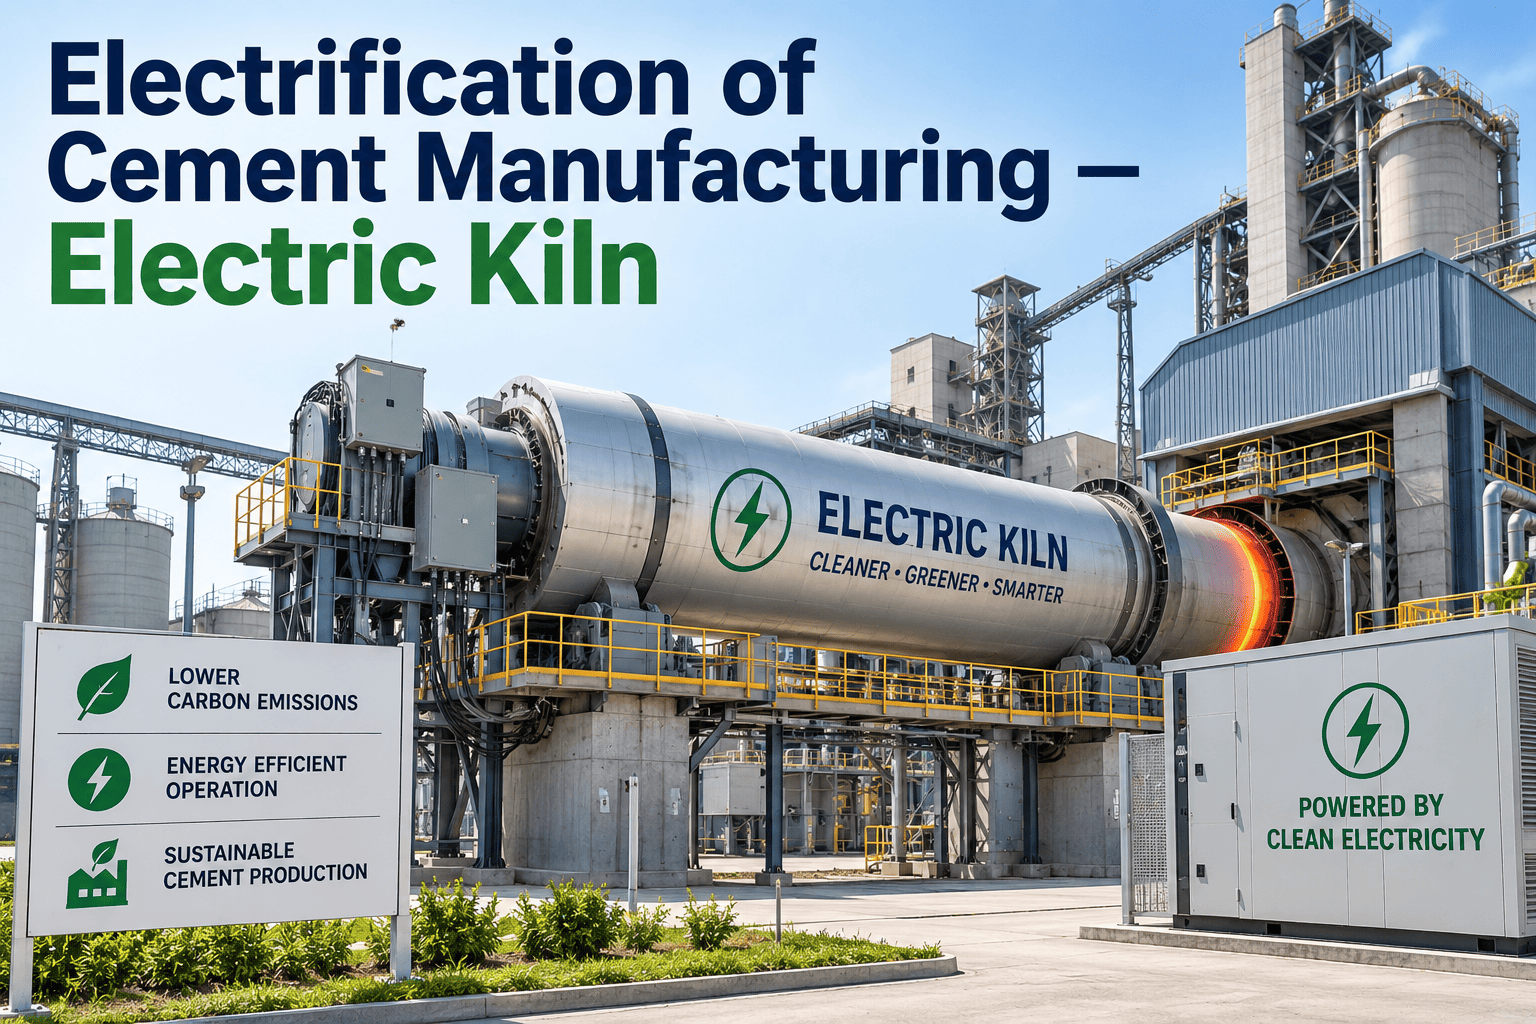
Electric Kiln Technology — Plasma-Assisted and Resistance-Heated Kiln Systems
Electric kiln technology replaces fossil fuel combustion in the kiln burning zone with electrical heating — either through resistance heating elements embedded in the kiln shell, microwave or plasma-assisted heating of the raw meal, or induction heating of the kiln tube. Current status: pilot-scale demonstrations at 10 to 40 tons per day in Europe (CemZero project in Sweden, LEILAC in Belgium). Estimated CO2 reduction: 40 to 60% of total plant emissions (combustion-related Scope 1 only; process CO2 from calcination still requires CCS). Technology readiness level: TRL 5-6. Estimated commercial availability: 2030 to 2035 for full-scale units. Capital cost premium: 25 to 40% above conventional kiln at commercial scale.
Green Hydrogen Combustion — H2-Fired Kiln Burner and Calciner Systems
Green hydrogen produced via electrolysis using renewable electricity can be combusted in the kiln main burner and calciner to achieve the 1,450°C flame temperature required for clinker sintering. Hydrogen combustion produces zero CO2 at the point of use — the only byproduct is water vapor. Current status: pilot demonstrations at 30 to 70% H2 co-firing at multiple European cement plants (Heidelberg Materials, Holcim). Estimated CO2 reduction: 100% of combustion-related emissions (30 to 40% of total plant emissions). Technology readiness level: TRL 7 for co-firing; TRL 5-6 for 100% H2 firing. Estimated commercial availability: 2028 to 2032 for 100% H2. Current green H2 cost: $4.00 to $7.00 per kg, requiring $0.04 to $0.07 per kWh electricity cost for economic viability at scale.
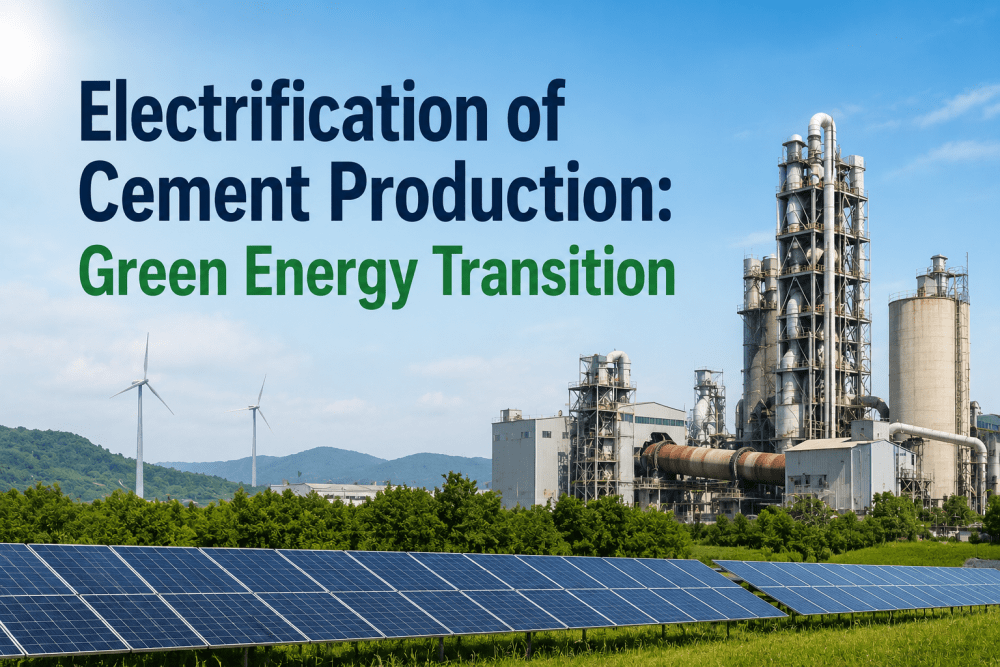
Renewable Energy Integration — On-Site Solar, Wind, and Grid PPAs for Electrical Load
Approximately 18 to 22% of total cement plant energy consumption is electrical — primarily for grinding (raw mill and finish mill), material handling, fans, and environmental control equipment. This electrical load can be decarbonized through on-site solar photovoltaic (5 to 15 MW per plant), on-site wind (10 to 30 MW where wind resource permits), and off-site renewable power purchase agreements. Current status: commercially mature and economically viable at current renewable energy pricing of $0.02 to $0.04 per kWh. CO2 reduction: 18 to 22% of total plant emissions from Scope 2 elimination. Capital investment: $15 million to $45 million for on-site generation at a 1.5 million ton plant. Payback: 4 to 8 years at current grid electricity prices of $0.07 to $0.12 per kWh. iFactory tracks renewable energy generation, PPA certificate retirement, and Scope 2 market-based emissions reporting simultaneously.
Electric Calcination — Electrified Fluidized Bed and Microwave Calciner Systems
Calcination — the thermal decomposition of calcium carbonate (CaCO3) into calcium oxide (CaO) and CO2 at approximately 900°C — accounts for 60 to 65% of cement plant CO2 emissions because the CO2 released is a chemical byproduct of the calcination reaction, not a combustion product. Electric calcination technologies use electrically heated fluidized bed reactors or microwave-assisted calcination to provide the heat required for calcination without fossil fuel combustion — producing a pure CO2 stream that is significantly easier and less expensive to capture than the diluted CO2 in kiln exhaust gas. Current status: pilot demonstrations at 1 to 10 tons per day (LEILAC project, Calix). Estimated CO2 reduction: 60 to 65% of total emissions if coupled with CCS on the pure CO2 stream. Technology readiness level: TRL 5-6. Estimated commercial availability: 2030 to 2035.
Electrified Carbon Capture — Electric Solvent Regeneration and Heat Pump Integration
Post-combustion carbon capture systems require significant thermal energy for solvent regeneration — typically 0.6 to 1.2 MMBTU per ton of CO2 captured for amine-based systems. In conventional CCS installations, this thermal energy is provided by natural gas combustion, producing additional CO2 that must be captured. Electrified CCS replaces natural gas-fired solvent regeneration with electric heat pumps, electric boilers, or electric solvent regeneration technologies that use renewable electricity instead of fossil gas — enabling 95 to 99% net CO2 capture rates on a cradle-to-gate basis. Current status: pilot demonstrations at commercial scale in Europe and North America. Estimated CO2 reduction: 90 to 95% of total plant emissions when combined with electric calcination or post-combustion CCS. Technology readiness level: TRL 7 for electric heat pump integration; TRL 5-6 for direct electric solvent regeneration.
Electrification Transition Pathway — The Five-Stage Technology Deployment Sequence
The transition from fossil fuel-dependent cement production to fully electrified cement manufacturing follows a five-stage deployment sequence that aligns technology maturity, capital investment capacity, and carbon reduction targets. Each stage builds on the infrastructure of the previous stage and delivers measurable CO2 reductions that can be tracked against science-based targets and reported under the GCCA sustainability framework and CDP climate change questionnaire.
Conventional vs. Electrified Cement Plant — Operating Cost and Emissions Comparison at Scale
The economic comparison between conventional fossil fuel-based cement production and fully electrified production depends on the cost of renewable electricity, the capital cost of electric kiln and H2 infrastructure, and the carbon price applied to remaining process emissions. The table below presents the operating cost and emissions profile for a 1.5 million ton per year cement plant operating under three scenarios: current conventional configuration, intermediate electrification (Stage 2 + 3), and full electrification (Stage 4 + 5). All figures in 2026 U.S. dollars.
| Cost and Emissions Category | Conventional Plant — Current Baseline | Intermediate Electrification — 2030 | Full Electrification — 2040 |
|---|---|---|---|
| Energy Cost per Ton Clinker | $18–$28/ton (coal/petcoke at $60–$100/ton plus grid electricity at $0.075–$0.12/kWh) | $22–$34/ton (renewable PPA at $0.03–$0.05/kWh plus H2 at $4–$7/kg for 30% co-firing) | $16–$26/ton (renewable PPA at $0.02–$0.04/kWh, electric kiln at 85%+ efficiency, H2 at $2–$3/kg) |
| Carbon Compliance Cost per Ton Clinker | $2–$8/ton (current U.S. tax credit and voluntary carbon market exposure; no federal carbon price) | $6–$18/ton (45Q tax credit for CCS; potential federal carbon price at $25–$50/ton CO2 by 2030) | $1–$4/ton (residual emissions at 90%+ capture rate; minimal carbon price exposure at 90%+ reduction) |
| Total CO2 Intensity (kg CO2/ton cement) | 580–650 kg/ton (GCCA benchmark range for U.S. cement plants with conventional fossil fuel-fired kilns) | 280–380 kg/ton (45–55% reduction from renewable electrical load, H2 co-firing, and electric calciner deployment) | 30–60 kg/ton (90–95% reduction from full electrification and electrified CCS; net-zero GCCA pathway alignment) |
| Capital Investment Required | $0 (current configuration baseline) | $80M–$180M (renewable generation, electrolyzer, H2 burner retrofit, electric calciner installation) | $180M–$350M cumulative (full electric kiln, H2 infrastructure, electrified CCS, grid connection upgrade) |
| Fuel Cost Volatility Exposure | High — coal and petcoke prices fluctuate 30–60% year-over-year; natural gas 40–80% seasonal volatility | Moderate — 50% of thermal energy from renewable H2 (electricity-linked pricing); 50% still fossil-exposed | Low — 90%+ of energy from renewable electricity at locked-in PPA prices; H2 cost tied to renewable electricity price |
Digital Electrification Tracking — What iFactory's Energy Monitoring and Emissions Tracking Modules Deliver
The electrification transition introduces new data categories, metric definitions, and reporting requirements that extend beyond the traditional energy and emissions tracking scope. iFactory's platform is configured to track every dimension of the electrification pathway — from renewable energy procurement to H2 production monitoring to electric kiln performance to CCS efficiency — in a unified dashboard that supports plant-level operational decisions and corporate-level sustainability reporting simultaneously.
- On-site solar and wind generation monitoring — real-time output, capacity factor, availability, maintenance status per asset
- Renewable energy certificate (REC) procurement and retirement — certificate tracking per MWh, vintage, and procurement contract
- Scope 2 emissions reporting — location-based and market-based calculation per GHG Protocol Scope 2 Guidance; dual reporting for CDP and GRI 305 disclosure
- Grid decarbonization tracking — grid emission factor trend monitoring, renewable PPA contribution to Scope 2 reduction trajectory
- Electrolyzer performance tracking — H2 production rate, specific energy consumption (kWh/kg H2), stack degradation monitoring
- H2 co-firing monitoring — H2 volumetric flow, thermal substitution rate, fossil fuel displacement, CO2 reduction per GCCA methodology
- Alternative fuel substitution tracking (biomass, TDF, waste-derived fuels) — simultaneous tracking with H2 for total thermal substitution rate
- Fuel cost comparison dashboard — per-MMBTU cost by fuel type, H2 cost vs. fossil fuel cost, carbon cost-adjusted comparison
- Electric kiln energy consumption and thermal efficiency — MWh per ton clinker, electrical-to-thermal conversion efficiency, specific heat loss monitoring
- Electric calciner performance — pure CO2 stream capture rate, calcination degree, specific energy consumption per ton CaO produced
- CO2 emissions monitoring — Scope 1 combustion and process emissions tracked separately; calcination CO2 stream quality monitored for CCS readiness
- Electrical grid integration — demand profile, peak load management, grid capacity utilization, battery storage performance if installed
- CCS capture rate monitoring — CO2 concentration in captured stream, capture efficiency against design, compressor and pipeline performance
- 45Q tax credit documentation — CO2 capture volume verified per IRS 45Q requirements, sequestration monitoring, EPA Class VI well compliance
- Net-zero pathway tracking — actual emissions vs. science-based target trajectory, CO2 reduction by technology pathway, residual emissions reporting
- GCCA sustainability reporting — energy intensity, CO2 intensity, clinker factor, thermal substitution rate, and CCS metrics reported in GCCA format
Expert Review: What Cement Industry Energy Managers Say About the Electrification Transition
I have managed energy systems at two cement plants over 18 years — a wet-process plant that was converted to dry-process in 2012 and a greenfield dry-process plant commissioned in 2019 — and the electrification discussion in the cement industry has shifted more in the last three years than in the previous 15. At the first plant, energy management meant fuel procurement optimization — choosing between coal, petcoke, and natural gas based on price differentials, managing inventory, and tracking heat consumption against design targets. The electrical side was treated as a fixed cost: the plant bought power from the grid, paid the bill, and considered the matter closed. At the greenfield plant, we included an on-site solar installation from the start — 8 MW of PV on reclaimed process land — and I can report that the financial case was compelling even before the IRA 48 ITC was factored in. We are generating electricity at $0.023 per kWh against a grid purchase price of $0.089 per kWh, and the system paid for itself in 5.2 years. The deeper lesson from that experience is that the electrification transition is not a single capital decision. It is a sequence of decisions — solar this year, wind the next, then the electrolyzer study, then the electric calciner technology selection, then the kiln replacement decision in 2035 — and each decision needs data from the decisions before it. The solar installation gave us 18 months of actual generation data that we used to size the electrolyzer. The electrolyzer feasibility study used the solar generation profile to model H2 production cost. The H2 co-firing pilot that starts next year will use the electrolyzer output. Each step depends on data from the previous step — and that data chain is the reason the electrification transition needs a digital energy management platform that tracks every technology stage in the sequence, not a spreadsheet that was designed for monthly fuel cost tracking.
— Energy and Utilities Manager, U.S. Cement Plant — 18 Years Cement Industry Energy Management — Certified Energy Manager (CEM) — Association of Energy EngineersConclusion
The electrification of cement production is not a single technology deployment — it is a 15 to 25 year system transition that will transform every energy-consuming process in the cement plant, from the kiln burning zone to the finish mill drives to the carbon capture system. The technical and economic barriers are real: electric kiln technology at TRL 5-6 needs three to five more years of pilot-scale demonstration before commercial deployment; green hydrogen at $4 to $7 per kg needs continued electrolyzer cost reduction and renewable electricity price compression to reach economic viability at cement plant scale; and full electrification capital requirements of $180 million to $350 million per plant require carbon pricing mechanisms and tax credit structures that make the investment case work within a cement company's capital allocation framework.
What the cement industry cannot afford is to wait for each technology to reach full commercial maturity before building the data infrastructure that will manage the transition. The renewable PPA decisions of 2025 to 2027 will determine the electrical load baseline for the 2030 H2 production stage. The solar and wind generation data collected today will inform the electrolyzer sizing decision of 2028. The H2 co-firing pilot data of 2027 to 2029 will validate the full H2 conversion economics of 2032. iFactory's Energy Monitoring and Emissions Tracking modules give cement plant energy and sustainability teams the digital infrastructure to track every stage of the electrification transition — from current fossil fuel baseline through renewable integration and H2 co-firing to full electrification and CCS — ensuring that each technology deployment decision is informed by actual operational data from the stage that precedes it. Book a Demo to see how iFactory's platform tracks the electrification pathway for your plant's energy profile, technology roadmap, and net-zero targets.
Frequently Asked Questions
Yes. iFactory tracks on-site generation (solar PV, wind) in real time through inverter and meter integration, and off-site PPAs through certificate management — calculating location-based and market-based Scope 2 emissions per GHG Protocol Scope 2 Guidance for dual reporting under GRI 305 and CDP.
iFactory monitors electrolyzer performance (H2 production rate, kWh/kg specific energy consumption, stack condition) and kiln H2 injection (flow rate, thermal substitution rate, fossil fuel displacement). CO2 reduction from H2 co-firing is calculated per GCCA methodology and reported separately from other emission reduction activities.
Yes. iFactory tracks CO2 capture volume, injection volume, and sequestration monitoring data in the format required for IRS 45Q credit qualification — including the 12-year capture period tracking, annual verification documentation, and EPA Class VI well compliance monitoring required for the tax credit.
iFactory's energy monitoring and emissions tracking modules for electrification pathway management are typically deployed in 3 to 6 weeks — including energy meter integration, renewable generation sensor connection, H2 production monitoring setup, emissions calculation configuration, and GCCA and CDP reporting template setup. Book a Demo for a site-specific scope and timeline.
Yes. iFactory's scenario modeling module compares capital cost, operating cost, and CO2 reduction outcomes across multiple electrification pathways — supporting investment decisions with actual plant-level data rather than industry averages. Scenarios can include varying renewable PPA prices, H2 cost projections, carbon pricing trajectories, and tax credit scenarios.