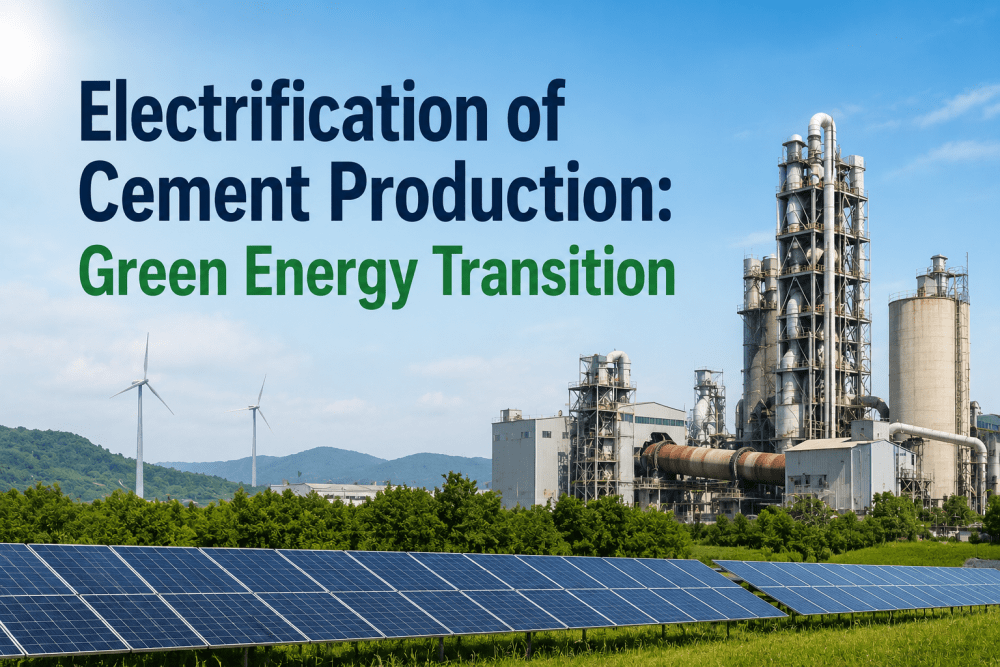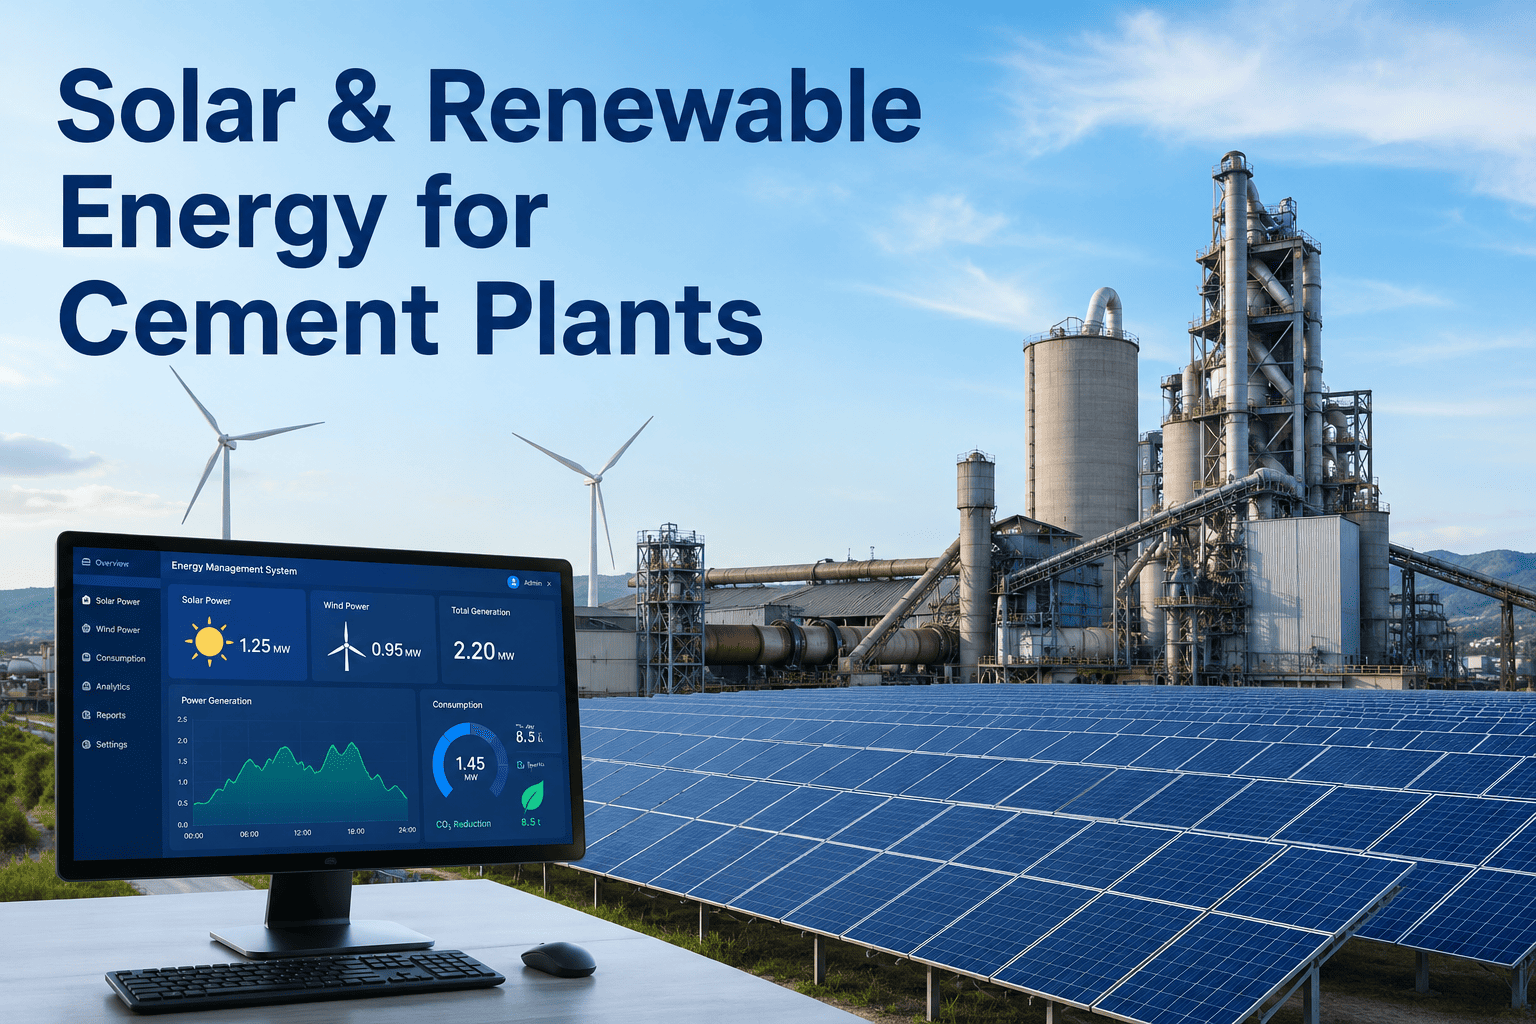
The cement industry faces an unprecedented dual challenge: soaring energy costs and escalating regulatory pressure to decarbonize. With thermal and electrical energy accounting for 30-40% of total production costs, shifting to renewable energy sources such as solar, wind, and biomass is no longer a green ideal but a strategic economic imperative. This comprehensive guide provides a deep-dive technical analysis of captive power economics, open access regulations, and grid parity for cement plants. We explore the financial models, operational integration strategies, and regulatory frameworks that enable cement manufacturers to achieve energy independence and cost predictability. Whether you are a plant manager evaluating a solar PV installation or a CTO assessing wind turbine viability, this resource delivers the analytical rigor required for informed decision-making. Book a Demo to explore how iFactory's AI-driven energy management platform can optimize your renewable asset performance.
Transform Your Cement Plant's Energy Future
Achieve energy cost reduction of 25-35% with a strategic renewable energy mix. Our experts help you navigate open access and grid parity.
Captive Power Economics: The Financial Case for Renewables in Cement
Captive power generation using renewable sources offers cement plants a hedge against volatile grid tariffs and fossil fuel prices. The levelized cost of electricity (LCOE) for solar PV has dropped by 85% over the past decade, making it competitive with coal-based captive power in many regions. For a typical 1 MW solar installation, the LCOE ranges from $0.03 to $0.05 per kWh, compared to $0.08 to $0.12 for grid power. Wind energy, with capacity factors of 25-35%, delivers LCOE between $0.04 and $0.06 per kWh. Biomass power, while slightly higher at $0.06 to $0.10 per kWh, offers the advantage of dispatchability and waste heat recovery integration. The payback period for a solar captive plant is typically 4 to 6 years, with an internal rate of return (IRR) exceeding 15% in high-tariff states. However, the economic viability depends on factors such as plant load factor, open access charges, and renewable energy certificate (REC) revenues. A comprehensive financial model must incorporate capital subsidies, accelerated depreciation benefits, and power purchase agreement (PPA) structures. iFactory's analytics platform can simulate these scenarios in real-time, enabling you to optimize your captive power portfolio.
Solar PV
LCOE: $0.03–0.05/kWh
Capacity Factor: 18-22%
Payback: 4-6 years
IRR: 15-20%
Suitable for: Daytime baseload, roof & land
Wind Energy
LCOE: $0.04–0.06/kWh
Capacity Factor: 25-35%
Payback: 5-7 years
IRR: 12-18%
Suitable for: High wind zones, hybrid with solar
Biomass Power
LCOE: $0.06–0.10/kWh
Capacity Factor: 80-90%
Payback: 6-8 years
IRR: 10-15%
Suitable for: Waste heat recovery, baseload
Step-by-Step Integration of Renewables in Cement Operations
Energy Audit & Load Profiling
Conduct a detailed energy audit to map hourly and seasonal load curves. Identify baseload and peak demand patterns. For a typical integrated cement plant, electrical load varies from 80-100 MW, with peaks during clinker grinding. Use iFactory's AI-driven load forecasting to pinpoint opportunities for renewable integration.
Resource Assessment & Site Selection
Evaluate solar irradiance, wind speed data (at least one year of 10-minute intervals), and biomass feedstock availability. For solar, consider land availability (5-7 acres per MW) and grid connectivity. Wind requires open terrain with average speeds >6 m/s at hub height. Biomass needs consistent supply chain of agricultural residues or municipal solid waste.
Financial Modeling & PPA Structuring
Build a discounted cash flow model incorporating capital costs, O&M expenses, debt service, and tax benefits. Compare with grid tariff escalation rates (typically 5-7% annually). Structure a PPA with a third-party developer to avoid capital outlay, or opt for a build-own-operate model. REC revenues can add $0.01-0.02 per kWh.
Regulatory Compliance & Open Access
Navigate state-specific open access regulations. In India, for example, open access is allowed for captive consumers with minimum 26% equity in the generating company. File applications with the state electricity regulatory commission. Ensure compliance with grid code requirements for injection and drawal.
System Design & Integration
Design the renewable system with inverters, transformers, and SCADA integration. For solar, consider fixed-tilt vs. single-axis tracking. Wind turbines require foundation design and grid synchronization. Biomass plants need fuel handling and ash management. Integrate with existing captive power plant (CPP) for hybrid operation.
Commissioning & Performance Monitoring
Conduct performance tests for capacity factor, specific yield, and availability. Use IoT sensors and AI analytics for real-time monitoring. iFactory's platform provides predictive maintenance alerts, performance benchmarking, and automated REC generation.
Open Access Regulations: Unlocking Grid Parity for Cement Plants
Open access allows cement plants to procure renewable energy directly from generators, bypassing the distribution company. However, the regulatory landscape is complex and varies by state. Key components include: (a) Open access charges: These include wheeling charges, cross-subsidy surcharge, and additional surcharge. In progressive states like Gujarat and Tamil Nadu, these charges are low (0.5-1.5 Rs/kWh), making open access highly attractive. (b) Banking provisions: Some states allow banking of excess energy for up to 12 months, while others restrict to monthly settlement. (c) REC mechanism: Solar and non-solar RECs provide additional revenue. The price of RECs has ranged from Rs 1,000 to Rs 3,000 per MWh. (d) Group captive model: Multiple industries can jointly own a renewable energy plant, reducing per-unit costs. For cement plants with multiple locations, a group captive model can optimize generation across sites. iFactory's regulatory intelligence module tracks changes in open access policies across 28 states, providing automated compliance alerts.
| State | Wheeling Charge (Rs/kWh) | Cross-Subsidy Surcharge (Rs/kWh) | Banking Period | REC Eligibility |
|---|---|---|---|---|
| Gujarat | 0.50 | 0.75 | 12 months | Yes |
| Tamil Nadu | 0.60 | 1.00 | 6 months | Yes |
| Maharashtra | 0.80 | 1.50 | Monthly | Yes |
| Rajasthan | 0.70 | 1.20 | 3 months | Yes |
| Andhra Pradesh | 0.90 | 1.80 | Monthly | Yes |
Grid Parity Analysis: When Does Renewable Energy Become Cheaper Than Grid Power?
Grid parity is achieved when the LCOE of renewable energy is equal to or less than the retail grid tariff. For cement plants, the grid tariff is typically in the range of $0.08 to $0.12 per kWh, with annual escalation of 5-7%. Solar PV has already achieved grid parity in most Indian states, with LCOE of $0.03-0.05 per kWh. Wind energy is at parity in high-wind states like Tamil Nadu and Gujarat. Biomass power is approaching parity, especially when waste heat recovery is integrated. However, the effective cost of renewable energy for a cement plant includes open access charges, which can add 20-30% to the LCOE. Therefore, the true grid parity point is when renewable LCOE + open access charges ≤ grid tariff. For a typical plant in Gujarat, the effective cost of solar via open access is $0.05-0.06 per kWh, compared to grid tariff of $0.10 per kWh, resulting in savings of 40-50%. iFactory's grid parity calculator uses real-time tariff data and your plant's load profile to determine the optimal renewable mix.
Solar Grid Parity
LCOE: $0.03-0.05/kWh
Effective cost with OA: $0.05-0.06/kWh
Grid tariff: $0.08-0.12/kWh
Savings: 40-50%
Wind Grid Parity
LCOE: $0.04-0.06/kWh
Effective cost with OA: $0.06-0.08/kWh
Grid tariff: $0.08-0.12/kWh
Savings: 25-35%
Biomass Grid Parity
LCOE: $0.06-0.10/kWh
Effective cost with OA: $0.08-0.12/kWh
Grid tariff: $0.08-0.12/kWh
Savings: 0-20%
Optimize Your Renewable Energy Mix Today
Our AI platform provides real-time LCOE comparisons, open access charge calculators, and REC revenue optimization. Start saving on energy costs now.
Biomass Power: A Dispatchable Renewable Solution for Cement Plants
Biomass power offers a unique advantage over solar and wind: dispatchability. With a capacity factor of 80-90%, biomass plants can provide baseload power, reducing the need for battery storage. For cement plants, the waste heat from the clinker cooling process can be integrated with a biomass boiler to improve overall efficiency. Common biomass feedstocks include rice husk, sugarcane bagasse, and municipal solid waste (MSW). The fuel cost is typically $20-40 per ton, with an energy content of 3,000-4,000 kcal/kg. A 5 MW biomass plant requires about 60-80 tons of fuel per day. The capital cost is $1.5-2.5 million per MW, higher than solar but lower than wind with storage. The payback period is 6-8 years, with an IRR of 10-15%. However, challenges include fuel supply chain reliability, ash handling, and emissions compliance. iFactory's supply chain optimization module can forecast fuel availability and optimize procurement.
Hybrid Renewable Systems: Combining Solar, Wind, and Biomass for 24/7 Power
A hybrid renewable system that combines solar, wind, and biomass can achieve higher capacity factors and reduce the need for grid backup. For example, solar generates during the day, wind peaks in the evening and night, and biomass fills the gaps. The optimal mix depends on the plant's load profile and local resource availability. A typical hybrid system for a cement plant might consist of 10 MW solar, 5 MW wind, and 3 MW biomass, with a combined capacity factor of 40-50%. The levelized cost of the hybrid system is $0.05-0.07 per kWh, which is still competitive with grid power. The capital investment is $20-30 million, with a payback period of 5-7 years. iFactory's hybrid optimizer uses machine learning to determine the optimal sizing and dispatch strategy based on weather forecasts and load predictions.
Renewable Energy Certificates (RECs): An Additional Revenue Stream
RECs are tradable certificates that represent the environmental attributes of renewable energy generation. In India, RECs are traded on power exchanges and currently priced at Rs 1,000-3,000 per MWh for solar and Rs 1,500-4,000 per MWh for non-solar. For a 10 MW solar plant generating 15,000 MWh annually, REC revenue can add $0.01-0.02 per kWh, improving the IRR by 2-3%. However, the REC mechanism is subject to regulatory changes and price volatility. Cement plants can also benefit from carbon credits under the Clean Development Mechanism (CDM) or voluntary carbon markets. A typical cement plant reducing 50,000 tons of CO2 annually can earn $0.5-1 million from carbon credits. iFactory's REC and carbon credit tracking module automates the documentation and trading process.
Case Study: 10 MW Solar Captive Plant at a Cement Facility in Gujarat
A leading cement manufacturer in Gujarat installed a 10 MW solar PV plant under the group captive model. The plant generates 16,000 MWh annually, meeting 20% of the plant's daytime load. The capital cost was $8 million, with 30% capital subsidy under the state renewable energy policy. The LCOE is $0.04 per kWh, compared to the grid tariff of $0.10 per kWh, resulting in annual savings of $960,000. The payback period is 5.5 years, with an IRR of 18%. The plant also earns REC revenue of $160,000 per year. The project was commissioned in 9 months, with minimal disruption to cement production. iFactory's monitoring platform tracks the plant's performance, including specific yield, capacity factor, and availability, ensuring optimal operation.
Frequently Asked Questions
What is the typical payback period for a solar captive plant in a cement plant?
The payback period for a solar captive plant in a cement plant typically ranges from 4 to 6 years, depending on factors such as capital cost, solar irradiance, open access charges, and REC revenues. In high-tariff states like Gujarat and Maharashtra, the payback can be as low as 4 years. The internal rate of return (IRR) is usually between 15% and 20%. To get a precise calculation for your plant, use iFactory's financial modeling tool. Book a Demo for a personalized analysis.
How does open access work for cement plants in India?
Open access allows cement plants to purchase renewable energy directly from generators, paying only the wheeling charges and cross-subsidy surcharge to the distribution company. The process involves registering with the state electricity regulatory commission, filing an application for open access, and signing a power purchase agreement (PPA) with a generator. The charges vary by state, with progressive states like Gujarat and Tamil Nadu offering low charges. iFactory's regulatory intelligence module provides up-to-date information on open access policies. Contact Support for assistance with open access applications.
Can a cement plant run entirely on renewable energy?
Technically, a cement plant can run entirely on renewable energy, but it requires a hybrid system with storage to ensure 24/7 power availability. Solar and wind alone are intermittent, so a combination with biomass or battery storage is needed. The cost of such a system is higher than grid power, but with falling battery prices and REC revenues, it is becoming economically viable. Many cement plants are targeting 50-70% renewable energy penetration by 2030. iFactory's hybrid optimization tool can help design a 100% renewable system. Book a Demo to explore the possibilities.
What are the main challenges in integrating renewable energy into cement plant operations?
The main challenges include intermittency of solar and wind, land availability for solar panels, grid connectivity issues, and regulatory compliance. Financial challenges include high upfront capital costs and uncertainty in REC prices. Operational challenges include integrating renewable power with existing captive diesel or coal plants. iFactory's AI platform addresses these challenges through predictive load forecasting, real-time monitoring, and automated compliance. Contact Support for a detailed discussion on overcoming these challenges.
How can iFactory help in optimizing renewable energy for cement plants?
iFactory's AI-driven platform provides end-to-end solutions for renewable energy integration, including energy audit and load profiling, financial modeling, regulatory compliance tracking, real-time performance monitoring, and predictive maintenance. Our platform can simulate different renewable energy scenarios, optimize the hybrid system sizing, and automate REC and carbon credit trading. With iFactory, cement plants can achieve 25-35% reduction in energy costs and 15-20% improvement in asset utilization. Book a Demo to see the platform in action.
Ready to Transform Your Cement Plant's Energy Strategy?
Join industry leaders who have reduced energy costs by 30% with iFactory's renewable energy optimization platform. Take the first step today.