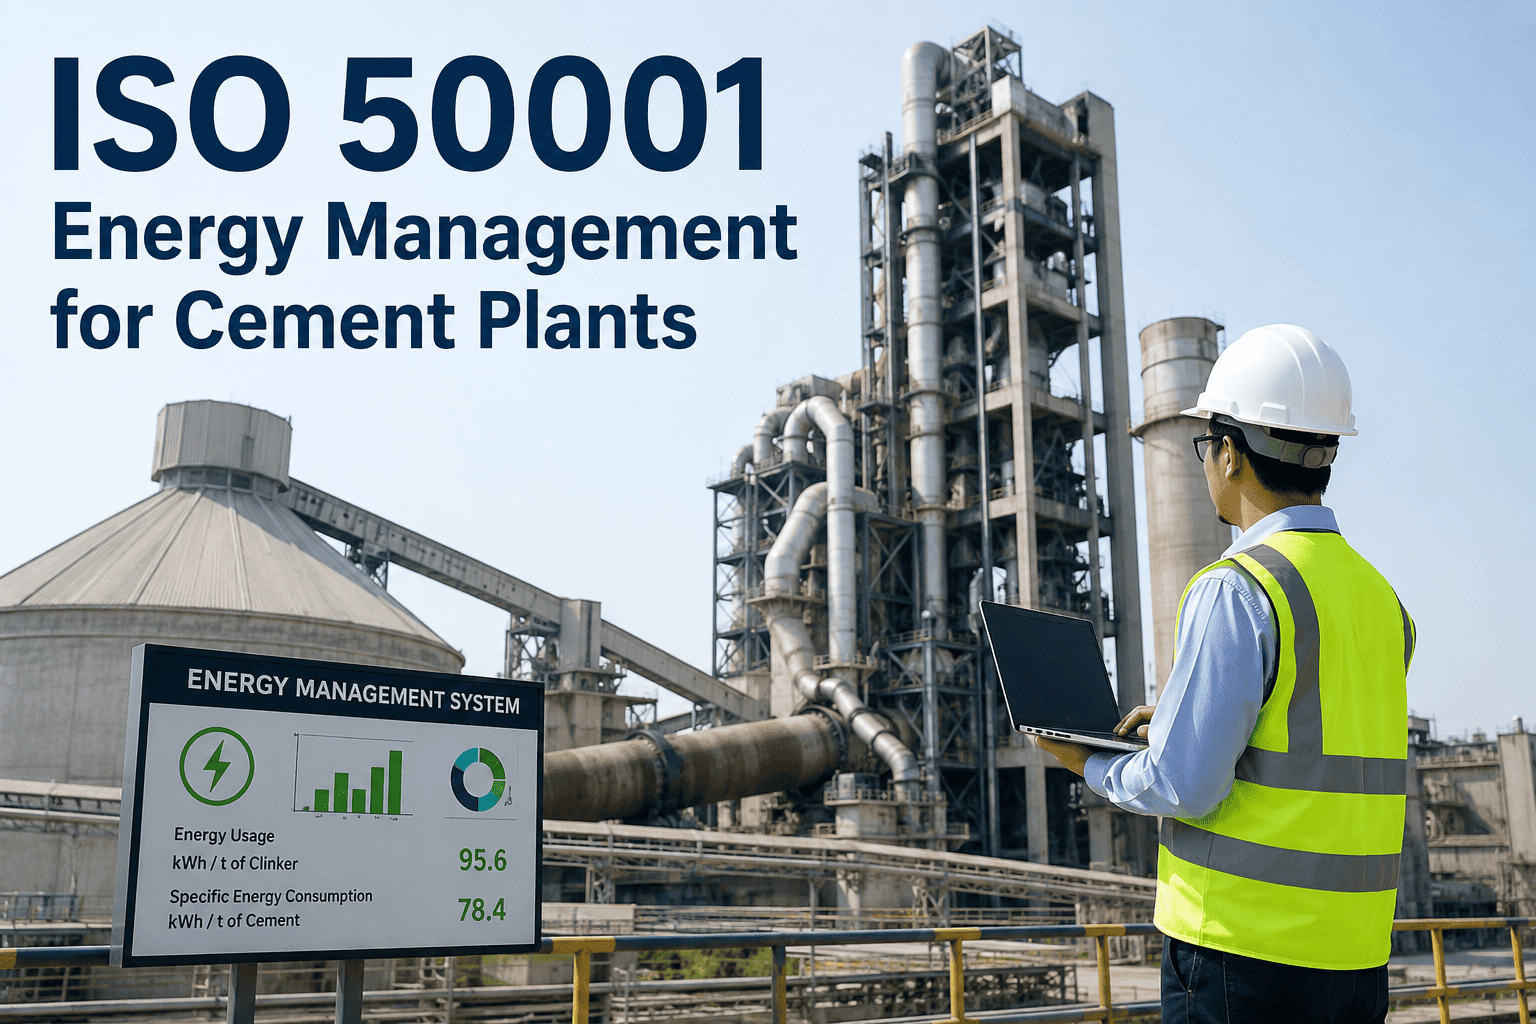
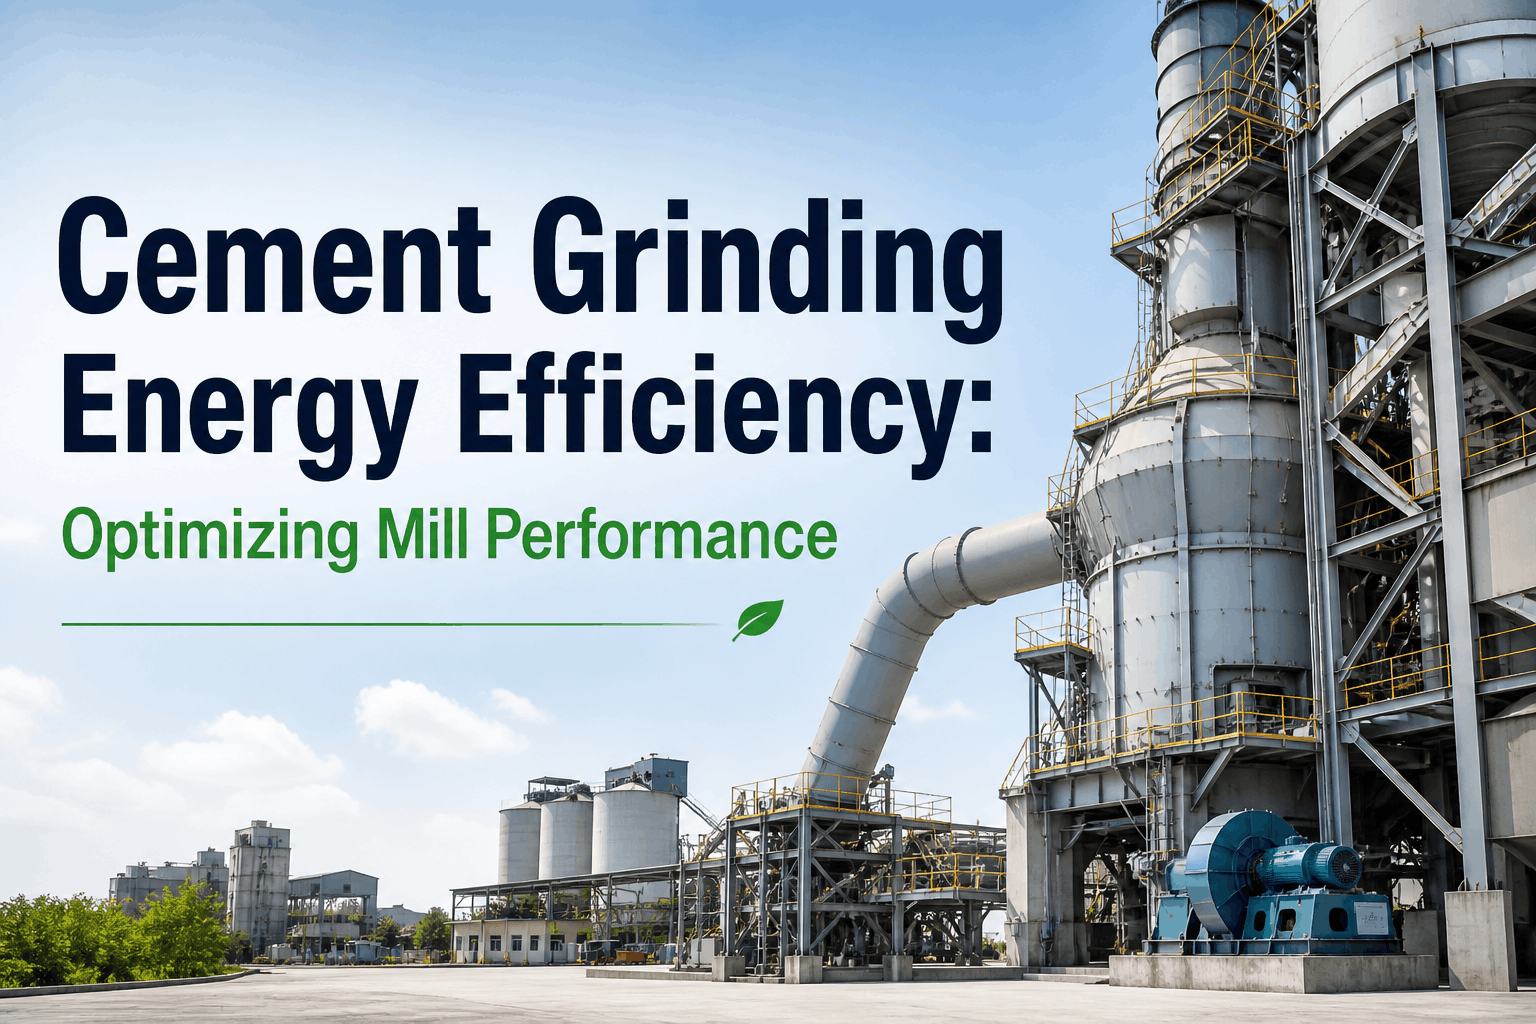
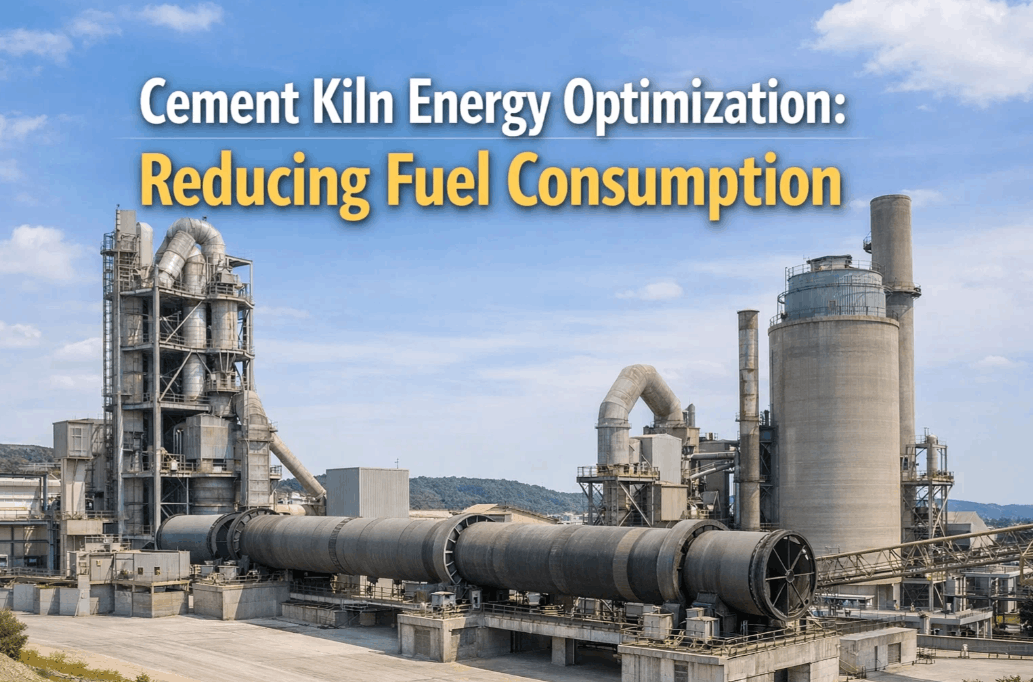
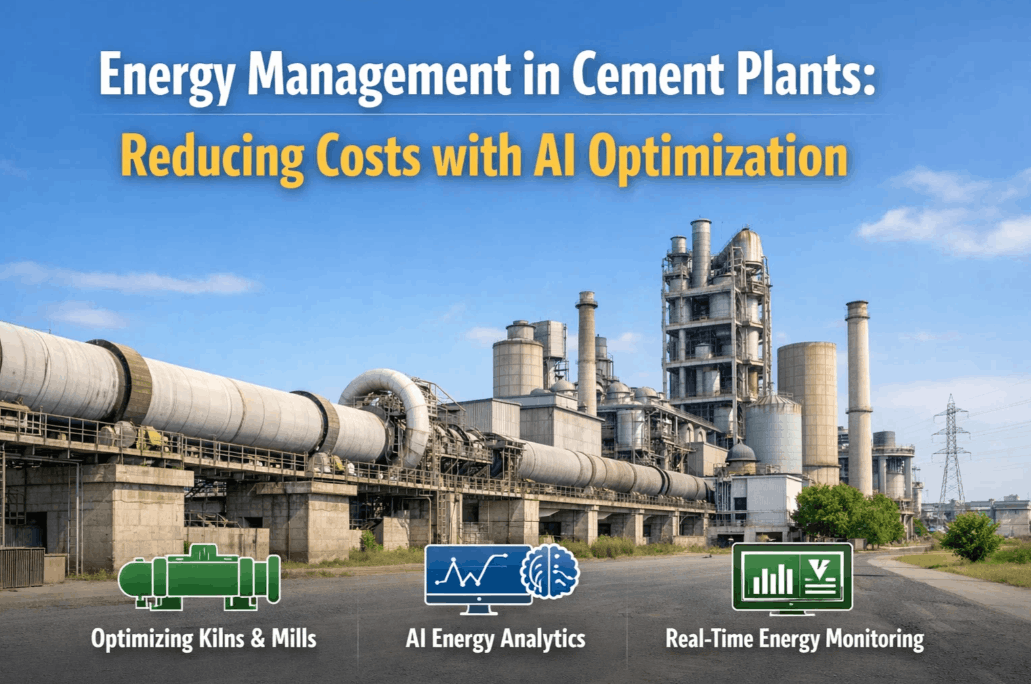
In the energy-intensive world of cement production, energy management has shifted from a fixed operational cost into a mission-critical performance lever. Electricity accounts for up to 15% of the total cost of cement manufacture, with the grinding process alone consuming nearly 70% of a facility's power. Yet, most plants still manage their energy footprint through retrospective utility bills, manual meter readings, and reactive load shedding. The gap between theoretical energy efficiency and actual kWh/ton performance is where high electricity tariffs, peak demand penalties, and operational waste breed. Understanding energy analytics requirements for cement equipment is the foundation of a proactive, data-driven cost reduction programme. If you want to see how leading cement manufacturers close this gap with real-time energy intelligence, you can book a demo of our energy monitoring platform today.
Is Your Cement Plant Paying Too Much for Every Ton of Clinker?
Deploy real-time SEC monitoring, automated peak-demand alerts, and mill-loading optimization — all in one unified energy intelligence platform.
What Energy Analytics Means for Cement Plant Cost Reduction
Energy Analytics in cement manufacturing is the science of correlating real-time power consumption with production throughput (kWh/ton). Within cement operations, energy analytics extends this beyond simple metering: it continuously captures data from mills, fans, and crushers to verify that efficiency parameters are being met in real time. For manufacturers operating in high-tariff markets, the requirements of a Specific Energy Consumption (SEC) programme are non-negotiable. Modern efficiency frameworks mandate documented load-shifting, peak demand management, and power quality records — and the volume of data required makes manual monitoring systems structurally inadequate.
Modern energy intelligence platforms address this by connecting directly to plant assets — Vertical Roller Mills (VRMs), ID fans, clinker coolers, and primary crushers — and delivering continuous SEC data that is actionable by design. The shift from reactive energy tracking to proactive energy analytics is not just a cost-saving measure; it is a structural improvement in how cement manufacturers control their most volatile operational expense. You can book a demo to explore how real-time energy monitoring works across different cement asset categories.
Mill Loading Optimization
Target the highest energy consumer. Automatically correlate mill feed rates and separator speeds with real-time kWh draw to identify the optimal "Sweet Spot" for maximum throughput at minimum energy.
Peak Demand Management
Monitor total plant load against utility contract thresholds. Receive automated alerts before crossing peak-demand limits, allowing for non-critical cycle adjustments that prevent massive financial penalties.
Fan Power Optimization
ID fans and cooler fans account for up to 20% of power. Analytics detect when air-flow leakage or dampener inefficiencies are forcing fans to over-consume, enabling immediate mechanical correction.
SEC Benchmarking (kWh/ton)
Moving beyond total kWh. The platform calculates SEC per batch and per grade, allowing you to identify which products are disproportionately expensive to manufacture from an energy perspective.
Load Shifting Strategy
Automate the scheduling of high-energy processes (like cement grinding) during off-peak hours. The platform integrates with utility tariff structures to maximize cost recovery every single day.
Power Quality Analytics
Detect harmonics, voltage sags, and power factor issues that damage heavy motors. Real-time monitoring protects your kiln and mill drives from the hidden costs of poor electrical health.
Cement Plant Energy Requirements by Category: Industry Benchmarks
Not all cement assets carry the same energy burden. The potential for savings varies significantly based on the asset's contribution to the total load and its amenability to digital optimization. The table below provides a benchmark overview of energy share and savings potential for a standard 1MTA cement plant. For any facility where energy management is being formalised, understanding this per-asset ROI is essential before deploying a monitoring platform. To build a specific energy configuration for your plant, you can book a demo with our engineering team.
| Asset Category | Plant Energy Share | Savings Potential | Primary Strategy | Efficiency Risk |
|---|---|---|---|---|
| Cement Grinding (Finish Mill) | 35–40% | 12–18% | Load Shifting / Feed Opt. | Critical |
| Raw Material Grinding | 25–30% | 10–15% | Peak Shaving / Moisture Opt. | Critical |
| Kiln ID & Cooling Fans | 18–22% | 8–12% | VFD Optimization / Leak Detect | High |
| Primary Crusher | 4–6% | 5–8% | Throughput Stabilization | Medium |
| Compressors & Auxiliaries | 5–8% | 20–25% | Leak Management / Pressure Opt. | High |
| Packing & Dispatch | 2–4% | 5% | Standby Management | Low |
These benchmarks represent standard dry-process cement plant profiles and should be validated against your specific equipment age and VFD penetration. To build an energy roadmap for your facility, you can book a demo with our energy specialists.
How Energy Intelligence Architecture Works in Cement Production
The architecture of a robust energy management programme operates across five interconnected layers — from the smart meter at the substation to the corporate sustainability report. Understanding how these layers interact is essential for operations directors who are evaluating whether their current manual tracking is fit for modern carbon and cost demands. Leading cement manufacturers who have implemented data-driven energy programmes consistently report faster cost recovery, fewer peak penalties, and higher confidence in their SEC targets. The cascade of value runs from the heavy motor layer upward.
Sub-Meter & Sensor Integration
Smart meters and power quality analyzers at each critical motor (Mills, Fans, Kiln Drives) transmit real-time kWh and electrical health data directly into the platform, eliminating manual meter reading errors.
Production Linkage Engine
The platform ingest throughput data from the SCADA/DCS system, automatically correlating kWh draw with tonnes produced. This creates the "Golden SEC" baseline for every clinker grade and cement type.
Peak Demand Alerting
Real-time plant load is compared against utility contract limits. If the load approaches a peak threshold, the platform triggers automated alerts — enabling the control room to postpone non-critical grinding until the peak period passes.
Process Optimization Insights
AI identifies efficiency drifts. If the cement mill's kWh/ton starts to rise despite stable feed, the platform flags potential issues like liner wear or diaphragm clogging before they cause significant energy waste.
Executive ROI Reporting Layer
All energy savings, tariff recoveries, and carbon footprint reductions are compiled into structured reports — providing the financial evidence needed to justify further efficiency investments like VFDs or WHR units.
— Operations Director, Regional Cement Group
Energy Requirements for Cement Assets: What Digital Intelligence Delivers
Energy requirements form the most volatile component of cement plant operating costs. Every heavy motor requires defined efficiency thresholds, a load-shifting schedule, and a power quality baseline — all of which must be managed to maintain competitiveness. Traditional manual energy logs fail this requirement systematically: records are retrospective, peak demand events are missed until the bill arrives, and efficiency drifts are invisible. Digital energy management addresses all three failure modes. High-consumption events are flagged in real-time, load-shifting is data-driven, and SEC is traceable per batch — creating a transparent, cost-efficient energy culture that satisfies both financial and sustainability goals. You can book a demo to see how real-time energy tracking integrates with your existing plant infrastructure.
Utility contracts penalize the highest usage window of the month. Digital alerting provides the 15-minute lead time needed to shed load or pause grinding, preventing thousands of dollars in peak-demand surcharges.
Grinding mills consume the bulk of power. Digital analytics correlate energy with throughput, identifying the feed-rate 'Goldilocks' zone where the motor is most efficient per ton of cement produced.
Variable Frequency Drives (VFDs) are significant investments. Digital management tracks their real-time performance, verifying that the intended 15-30% energy savings are actually being achieved at the fan level.
ESG reporting requires energy data linked to carbon output. Digital platforms create this link automatically, providing the data needed for CBAM compliance and sustainability certification without manual calculation.
Manual vs. Digital Energy Management: The Performance Gap
The performance difference between manual energy tracking and a digital energy intelligence programme is not marginal — it is decisive. Facilities that have transitioned from monthly bills to real-time SEC monitoring consistently report measurable improvements across every financial and environmental dimension. The comparison below helps energy managers and plant directors articulate the business case for investment to corporate leadership teams. When expressed in terms of tariff recovery, peak penalty avoidance, and SEC reduction, the financial case for digital energy management is typically absolute. To understand what a transition would look like for your specific facility, you can book a demo with our energy team.
| Energy Performance Dimension | Manual / Retrospective | Digital Energy Intelligence | Operational Gain |
|---|---|---|---|
| Peak Demand Penalty Mitigation | Zero (detected after billing) | 99% (real-time prevention) | Critical |
| SEC Tracking Granularity | Plant-wide / Monthly | Asset-specific / Per Ton | High |
| Load Shifting Efficiency | Ad-hoc / Manual | Automated / Tariff-aligned | High |
| Efficiency Drift Detection | Weeks (based on production loss) | Hours (based on kWh/ton shift) | High |
| Carbon Footprint Accuracy | Estimated / Generic | Measured / Precise | Medium |
| Energy Cost Recovery ROI | Long (indirect savings) | Short (direct penalty avoidance) | Critical |
Stop Guessing Your Energy Costs. Start Controlling Your Specific Consumption.
Our energy intelligence platform gives cement manufacturers the real-time visibility and automated cost-recovery tools needed to reduce kWh/ton and eliminate peak-demand penalties.
Frequently Asked Questions: Energy Management for Cement Plants
What is Specific Energy Consumption (SEC) and why does it matter?
Specific Energy Consumption (SEC) is the amount of electricity required to produce one ton of cement or clinker (kWh/ton). Unlike total kWh, SEC accounts for production volume, making it the only accurate way to measure true energy efficiency. Reducing SEC directly lowers the variable cost of cement, making the plant more competitive in high-energy-cost markets.
How does the platform help avoid peak-demand penalties?
The platform monitors total plant load in real-time and compares it to your utility contract's peak thresholds. If the load is projected to cross the limit within the next 15-30 minutes, an automated alert is sent to the control room. This allows operators to temporarily shed non-critical load (like water pumps or secondary crushers) or pause a grinding mill until the peak window passes.
Can we implement energy monitoring without replacing our old meters?
In many cases, yes. Our platform can ingest data from existing SCADA/DCS systems or legacy smart meters. If meters aren't present at the asset level, we can deploy non-intrusive IoT sensors that clip onto power cables, providing the granular data needed for SEC tracking without a major electrical shutdown.
What is load shifting and how much can it save our cement plant?
Load shifting is the practice of moving energy-intensive processes (specifically cement grinding) from high-tariff daytime hours to lower-tariff nighttime hours. Depending on your regional utility rates, load shifting can reduce the cost of grinding by 20–40% without changing the total energy consumed.
How does energy management support our carbon reduction (ESG) goals?
Energy reduction is the primary driver of Scope 2 emission reduction. Our platform automatically converts kWh savings into CO2-equivalent reductions, providing verified data for sustainability reports and regulatory frameworks like the EU CBAM (Carbon Border Adjustment Mechanism).
Which cement asset provides the fastest ROI for energy optimization?
Grinding mills (Raw and Finish) typically provide the fastest ROI. Because they represent the largest portion of the load, even a small 5% efficiency gain through feed-rate optimization or load shifting results in massive monthly financial savings.
How long does it take to see the first energy savings?
Savings from peak-demand avoidance are often seen within the first month. Process optimization savings (like mill SEC reduction) typically materialize within 3–4 months as the AI baselines the 'Golden SEC' and starts surfacing feed-optimization insights.