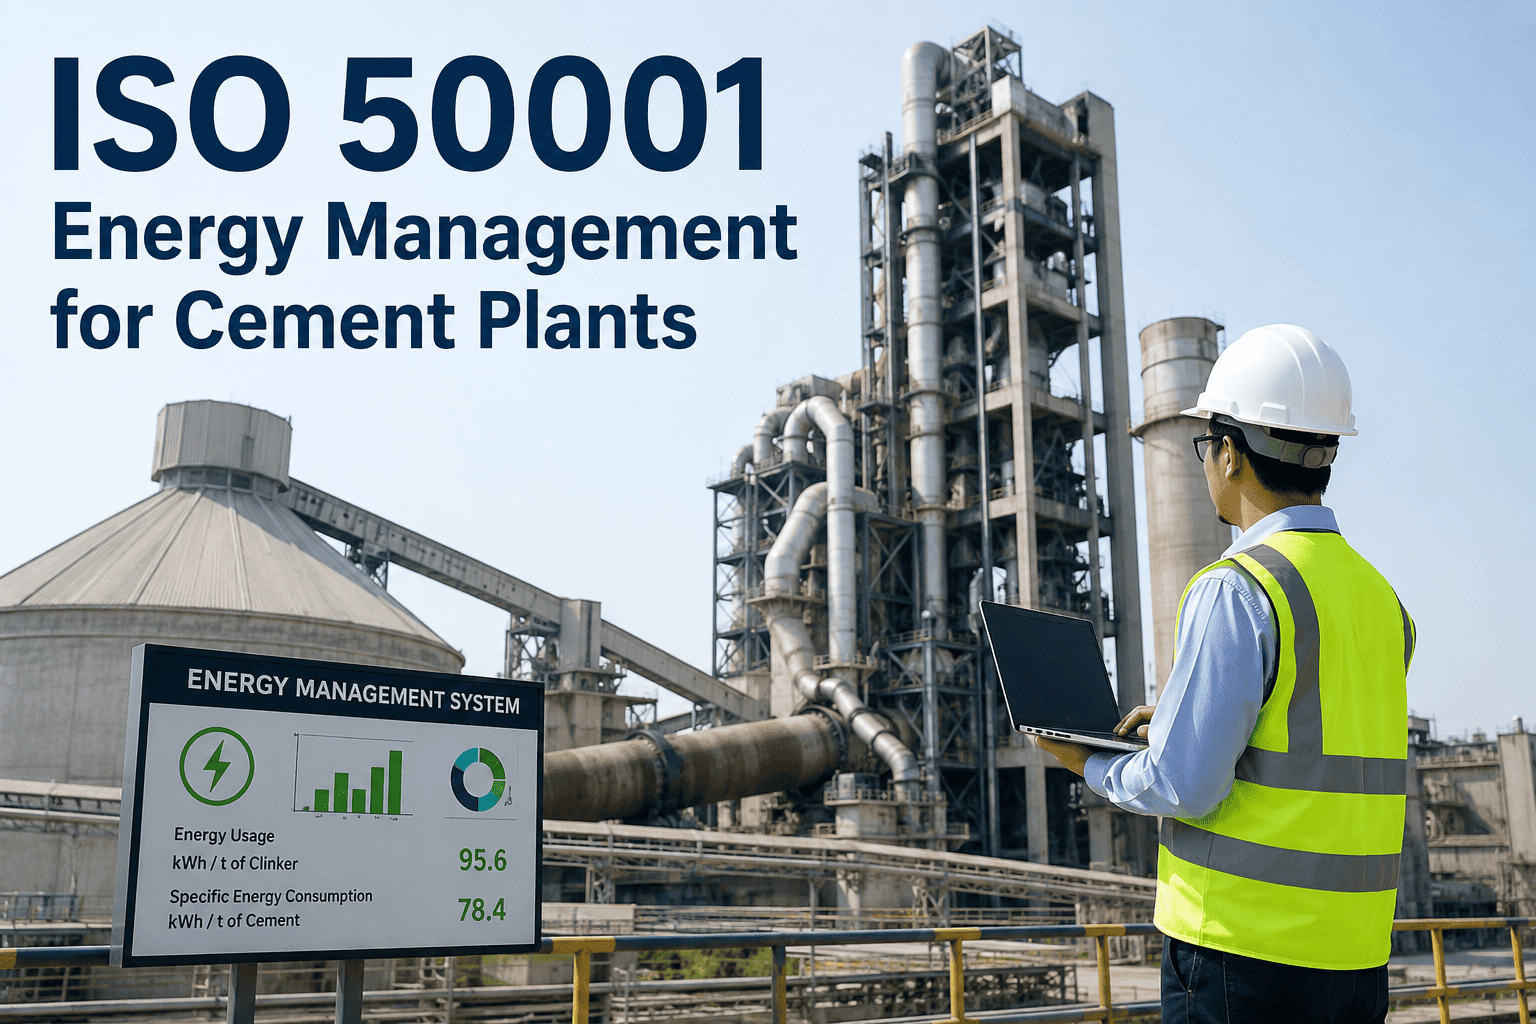
Most cement plants already track energy consumption in some form — meter readings on a spreadsheet, a monthly fuel report, maybe a dashboard nobody outside the energy manager's office ever opens. ISO 50001 asks for something structurally different: a documented, auditable system that ties every energy figure back to a fixed baseline, a defined performance indicator, and a continuous improvement cycle that keeps running long after the certificate is issued. That distinction is exactly where most implementations stall, because building a baseline and selecting energy performance indicators that will survive an external auditor's questions takes more rigor than the spreadsheet most plants started with. Reliability and sustainability teams who want to see what audit-ready EnPI tracking actually looks like on a live kiln line can book a demo before their next internal review.
Turn Your ISO 50001 EnMS From a Spreadsheet Into a System
iFactory continuously tracks energy baseline, EnPI trend, and significant energy use data across kiln, grinding, and compressed air systems, generating the audit trail a certification body actually wants to see.
The Plan-Do-Check-Act Cycle Behind Every EnMS
ISO 50001 is built on the same Plan-Do-Check-Act structure used in ISO 9001 and ISO 14001, which is good news for any cement plant that already holds one of those certifications, since the management review process, document control, and internal audit infrastructure largely transfer across. What is specific to ISO 50001 is that every stage of that cycle has to be anchored in quantified energy data rather than general process controls — the plan has to be built on a defined baseline, the checking has to compare live EnPI trends against that baseline, and the acting has to produce documented, measurable improvement rather than a general statement of intent. Plants that already run a mature ISO 9001 or ISO 14001 system often underestimate how much extra rigor this data requirement adds, because the management-system scaffolding feels familiar while the underlying energy data discipline is a genuinely new muscle to build.
Identifying the Significant Energy Uses on Your Plant
The energy review at the heart of clause 6.3 is not a request to catalogue every motor in the plant — it is a request to identify which uses actually drive the majority of consumption and deserve dedicated management controls. In a typical cement plant, a small number of process areas account for the overwhelming share of both thermal and electrical energy, and getting this list right is what determines whether the rest of the EnMS is built around the variables that actually matter or scattered thin across dozens of minor loads that will never move the needle on a certification audit. A common mistake in first-time implementations is treating every metered asset as equally significant, which produces an energy review that is technically complete but practically useless for prioritizing where improvement effort and capital should actually go.
| Significant Energy Use | Energy Type | Typical Share of Plant Total | Common EnPI |
|---|---|---|---|
| Kiln System (Firing & Preheater) | Thermal | Largest single thermal load in the plant | kcal/kg or MJ/t clinker |
| Raw Mill Grinding | Electrical | Major share of grinding electrical load | kWh/t raw meal |
| Finish (Cement) Mill | Electrical | Largest single electrical load in most plants | kWh/t cement |
| Compressed Air & Fan Systems | Electrical | Frequently underestimated support load | kWh/Nm³ or specific power |
Building a Baseline and EnPI That Survive an Audit
Clause 6.5 requires the energy baseline to be built from at least twelve months of data so that seasonal variation, production mix, and operating patterns are all represented rather than a snapshot that happens to flatter the plant. Once established, that baseline becomes the fixed denominator against which every future EnPI reading is measured, and it should only be recalculated when a genuine structural change — a major capital upgrade, a raw material shift, a significant production capacity change — justifies it, not simply because a new period of data looks more favorable. Normalization matters just as much as the baseline period itself: comparing raw kWh figures across months with different production volumes or different clinker-to-cement ratios produces numbers that look meaningful but are not actually comparable, which is exactly the kind of gap an experienced auditor will find quickly. Getting the normalization variables right up front also pays off well beyond the certification audit itself, because a properly normalized EnPI is the only version of the number that gives an operations team a fair basis for comparing this month's performance against last year's, or for judging whether a capital project actually delivered the savings it was approved on.
| Process Area | Recommended EnPI | Normalize For |
|---|---|---|
| Kiln Thermal Performance | kcal/kg clinker (or MJ/t) | Alternative fuel substitution rate, raw material moisture |
| Grinding Circuits | kWh/t of ground product | Bond Work Index, target Blaine fineness |
| Overall Plant Electrical | kWh/t cement | Clinker-to-cement ratio, product mix |
| Compressed Air / Utilities | kWh/Nm³ delivered | Ambient temperature, operating hours |
See Your Own Significant Energy Uses Ranked and Tracked
iFactory pulls meter and process data from kiln, mill, and compressed air systems into one continuous EnPI model, so your energy review is backed by live data instead of a once-a-year manual audit.
The Certification Pathway, Step by Step
The path from a documented energy policy to a certificate on the wall follows a fairly consistent sequence across certification bodies, though the calendar time it takes depends heavily on how much of the baseline and EnPI infrastructure already exists versus needing to be built from scratch. Plants starting from spreadsheets and manual meter readings should expect the earlier stages to take considerably longer than plants that already have submetering and structured energy data collection in place. It is worth planning for this reality upfront rather than committing to an aggressive certification date and then discovering midway through the energy review that the twelve-month baseline requirement alone pushes the realistic timeline out by most of a year.
Energy Review & SEU Identification
Historical energy data is analyzed to identify significant energy uses and quantify the improvement opportunity at each one, forming the technical foundation the rest of the EnMS builds on.
Baseline, EnPI & Documentation
A minimum twelve-month baseline is established, EnPIs are defined and normalized, and the required policy, objectives, and procedural documentation are drafted.
Internal Audit & Management Review
The EnMS is run internally for a defined period, gaps are corrected, and a formal management review confirms the system is functioning as documented before external audit.
Stage 1 & Stage 2 Certification Audit
The certification body conducts a document review followed by an on-site verification audit, checking documentation, implementation, measurement, and improvement evidence.
Certification & Annual Surveillance
Certification is valid for three years, with annual surveillance audits confirming the EnPI trend, corrective actions, and continuous improvement evidence remain current and defensible.
What a Structured EnMS Is Actually Worth
A 4,500 tonne-per-day kiln line that entered its energy program running specific energy consumption roughly eleven percent above its regional benchmark closed most of that gap within a year of structured monitoring, moving its thermal SEC from around 3,420 kJ/kg clinker down to roughly 3,112 kJ/kg — a nine percent reduction sustained across six consecutive months rather than a one-time dip. The interventions themselves were not exotic: addressing false air infiltration first because it carried the largest individual impact, correcting separator wear second because it required parts procurement, and optimizing kiln operating conditions third once the underlying system efficiency had improved. What made the improvement measurable and defensible for certification purposes was not the interventions themselves but the fact that a continuous EnPI trend existed to prove each one actually moved the needle, rather than relying on before-and-after estimates built from incomplete manual readings for a claim that size to survive scrutiny during the next surveillance audit or in front of a finance team reviewing the return on the monitoring investment itself. That same continuous record is what turns the improvement into a repeatable capability rather than a one-time win, since the plant now has a running baseline it can measure the next round of interventions against without rebuilding the analysis from scratch. It is also the exact evidence an auditor expects to see during the next surveillance visit — a documented chain from identified root cause, to corrective action, to a measurable and sustained change in the EnPI trend line.
Keeping EnPIs Audit-Ready Between Certification Cycles
The three years between certification and recertification are where most EnMS programs quietly lose rigor, because the urgency of a Stage 1 and Stage 2 audit fades and manual data collection slips back toward monthly spreadsheets. Continuous monitoring closes that gap by keeping the baseline comparison, SEU tracking, and objective progress running automatically, so the system an auditor sees during the first surveillance visit looks the same as the one they certified rather than a program that has quietly drifted. This is also where the real financial value of an EnMS tends to show up long-term, since a plant that keeps its EnPI discipline running between audits catches new drift — a fouled preheater cyclone, a separator wearing out of spec — within weeks rather than rediscovering it a year later during the next scheduled review.
Continuous Baseline Comparison
Every meter reading is compared automatically against the normalized baseline, flagging deviation before it accumulates into a full reporting-period miss.
Automated EnPI Calculation
Production and energy data are combined continuously into normalized EnPI values, removing the manual spreadsheet step where most calculation errors originate.
Corrective Action Traceability
Each deviation, root cause investigation, and corrective action is logged against the specific EnPI it affected, building the improvement evidence auditors ask for directly.
Management Review Reporting
Objective progress, SEU performance, and open corrective actions are compiled automatically ahead of each management review rather than assembled manually beforehand.
ISO 50001 for Cement Plants — Frequently Asked Questions
How long does it typically take a cement plant to reach certification?
Timelines vary widely depending on how much of the baseline and EnPI infrastructure already exists, but plants starting close to scratch, including twelve months of baseline data collection, commonly spend twelve to eighteen months from initial energy review through Stage 2 certification. Plants that already have submetering and a functioning CMMS in place tend to move through the documentation and internal audit stages considerably faster, sometimes cutting the overall timeline by a third or more since the baseline data collection can lean on records that already exist rather than starting a fresh twelve-month clock. Teams estimating their own timeline can book a demo to see how existing meter data can shortcut baseline collection.
What happens if our EnPI trend moves in the wrong direction after certification?
A deteriorating EnPI trend is not automatically a certification failure, but it does require a documented corrective action showing the plant identified the root cause and took measurable steps to address it. What auditors are looking for during surveillance visits is evidence the EnMS is functioning as a genuine management system rather than proof that energy performance only ever improves in a straight line, which is rarely realistic across changing production conditions, seasonal weather variation, or shifts in raw material characteristics that no plant can fully control.
Can our existing ISO 9001 or ISO 14001 systems reduce the ISO 50001 workload?
Yes, significantly. Because all three standards share the same Plan-Do-Check-Act structure, document control procedures, internal audit programs, and management review processes built for an existing certification generally transfer with modest adaptation rather than needing to be built from zero. The energy-specific pieces — the review, baseline, EnPIs, and significant energy use controls — still need to be developed independently, but the management system scaffolding around them does not.
How many significant energy uses should a typical cement plant manage?
There is no fixed number specified by the standard, but in practice most cement plants find that three to five process areas — typically the kiln system, raw mill, finish mill, and sometimes compressed air or fan systems — account for the large majority of total energy consumption. Spreading management attention thin across dozens of minor loads instead of concentrating on these few typically produces a weaker audit case and less real energy savings, since neither the certification body nor the plant's own budget process rewards effort spread evenly across everything instead of focused on what actually moves the total.
Does ISO 50001 require us to buy new metering hardware?
Not necessarily. Many cement plants already have adequate metering at the kiln, mill, and utility level for basic process control, and the gap is usually in how that data is collected, normalized, and correlated rather than in the sensors themselves. Plants with genuine metering gaps at a significant energy use will need to close them, but that is typically a smaller investment than building an entirely new instrumentation layer. Reach out to support for a review of what your current metering already covers.
Build an EnMS That Holds Up at Every Surveillance Audit
iFactory's AI platform gives cement plants continuous baseline comparison, automated EnPI calculation, and traceable corrective action records, turning ISO 50001 from an annual scramble into a running system.