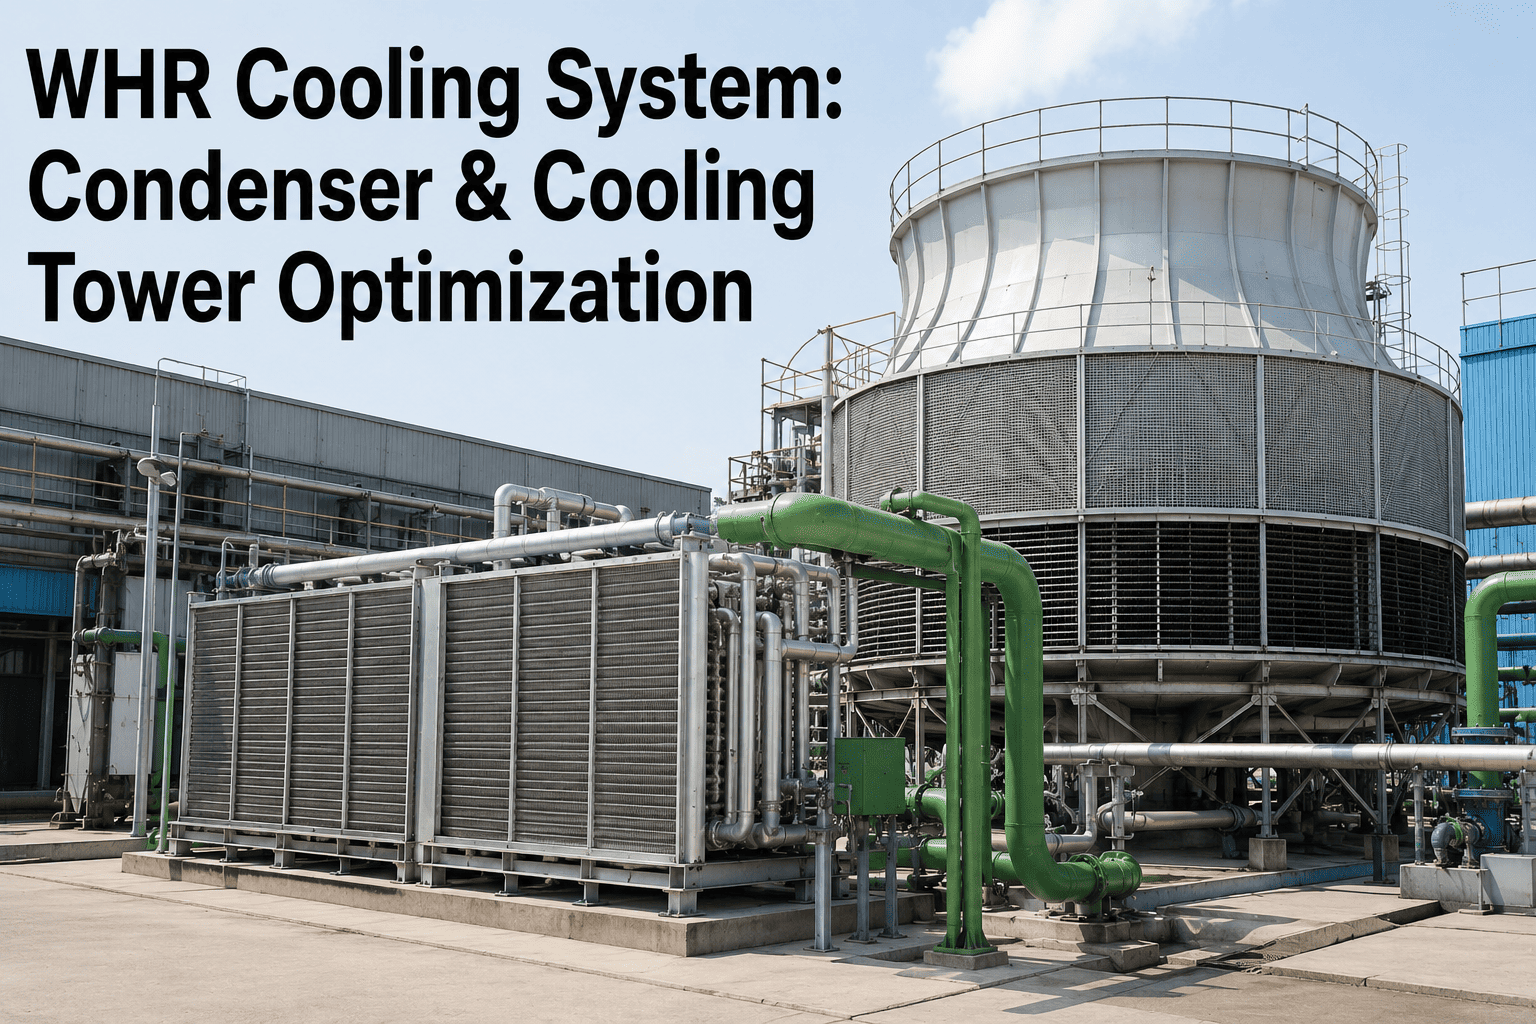
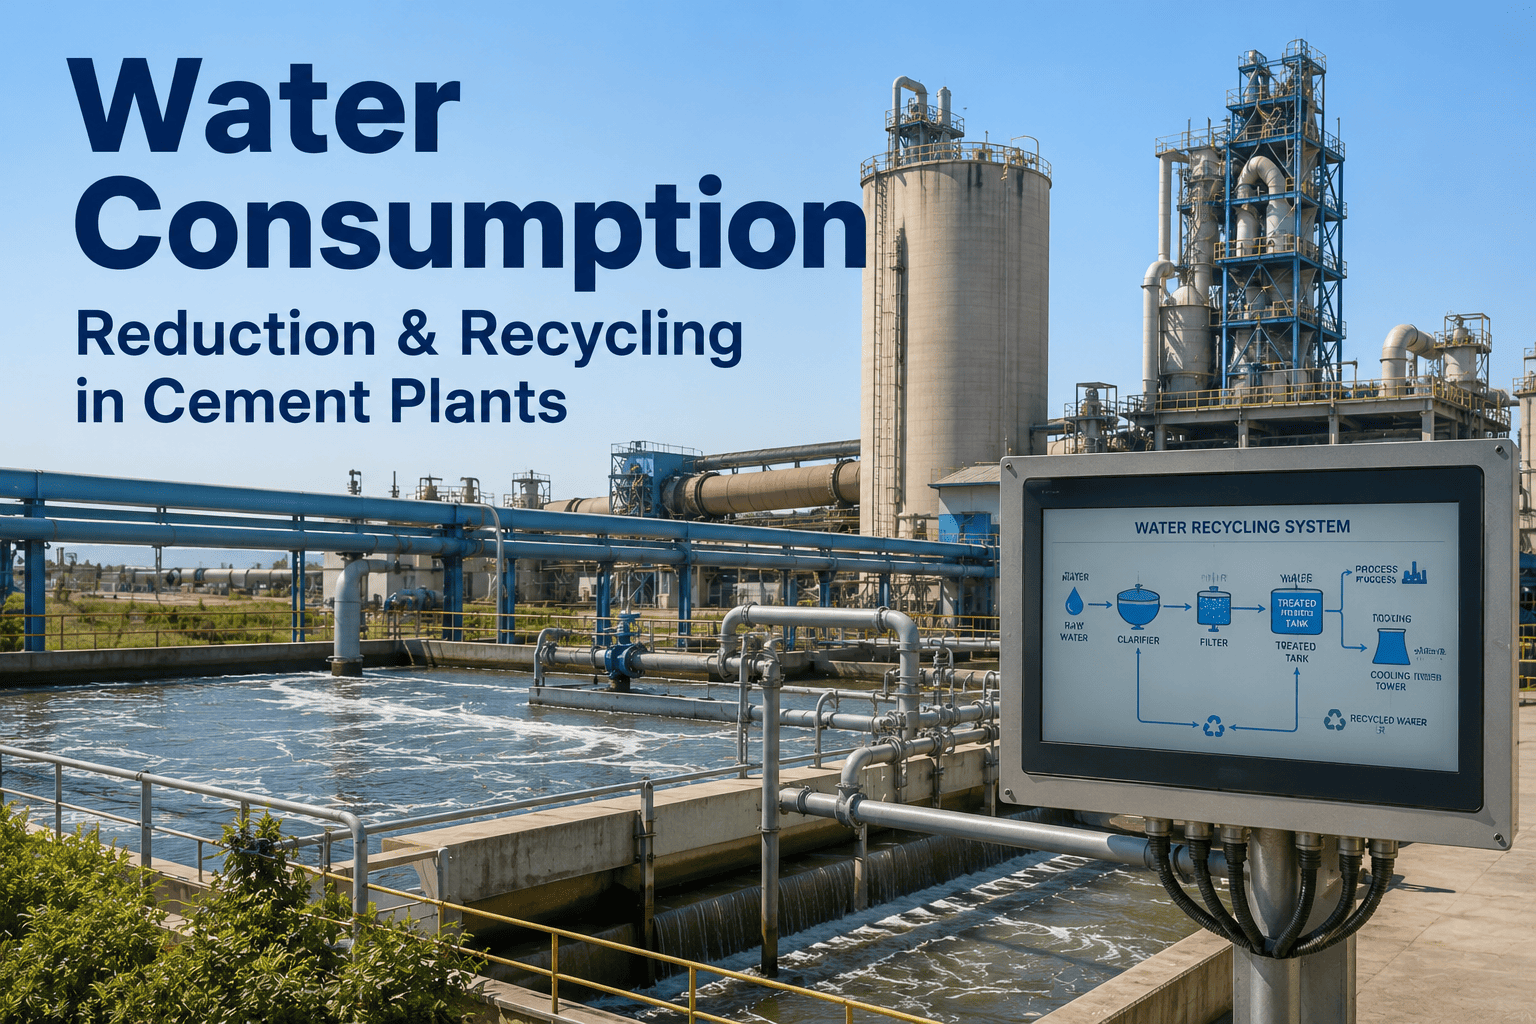
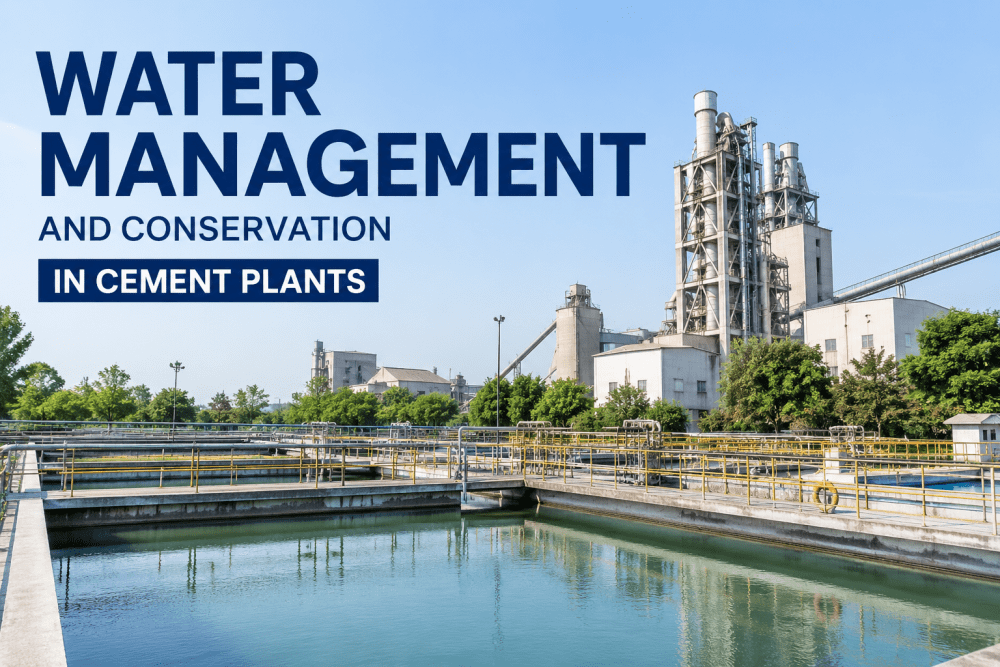
Water management in a cement plant is the most operationally complex utility system on site — a closed-loop cooling network that circulates 1,500 to 4,000 cubic meters per hour through the kiln lube oil coolers, the compressor jackets, the clinker cooler hydraulic system, the raw mill and finish mill bearing cooling circuits and the condenser of the waste heat recovery steam turbine, plus a process water system for injection into the inline raw mill for gas conditioning, the slurry preparation in wet-process plants, and the potable and fire water distribution across the site. A 5,000 ton per day cement plant with a closed-loop cooling tower system consumes 1.8 to 3.5 million cubic meters of makeup water annually at a cost of $0.50 to $2.50 per cubic meter depending on local water rates, treatment chemical costs, and discharge compliance requirements — putting total annual water expenditure at $900,000 to $8.8 million per plant. The cooling tower itself operates within a chemistry window defined by the saturation indices for calcium carbonate, calcium sulfate, and silica scaling, the corrosion rate for carbon steel and copper alloy heat exchanger metallurgy, and the biological growth limits for Legionella and other microorganisms — parameters that drift continuously as water evaporates, cycles of concentration increase, and treatment chemical feed rates drift from setpoint. Conventional water management relies on daily grab samples analyzed in the plant laboratory for pH, conductivity, hardness, alkalinity, chloride, and microbiological counts, with chemical feed adjustments made 8 to 24 hours after the sample was collected — a latency that guarantees the water chemistry operates outside the optimal treatment window for most of the day. AI-driven water analytics closes this gap by predicting scaling tendency, corrosion rate, and biological activity from continuous sensor data — pH, conductivity, temperature, flow, oxidation-reduction potential, and turbidity — enabling real-time treatment chemical feed adjustments that maintain water chemistry within the target window 95 to 98 percent of the time while reducing chemical consumption by 15 to 25 percent and extending heat exchanger cleaning intervals by 30 to 50 percent. Book a Demo to see how iFactory's Water Quality Monitoring and Cooling System PM modules optimize your cement plant water management program.
Is Your Cooling Water Chemistry Costing $200,000 to $500,000 Per Year in Scale, Corrosion, and Chemical Waste?
iFactory's Water Quality Monitoring platform predicts scaling tendency, corrosion rate, and biological activity in real time from continuous sensor data — enabling precise chemical feed control that maintains water chemistry within target window 95 to 98 percent of the time on an on-premise NVIDIA edge server with read-only PLC connectivity.
Why Water Chemistry Control Is the Most Overlooked Cost Driver in Cement Plant Operations
Water chemistry is the only process variable in a cement plant that simultaneously affects equipment reliability, energy efficiency, environmental compliance, and operating cost — and yet it is the most commonly managed through grab samples and operator judgment rather than continuous analytics. The cooling tower circulating water operates at 3 to 6 cycles of concentration, meaning dissolved solids are concentrated three to six times above the makeup water level, creating a scaling potential that deposits calcium carbonate on heat exchanger surfaces at rates of 0.5 to 3 mm per year if the Langelier Saturation Index exceeds 1.5. A 1 mm deposit of calcium carbonate scale on a kiln lube oil cooler reduces heat transfer efficiency by 10 to 15 percent, forcing the cooling tower to operate at 2 to 4 degrees lower approach temperature and increasing fan and pump energy consumption by 8 to 12 percent to compensate. The same water chemistry that drives scaling also controls corrosion rate — carbon steel corrosion in cement plant cooling systems typically measures 2 to 8 mils per year, but excursions above 6 mils per year reduce heat exchanger tube wall life from the design 15 to 20 years to 5 to 8 years, forcing premature replacement at $20,000 to $80,000 per exchanger. The AI platform that monitors scaling indices, corrosion rate, and biological activity continuously from pH, conductivity, temperature, and ORP sensor data enables the water treatment program to operate in a proactive adjustment mode rather than a reactive correction mode — maintaining the water chemistry within the target window for 95 to 98 percent of operating hours compared to 60 to 70 percent for conventional grab-sample management.
Five Critical Water Management Challenges in Cement Plant Cooling Systems That AI Addresses
Each sub-system of the cement plant water network presents a specific optimization challenge that the operator must solve with incomplete real-time data. The following five challenges represent the highest-leverage application areas for AI optimization in industrial water management, ranked by their impact on cooling system reliability and total water cost.
Cooling Tower Scaling Tendency and LSI Control
The Langelier Saturation Index of the recirculating cooling water drifts continuously as evaporation concentrates dissolved solids, pH shifts with temperature and biological activity, and alkalinity changes with makeup water quality. AI calculates LSI in real time from online pH, conductivity, temperature, and hardness sensors — predicting scaling potential 30 to 60 minutes ahead of deposition conditions and recommending acid or scale inhibitor feed rate adjustments that maintain the LSI between 0.5 and 1.2 where scaling is controlled without over-feeding inhibitor.
Corrosion Rate Monitoring and Inhibitor Optimization
Carbon steel corrosion in cement plant cooling water systems is driven by pH excursions, dissolved oxygen concentration, chloride levels, and temperature — each of which varies independently and requires a different inhibitor response. AI corrosion models predict carbon steel and copper alloy corrosion rates from online sensor data, enabling real-time corrosion inhibitor dosage adjustments that maintain rates below 3 MPY for carbon steel and below 0.3 MPY for copper alloys without the over-feed typical of fixed-rate inhibitor programs that waste chemical and increase discharge treatment cost.
Biological Growth Control and Biocide Optimization
Biological activity in cement plant cooling water — including Legionella, pseudomonas, and sulfate-reducing bacteria — multiplies rapidly when temperature, pH, and nutrient conditions favor growth, forming biofilm that reduces heat transfer efficiency, accelerates under-deposit corrosion, and creates health risks in cooling tower drift. AI predicts biological activity from ORP, turbidity, and temperature trends, recommending biocide type, dosage, and feed frequency that maintain microbiological control within target limits while reducing total biocide consumption by 20 to 30 percent compared to fixed-schedule dosing programs.
Cycles of Concentration and Makeup Water Optimization
Each additional cycle of concentration in the cooling tower reduces makeup water demand by 5 to 8 percent while increasing the scaling and corrosion potential and the concentration of treatment chemicals in the blowdown stream. AI optimizes the target cycles of concentration dynamically based on makeup water chemistry, scaling index trends, corrosion rate data, and discharge permit limits — balancing water conservation against chemical treatment cost and equipment risk. Deployments report makeup water reduction of 10 to 18 percent while maintaining water chemistry within all treatment and compliance targets.
Wastewater Discharge Compliance and Treatment Optimization
Cooling tower blowdown, process water discharge, and stormwater runoff must meet NPDES or POTW permit limits for pH, total suspended solids, oil and grease, temperature, and specific metals. AI monitors discharge water quality in real time, predicting compliance margin 15 to 30 minutes before potential permit exceedances and recommending treatment chemical adjustments or diversion to the equalization basin. Continuous compliance monitoring reduces the risk of Notice of Violation events that carry fines of $10,000 to $50,000 per day and require regulatory root cause investigation.
Five AI Capabilities That Transform Cement Plant Water Management
iFactory's Water Quality Monitoring platform delivers five integrated capabilities purpose-built for the operating dynamics of cement plant cooling water systems — covering the full water management scope from scaling index prediction through chemical feed optimization to discharge compliance monitoring. Each capability operates on sensor data from existing online instrumentation and delivers actionable recommendations to the water treatment operator through a dedicated console without modifying existing chemical feed control system logic.
Machine learning models trained on 12 to 18 months of water chemistry data — including pH, conductivity, temperature, alkalinity, calcium hardness, and treatment chemical feed rates — predict the Langelier Saturation Index, Ryznar Stability Index, and Puckorius Scaling Index at 1-minute intervals with a 30-to-60-minute prediction horizon. The model recommends acid feed rate and scale inhibitor dosage adjustments that maintain the LSI within the 0.5 to 1.2 non-scaling, non-corrosive window for 95 to 98 percent of operating hours. Typical scaling event reduction: 60 to 80 percent compared to grab-sample-based control.
AI corrosion models predict carbon steel, copper alloy, and stainless steel corrosion rates from pH, dissolved oxygen, conductivity, chloride, sulfate, and temperature sensor data — enabling real-time corrosion inhibitor feed adjustments that maintain carbon steel corrosion below 3 MPY and copper alloy corrosion below 0.3 MPY. The model distinguishes between general corrosion and localized pitting tendency, alerting the operator when conditions favor pitting corrosion that can perforate heat exchanger tubes in 6 to 18 months even when general corrosion rates appear acceptable. Corrosion rate prediction accuracy: within 0.5 MPY for carbon steel across the full operating temperature range of 20 to 50 degrees Celsius.
AI biological activity models estimate the total bacteria count, biofilm formation rate, and Legionella risk from ORP, turbidity, temperature, and free chlorine residual sensor trends — predicting biological upsets 2 to 4 hours before conventional dip-slide or plate count methods would detect them. The model recommends biocide type, dosage, and feed frequency optimized for current biological load and temperature conditions, reducing total biocide consumption by 20 to 30 percent compared to fixed-schedule programs while maintaining biological control within target limits. Biofilm formation rate prediction enables targeted biodispersant addition that prevents established biofilm before it requires mechanical cleaning.
AI dynamically optimizes the cooling tower cycles of concentration based on real-time makeup water chemistry, scaling index trends, corrosion rate data, and discharge permit limits for TDS and specific metals. The optimizer increases cycles during periods of favorable makeup water quality and decreased cycles when makeup alkalinity or hardness increases, maintaining the highest safe cycles of concentration at all times without risking scaling or corrosion excursions. Blowdown valve position is adjusted automatically to maintain the target cycles within 0.1 cycles of the setpoint, reducing blowdown volume and makeup water consumption by 10 to 18 percent compared to fixed-cycles operation.
AI monitors pH, TSS, temperature, oil and grease, and flow at the wastewater discharge point continuously, comparing each parameter against the NPDES or POTW permit limits with a predictive margin calculation that forecasts the 30-minute rolling average 15 to 30 minutes ahead of a potential exceedance. When the predicted margin drops below the operator-defined alarm threshold, the system alerts the water treatment operator to adjust chemical feed, increase equalization basin level, or divert flow to the emergency holding pond before the permit limit is violated. Continuous compliance monitoring reduces the risk of discharge exceedance events by 70 to 85 percent and automates the daily discharge monitoring report preparation.
Conventional Water Management vs AI-Enabled Water Analytics for Cement Plant Cooling Systems
The performance gap between conventional grab-sample-based water management and AI-enabled real-time water analytics is visible across every operating dimension that determines cooling system reliability, water conservation efficiency, and chemical treatment program cost. The comparison table below maps twelve critical water management parameters against conventional and AI-enabled approaches, showing the performance improvement that an integrated water analytics platform delivers. Book a Demo to discuss which AI capabilities deliver the highest ROI for your cooling tower configuration, heat exchanger metallurgy, and water chemistry profile.
| Operating Parameter | Conventional Water Management | AI-Enabled Water Analytics | Improvement |
|---|---|---|---|
| LSI monitoring frequency | Calculated once daily from grab sample lab results; 8–24 hour latency between sample and corrective action | Calculated every 60 seconds from online sensor data; corrective action initiated within 2–5 minutes of drift detection | LSI maintained within target window 95–98% of time vs 60–70% for grab samples |
| Corrosion rate measurement | Coupon exposure for 30–90 days; no real-time indication of corrosion excursions between coupon removal periods | Continuous corrosion rate prediction from sensor data; real-time alert when predicted rate exceeds 3 MPY threshold | Corrosion excursions detected and corrected within minutes vs weeks; tube life extended 40–60% |
| Biological monitoring | Weekly dip-slide culture or heterotrophic plate count; 3–7 day latency between sample collection and result | Continuous biological activity prediction from ORP, turbidity, and temperature trends; alert within 30–60 minutes of upset onset | Biological upsets detected 2–4 hours before conventional methods; biocide consumption reduced 20–30% |
| Chemical inhibitor feed control | Fixed feed rate adjusted weekly based on grab sample residual test; chemical waste during low-demand periods | Variable feed rate adjusted every 2–5 minutes based on continuous corrosion rate and scaling index feedback | Chemical consumption reduced 15–25%; inhibitor residual maintained within target range 95% of time |
| Cycles of concentration | Fixed target cycles set annually based on average makeup water quality; adjusted manually 2–4 times per year | Dynamic cycles target updated every 15–30 minutes based on real-time makeup water chemistry and system conditions | 10–18% reduction in makeup water consumption; 5–10% reduction in blowdown treatment cost |
| Heat exchanger cleaning interval | Fixed annual or biannual cleaning schedule regardless of actual fouling condition; emergency cleaning when approach temp exceeds alarm | Condition-based cleaning interval predicted from scaling index trends and approach temperature trajectory; cleaning scheduled at least 30 days before alarm condition | Cleaning intervals extended 30–50%; emergency cleaning events reduced 60–80% |
| Makeup water consumption | 1.8–3.5 million m³ per year at 3–4 fixed cycles of concentration; no dynamic adjustment for water cost or availability | 1.5–2.9 million m³ per year at 4–6 dynamically optimized cycles; reduced consumption without increasing scaling risk | Annual makeup water savings of 200,000 to 600,000 m³; cost savings of $50,000 to $120,000 per year |
| Discharge compliance monitoring | Daily grab sample at discharge point; laboratory analysis with 8–24 hour latency; exceedance detected after the fact | Continuous online monitoring at discharge point; real-time comparison against permit limits; predictive alert 15–30 minutes before exceedance | Exceedance risk reduced 70–85%; Notice of Violation events reduced 80–90% |
| Cooling tower energy consumption | Fan and pump speed set manually based on leaving water temperature; no integration with water chemistry conditions | AI coordinates fan speed, pump speed, and chemical feed to minimize total energy and chemical cost while meeting temperature and chemistry targets | 3–7% reduction in cooling tower fan and pump energy through integrated temperature-chemistry optimization |
| Water treatment labor requirement | 1–2 hours per shift for sampling, testing, chemical drum inventory, and feed rate adjustment documentation | 15–30 minutes per shift for dashboard review, exception handling, and system status verification | 60–70% reduction in water treatment labor; 500–800 hours per year reclaimed for process improvement |
| Data integration and reporting | Manual recording of daily grab sample results in spreadsheet; monthly and quarterly reports compiled manually from paper logs | Automatic capture of all water chemistry, chemical feed, and flow data at 1-minute granularity; AI predictions and operator actions stored in searchable database; automated daily, monthly, and quarterly report generation | Report preparation time reduced from 4–8 hours per month to 30–60 minutes; complete data traceability for regulatory audits |
| Annual water management cost | $900,000 to $8.8 million total water cost at typical 5,000 TPD plant; chemical program $100,000 to $350,000; maintenance $80,000 to $250,000 | $700,000 to $7.2 million total water cost; chemical savings $30,000 to $80,000; maintenance savings $40,000 to $120,000; water savings $50,000 to $120,000 | Total annual savings of $120,000 to $320,000; full ROI within 8–14 months of platform deployment |
Deploying AI Water Analytics in a Cement Plant Cooling System: A Phased Approach
Deploying AI water analytics in a cement plant cooling system requires a phased approach that accounts for the critical nature of cooling water chemistry on heat exchanger reliability, the integration requirements with existing chemical feed control systems, and the operator adoption discipline that separates successful implementations from projects that stall during the transition from advisory recommendations to routine operational use.
What a Water Treatment Manager Learned Deploying AI Analytics on a Cement Plant Cooling Tower System
Based on iFactory's deployments across cement plant cooling water systems and industrial water treatment programs at U.S. facilities operating 3,000 to 8,000 GPM cooling towers with chemical feed systems, online sensors, and discharge compliance monitoring, the following operational outcomes consistently emerge when AI water analytics is deployed with proper sensor infrastructure, operator adoption discipline, and phased deployment planning.
"I have managed industrial water treatment programs for cement plants, chemical facilities, and power plants for 22 years across multiple states, and the most persistent operational problem in cooling water management is that the sample-based approach is fundamentally incapable of preventing problems because the latency between sampling and corrective action always exceeds the time it takes for water chemistry to drift outside the target window. A cooling tower operating at 4.5 cycles of concentration with a makeup water alkalinity of 120 mg per liter will experience a 0.15 unit per hour drift in LSI when evaporation increases during a hot afternoon, and by the time the morning grab sample result comes back from the lab at 1400 hours the LSI has been above 1.8 for four hours — long enough to initiate calcium carbonate nucleation on every heat exchanger surface in the system. The AI approach that monitors LSI in real time and adjusts the acid feed pump every 30 seconds to maintain the index within the 0.5 to 1.2 window is not just more efficient than grab-sample management — it is a fundamentally different capability that eliminates the single largest root cause of cooling system fouling and corrosion. The first time I saw the AI detect a pH drift of 0.15 units from a makeup water alkalinity change and recommend an acid feed adjustment before the LSI reached 1.5, I understood that continuous water chemistry analytics represents the same leap forward in cooling system management that distributed control systems represented for process control in the 1980s. Cement plants that deploy real-time water analytics will achieve heat exchanger cleaning intervals that are 40 to 60 percent longer than the industry average and chemical treatment costs that are 20 to 30 percent lower than comparable plants using conventional water management programs."