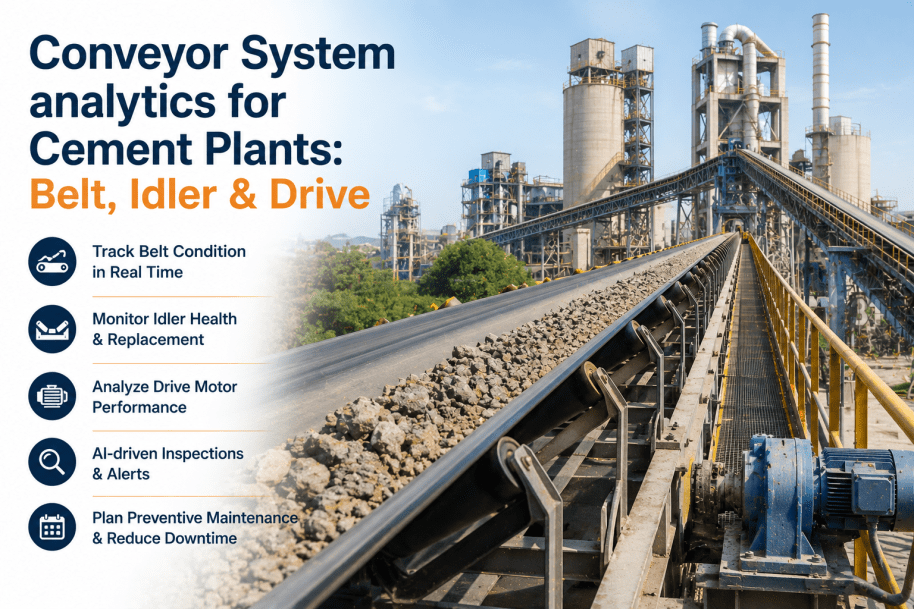
Conveyor System Analytics for Cement Plants: Belt, Idler & Drive
By Hazel Green on June 9, 2026
Conveyor systems are the circulatory system of every cement plant — moving raw materials from the crusher to the raw mill, raw meal to the preheater, clinker to the finish mill and cement to the loading terminal across kilometers of belts, thousands of idlers, and dozens of drive stations. A typical integrated cement plant operates 8 to 15 kilometers of conveyor belts with 5,000 to 12,000 idlers and 40 to 80 drive motors ranging from 30 kW to 500 kW each. Belt tears, idler seizures, and drive motor failures are the leading causes of unplanned raw material supply interruptions, each costing $5,000 to $50,000 per hour in lost production depending on the affected circuit. The challenge is that belt damage develops internally — a puncture that starts as a small cut grows along the carcass for hundreds of meters before it reaches the edge where visual inspection detects it. Idler bearings fail gradually, drawing slightly more power and generating slightly more heat for weeks before seizure. Drive motor insulation degrades from vibration and thermal cycling over months. Conventional inspection relies on visual walkdowns, monthly vibration surveys, and quarterly thermal imaging — intervals that guarantee most failures are found after they have already caused damage. AI-driven conveyor analytics closes these visibility gaps by monitoring belt condition through acoustic emission and power draw signatures, tracking idler bearing health through thermal and vibration trends, and predicting drive motor and gearbox degradation from current signature analysis and oil condition data — enabling maintenance to be scheduled based on actual component condition rather than calendar intervals. Book a Demo to see how iFactory's Conveyor Health Monitoring and Belt Tracking modules optimize your cement plant conveyor system.
Technical Analysis · Cement Conveyor Systems · 2026
How AI Transforms Conveyor Analytics: Belt, Idler & Drive Management
Predictive analytics, real-time monitoring, and condition-based maintenance are transforming belt condition monitoring, idler replacement scheduling, and drive motor health tracking across cement plant conveyor networks spanning kilometers of material handling equipment.
Across belt, idler, and drive-related failures in cement plant conveyor systems
35%
Extended belt service life
28%
Fewer idler replacements
18%
Drive energy reduction
<8 mo
Typical payback period
The Conveyor System Challenge — Why Traditional Inspection Falls Short
Conveyor systems in cement plants operate in some of the harshest conditions in industrial material handling — abrasive cement dust, high temperatures near the clinker cooler, moisture from raw material stockpiles, and continuous operation at 80 to 100 percent utilization during production campaigns. Belts develop longitudinal tears from sharp materials caught in the loading chute, cover wear from constant material abrasion, and splice degradation from repeated flexing around pulleys. Idlers seize when bearing seals fail and dust penetrates the grease charge — a failure mode that increases belt drag, accelerates belt cover wear, and can generate enough heat to ignite the belt or accumulated dust. Drive motors and gearboxes fail from vibration-induced bearing wear, insulation degradation from thermal cycling, and oil contamination from dust ingress through breather vents. Each failure mode develops over a different timescale and requires a different detection method, yet most plants rely on the same inspection approach for all three — weekly visual walkdowns by the conveyor inspector, monthly vibration readings on drive motors, and quarterly thermal imaging of idlers. These inspection intervals guarantee that failures are detected only after they have already caused damage — a belt tear that started at the loading chute runs 200 meters before the edge damage becomes visible, an idler seizure overheats and ignites accumulated dust, a drive motor winding fault trips the overload relay without warning. Book a Demo to see how iFactory AI eliminates these inspection blind spots.
01
Belt Damage Detection Latency
Longitudinal tears, cover wear, and splice degradation develop internally and are invisible to visual inspection until damage reaches the belt edge. By the time a tear is visible, the belt has already weakened over hundreds of meters and requires splicing or replacement. AI detects belt anomalies from power draw and acoustic signatures at the moment of impact, not days later.
02
Idler Replacement Without Data
Idler replacement is typically reactive — the seized roller is discovered when it burns the belt or ignites dust. Most plants replace 3 to 8 percent of idlers annually on a calendar schedule regardless of actual condition, wasting capital on rollers that still have years of service life while failing to replace the 1 to 2 percent that are near failure.
03
Drive Motor Reliability Gaps
Drive motor failures are the highest-impact conveyor failures — a single 200 kW motor failure on the main raw material conveyor can stop raw mill feed for 8 to 24 hours. Monthly vibration readings and quarterly insulation resistance tests miss the thermal and vibration trends that precede winding failures and bearing seizures by weeks.
04
Maintenance Planning Without Visibility
Belt replacement, idler change-outs, and drive overhauls are scheduled on fixed intervals or production convenience rather than actual condition. Plants replace belts 2 to 3 years early or run them to catastrophic failure because they lack the wear data to predict remaining life within useful accuracy.
How AI Transforms Conveyor System Management — Four Integrated Capabilities
Artificial intelligence addresses each of these challenges through four interconnected capabilities that replace periodic, manual inspection with continuous, data-driven condition monitoring. iFactory AI's Conveyor Health Monitoring platform integrates all four into a unified system spanning belt condition tracking, idler health prediction, drive motor analytics, and automated maintenance planning. Book a Demo to see these capabilities configured for your cement plant conveyor network.
Capability 01
Belt Condition Monitoring & Splice Tracking
Machine learning models analyze conveyor motor power draw, belt speed, and acoustic emission data continuously to detect longitudinal tears, cover wear progression, and splice elongation. The model learns the power draw signature of normal belt operation at each material feed rate and detects deviations caused by belt damage, material build-up on idlers, or belt misalignment. Splice tracking predicts remaining service life from elongation trends and visual condition data.
Impact:Belt tears detected at initiation vs. after 200+ m propagation; belt life extended 35%
Capability 02
Idler Health Prediction
AI models track idler condition from thermal imaging data, vibration trends on idler support structures, and the conveyor power draw signature that increases when idlers begin to seize. Each idler is assigned a health score based on bearing temperature rise relative to ambient, vibration amplitude trend, and the incremental power draw attributable to that idler zone. Replacement recommendations are generated only when health scores cross the replace threshold.
Impact:Idler replacement optimized from calendar-based to condition-based; 28% fewer replacements
Capability 03
Drive Motor & Gearbox Analytics
Continuous monitoring of drive motor current signature, vibration spectrum, winding temperature, and insulation resistance identifies developing faults — bearing wear, rotor bar cracks, winding insulation degradation, and gear tooth fatigue — 14 to 30 days before they would cause a trip or mechanical failure. Oil condition sensors on gearboxes track viscosity, moisture content, and wear particle count in real time.
Impact:Unplanned drive outages reduced 52%; gearbox oil changes optimized by condition data
Capability 04
Integrated Maintenance Planning
AI-generated condition-based work orders integrate belt, idler, and drive health data into a single maintenance priority list. The platform recommends the optimal timing for belt replacement, idler change-out campaigns, and drive overhauls based on actual condition trends and production schedule constraints. Maintenance planners see a unified view of conveyor system health across the entire plant.
Impact:PM costs reduced 25%; belt replacement decisions based on wear data not calendar guesswork
AI Optimization Across Conveyor Components — Tab View
Each conveyor component requires a different AI monitoring approach because the physics of degradation differ fundamentally between a rubber belt with steel cord splices, a rotating idler with sealed bearings, and a gear-driven motor and gearbox assembly. The tabs below describe the AI model architecture and operational outputs for each component within iFactory's unified conveyor health monitoring platform.
Tear Detection
AI analyzes motor power draw signatures at 100-millisecond intervals to detect the instantaneous power spike caused by material impact on the belt surface. When a sharp object penetrates the belt, the motor power spikes by 3 to 8 percent for 200 to 500 milliseconds — a pattern invisible to SCADA systems that log power at 5-second or longer intervals. The model classifies each event as harmless material impact or belt-threatening penetration.
Cover Wear & Splice Tracking
Belt cover wear is inferred from the ratio of conveyor power draw to material throughput — as the top cover thins, the belt flexes more around pulleys, increasing friction and power draw by 0.5 to 1.5 percent per millimeter of cover loss. Splice elongation is tracked from encoder-based belt position monitoring that measures the distance between embedded splice markers at each revolution.
Belt Alignment & Skirtboard Wear
Belt misalignment is detected from edge sensor data and the power draw imbalance between the left and right drive motors on dual-drive conveyors. Skirtboard wear is inferred from the rate of material spillage detected by the difference between belt scale readings at the loading and discharge points.
Bearing Temperature Trending
AI models track each idler's bearing temperature rise above ambient from thermal imaging data collected by drone or fixed thermal cameras. Idlers with failing bearings run 10 to 25 degrees Celsius hotter than adjacent healthy idlers. The model correlates temperature rise with bearing load and conveyor speed to establish a baseline and detect deviation thresholds.
Vibration & Power Draw Correlation
Vibration sensors on idler support structures detect the high-frequency signature of bearing raceway spalling. The power draw increase from idler seizure is isolated from total conveyor power by comparing the measured power to the expected power from the AI model trained on current feed rate, belt condition, and conveyor profile.
Zone-Based Replacement Planning
The platform groups idlers by zone — loading area, carry side, return side, and impact area — and recommends replacement campaigns by zone rather than individual idler replacement. This approach reduces maintenance labor by 40 percent compared to one-at-a-time replacement while ensuring all idlers in high-wear zones are replaced before failure.
Motor Current Signature Analysis
AI analyzes the motor current waveform at 10 kHz sampling rate to detect rotor bar cracks, bearing wear, and winding insulation degradation. Rotor bar cracks produce a characteristic sideband frequency at the rotor slot pass frequency, detectable 30 to 60 days before the bar fails catastrophically. Winding insulation degradation is detected from the partial discharge trend, tracked continuously rather than during quarterly offline tests.
Gearbox Oil Condition Monitoring
In-line oil sensors measure viscosity, moisture content, wear particle count, and acid number continuously. AI predicts remaining oil service life from the combined trend of these parameters and detects gear tooth fatigue from the wear particle composition — ferrous particles indicate gear wear, non-ferrous particles indicate bearing wear.
Vibration & Thermal Trend Analysis
Accelerometers on each motor bearing and gearbox input-output shaft provide continuous vibration data. AI tracks the overall vibration level and decomposes it into frequency-specific bands — bearing fault frequencies, gear mesh frequencies, and shaft rotational frequencies. Thermal trends from RTD sensors embedded in motor windings and gearbox oil sumps provide the second dimension of health assessment.
Performance Comparison — Conventional vs. AI-Driven Conveyor Management
The table below compares conventional conveyor system management with AI-driven methods across the key operational functions that determine belt, idler, and drive system reliability, maintenance cost, and energy efficiency. Data reflects deployment results across cement plant conveyor networks operating with iFactory AI's Conveyor Health Monitoring platform.
AI-driven speed optimization based on material flow rate, belt condition, and conveyor profile
Conveyor energy consumption reduced 12-18%
Energy Monitoring + Production Monitoring
Maintenance Scheduling
Fixed calendar intervals for belt inspection, idler replacement, and drive overhaul
AI-generated condition-based work orders integrated with production schedule optimization
PM costs reduced 25%; belt replacement decisions data-driven vs. calendar-based
CMMS + Predictive Maintenance
Deployment Roadmap — From Assessment to Autonomous Operations
Deploying AI for conveyor system analytics follows a structured five-phase timeline that delivers measurable value at each stage while building toward full conveyor network visibility. iFactory's unified platform and pre-built connectors for conveyor control systems accelerate deployment to 10 to 16 weeks for a typical cement plant conveyor network.
01
Sensor & Data Foundation (Weeks 1-3)
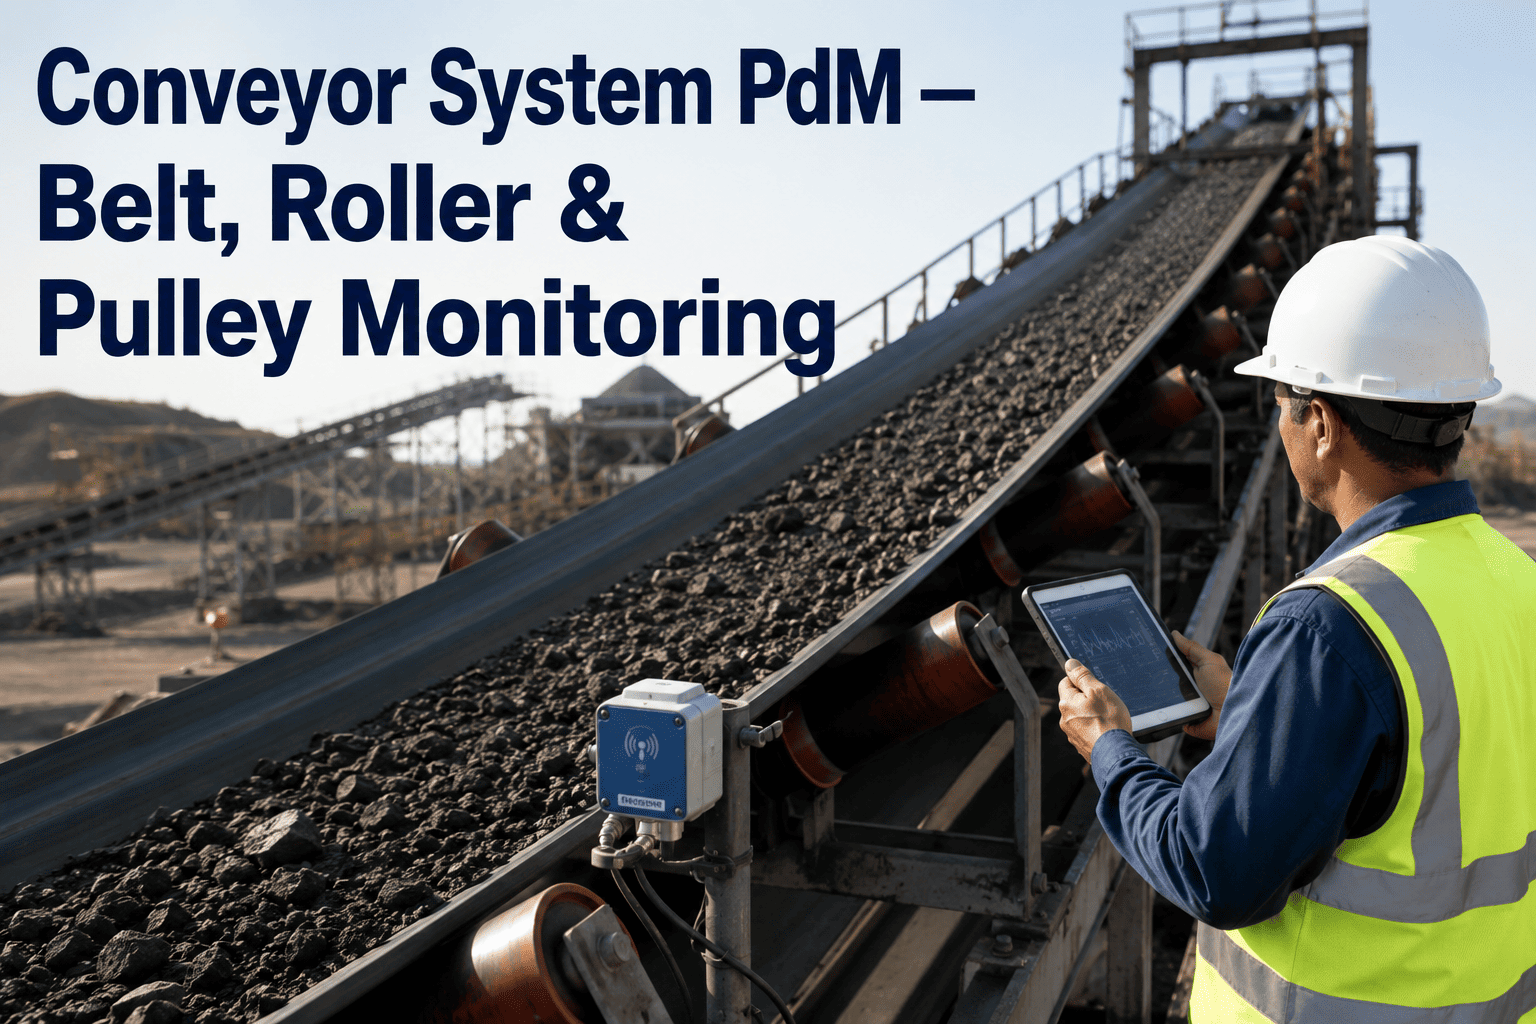
Establish real-time data ingestion from existing conveyor PLC systems for motor power, belt speed, and material flow rate. Deploy additional IoT sensors — belt alignment sensors, acoustic emission sensors on high-risk loading zones, vibration sensors on drive motors and gearboxes, and thermal cameras for idler temperature monitoring. iFactory's pre-built connectors for Allen-Bradley, Siemens, and Modbus-based conveyor control systems accelerate this phase.
Deliverable: Unified real-time data stream from all conveyor sensors and control systems
02
AI Model Training & Validation (Weeks 3-6)
Train site-specific ML models using 12 to 18 months of historical maintenance records, belt inspection reports, and motor current data. Models cover belt tear detection, idler health classification, drive motor fault prediction, and gearbox oil condition forecasting. Each model is validated against actual failure events to ensure accuracy before deployment on live conveyor systems.
Deliverable: Validated predictive models with documented accuracy against historical conveyor failures
03
Dashboard & Alert Configuration (Weeks 6-9)
Configure unified conveyor health dashboards with belt-specific KPIs — current health score, tear event count, splice elongation trend, and remaining useful life. Idler zone maps show health status across the entire conveyor network. Drive motor and gearbox dashboards display condition trends and predicted failure modes. Automated alerts are tuned to minimize false positives while ensuring critical anomalies are escalated within seconds.
Deliverable: Live conveyor health dashboards with automated alerting and zone-based idler status maps
04
Workflow & CMMS Integration (Weeks 9-12)
AI-generated condition-based work orders feed directly into the iFactory CMMS system, creating maintenance tasks for belt splice inspection, idler zone replacement campaigns, drive motor bearing lubrication, and gearbox oil change-out. Work orders include the detected anomaly, sensor data summary, recommended action, and priority level based on remaining useful life and production impact.
Deliverable: Automated work order creation from AI health scores with conveyor-specific maintenance instructions
05
Continuous Learning & Network Scaling (Week 12+)
Models continuously retrain on new inspection data, failure events, and maintenance outcomes, improving detection accuracy and reducing false positive rates with each operating month. The platform scales to additional conveyor lines and plant-wide material handling systems using standardized sensor packages and model transfer learning — reducing deployment time for each subsequent conveyor by 40 to 50 percent.
Deliverable: Self-improving AI platform with multi-conveyor and plant-wide material handling visibility
Plan Your Conveyor AI Deployment
A deployment consultation maps the five-phase roadmap to your specific conveyor network — belt types, conveyor lengths, drive configurations, and existing sensor infrastructure. Output includes a documented deployment plan with timeline, sensor requirements, and integration specifications tailored to your cement plant conveyor system.
Industry Expert Perspective on AI in Cement Plant Conveyor Systems
"I have spent twenty-two years in cement plant maintenance and operations — starting as a conveyor mechanic on the raw material handling system, then moving into maintenance planning, and eventually into plant engineering leadership across two integrated cement plants in the Midwest. For most of my career, conveyor management was reactive. We walked the belts every morning with a flashlight and a notebook, marking idlers that needed replacement and looking for belt edge damage. The belt splices were measured with a tape measure during every scheduled downtime and recorded in a binder that the planner reviewed when deciding whether to schedule a belt replacement. Drive motor vibration was measured quarterly by the reliability engineer with a handheld data collector, and gearbox oil was sampled twice a year. The maintenance planner scheduled belt replacement based on hours of operation — typically every 4 to 5 years — regardless of whether the belt had worn evenly or had localized damage from a loading chute issue. The most transformative change I have seen is the application of continuous AI monitoring to conveyor systems. We deployed iFactory's conveyor health platform on our main raw material conveyor in early 2025, and within the first three months the AI detected six impact events that were severe enough to have caused carcass damage — events that the operators had not noticed because the motor current spike lasted less than a second and the SCADA historian was logging at 10-second intervals."
— Director of Plant Engineering, Major Cement Producer — 22 Years Industry Experience — 2 Integrated Cement Plants — 8 km of Conveyor Belts
52%
Fewer unplanned conveyor stoppages with AI monitoring
35%
Extended belt service life with splice tracking
45 days
Earlier detection of drive motor rotor bar cracks
Frequently Asked Questions
How does AI detect conveyor belt damage before it causes a failure?
AI detects conveyor belt damage through three complementary methods operating continuously across the conveyor system. Motor power draw signature analysis identifies the instantaneous power spike — 3 to 8 percent for 200 to 500 milliseconds — caused when a sharp object penetrates the belt surface, an event invisible to SCADA systems logging at 5-second intervals. Acoustic emission sensors on the belt at high-risk zones detect the high-frequency sound of carcass damage as it occurs. The AI model classifies each event as harmless material impact or belt-threatening penetration and tracks the cumulative damage trend to predict remaining belt service life.
How does AI optimize idler replacement scheduling in cement plant conveyors?
AI optimizes idler replacement by tracking three parameters for each idler or idler zone continuously. Thermal imaging data identifies idlers running 10 to 25 degrees Celsius above ambient — the primary indicator of bearing degradation. Vibration sensors on idler support structures detect the high-frequency signature of bearing raceway spalling weeks before seizure. The conveyor power draw signature is analyzed at zone level to isolate the incremental power increase caused by seizing idlers. The platform groups idlers by zone and recommends replacement campaigns by zone rather than individual replacement, reducing maintenance labor by 40 percent while ensuring all idlers in high-wear zones are replaced before failure.
What drive system parameters does AI monitor to prevent unplanned conveyor outages?
AI monitors four categories of drive system parameters continuously. Motor current signature analysis at 10 kHz detects rotor bar cracks, bearing wear, and winding insulation degradation 30 to 60 days before failure. Vibration spectrum analysis on each motor bearing and gearbox shaft decomposes the overall vibration into frequency-specific bands for bearing faults, gear mesh wear, and shaft imbalance. Thermal trends from RTD sensors in motor windings and gearbox oil sumps track the temperature rise that precedes winding failure and oil degradation. In-line oil sensors measure viscosity, moisture, wear particle count, and acid number continuously, predicting remaining oil service life and detecting gear tooth fatigue from wear particle composition.
What data infrastructure is needed to support AI-driven conveyor analytics in a cement plant?
The core data infrastructure requirements include real-time data acquisition from existing conveyor PLC systems for motor power, belt speed, material flow rate, and drive status at sub-second intervals. Additional sensors include belt alignment sensors at key transfer points, acoustic emission sensors on high-risk loading zones, accelerometers on each drive motor and gearbox bearing housing, thermal cameras or fixed infrared sensors for idler zone temperature monitoring, and in-line oil condition sensors on gearboxes. iFactory's platform includes pre-built connectors for major conveyor control systems, support for Modbus, OPC-UA, and API-based data ingestion, and on-premise deployment on an NVIDIA edge server with read-only connectivity to the plant control network.
How long does it take to deploy AI for conveyor analytics and when can results be expected?
A structured five-phase deployment typically takes 10 to 16 weeks from project initiation to full operational integration for a cement plant conveyor network. Phase 1 (sensor and data foundation) takes 2 to 3 weeks. Phase 2 (AI model training and validation) takes 3 to 4 weeks using historical maintenance and operational data. Phase 3 (dashboard and alert configuration) takes 3 to 4 weeks. Phase 4 (workflow and CMMS integration) takes 2 to 3 weeks. Phase 5 (continuous learning and network scaling) begins at week 12 and continues indefinitely. Initial results — belt tear events detected, idler health scores, and drive motor condition trends — are available within 4 to 6 weeks of project start. Energy savings from optimized conveyor operation typically appear within the first month after dashboard deployment.
Conclusion
Cement plant conveyor systems — belts, idlers, and drives — represent the largest maintenance cost and the highest production risk in the material handling chain. Belt tears that go undetected for hundreds of meters, idler seizures that ignite dust accumulations, and drive motor failures that stop production for 8 to 24 hours are not inevitable maintenance events — they are the consequence of inspection intervals that are measured in days and weeks rather than seconds and milliseconds. AI-powered conveyor analytics eliminates these visibility gaps by creating a continuous, real-time picture of every belt section, idler zone, and drive component. Belt tears are detected at the moment of initiation, idler bearing degradation is identified by the degree of temperature rise, and drive motor rotor bar cracks are detected 45 days before failure. Each operating day generates more training data, improving model accuracy, driving better maintenance decisions, reducing unplanned stoppages, extending component life, and improving energy efficiency across the entire conveyor network. iFactory AI provides the unified platform — Conveyor Health Monitoring, Belt Tracking, Predictive Maintenance, Energy Monitoring, and CMMS integration — that delivers this integrated capability across any cement plant conveyor configuration. Book a Demo to see the iFactory platform configured for your cement plant conveyor system.
Deploy AI for Your Cement Plant Conveyor System
iFactory AI provides the integrated platform that transforms conveyor system management. Schedule a 30-minute demo to see the platform configured for your belt, idler, and drive monitoring requirements.