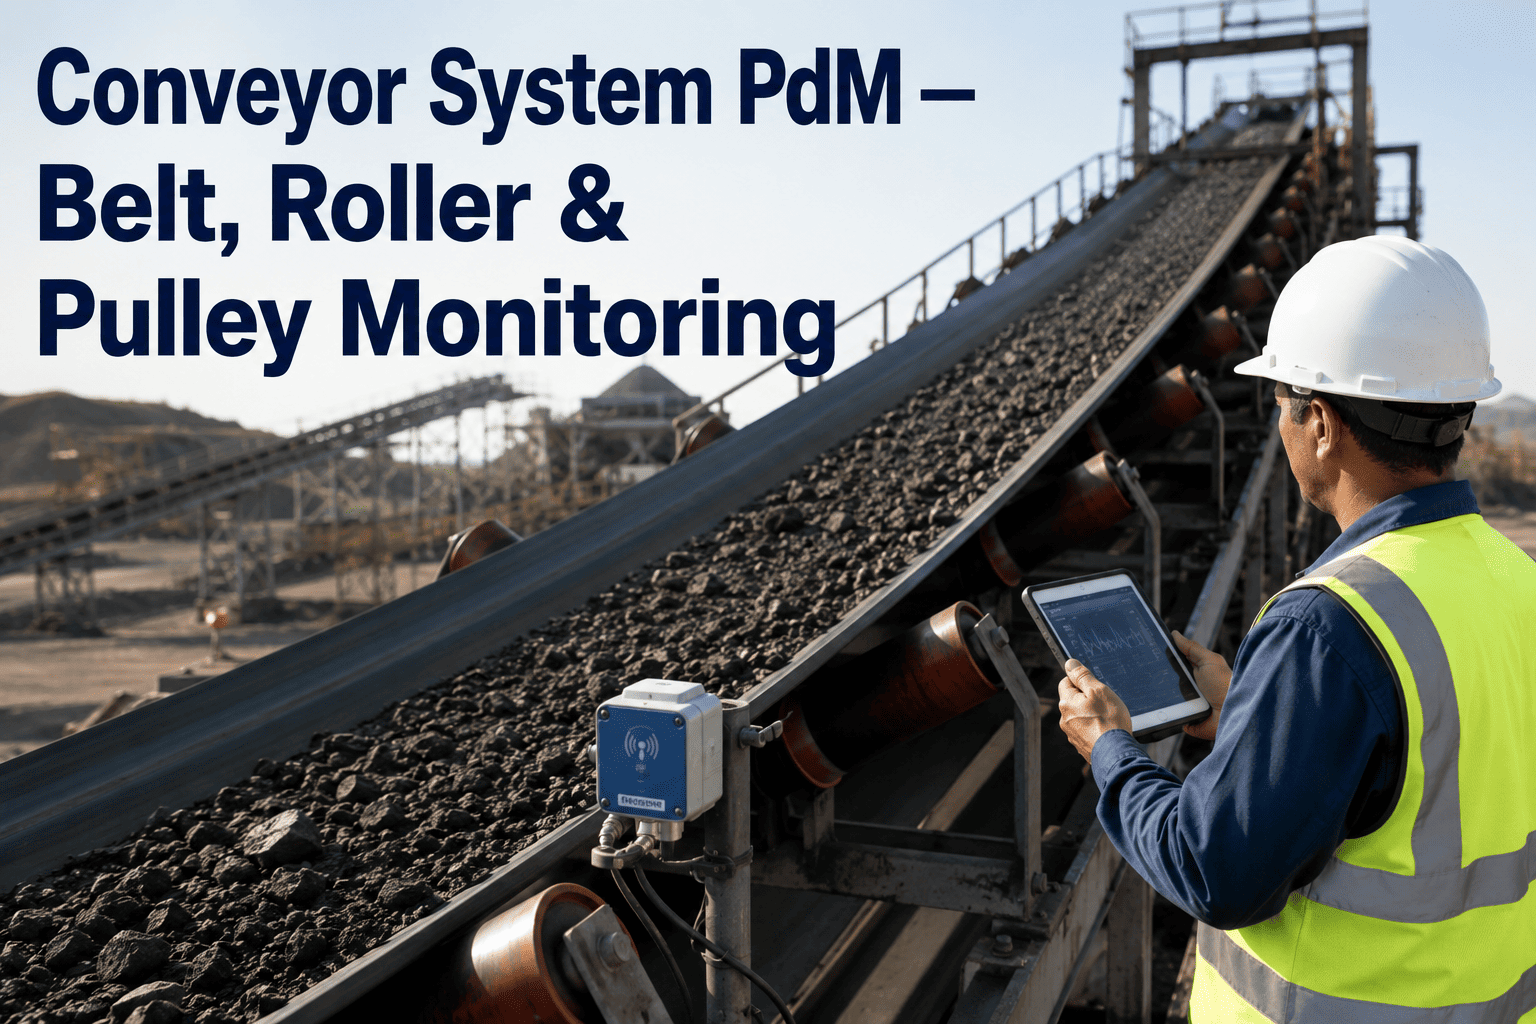
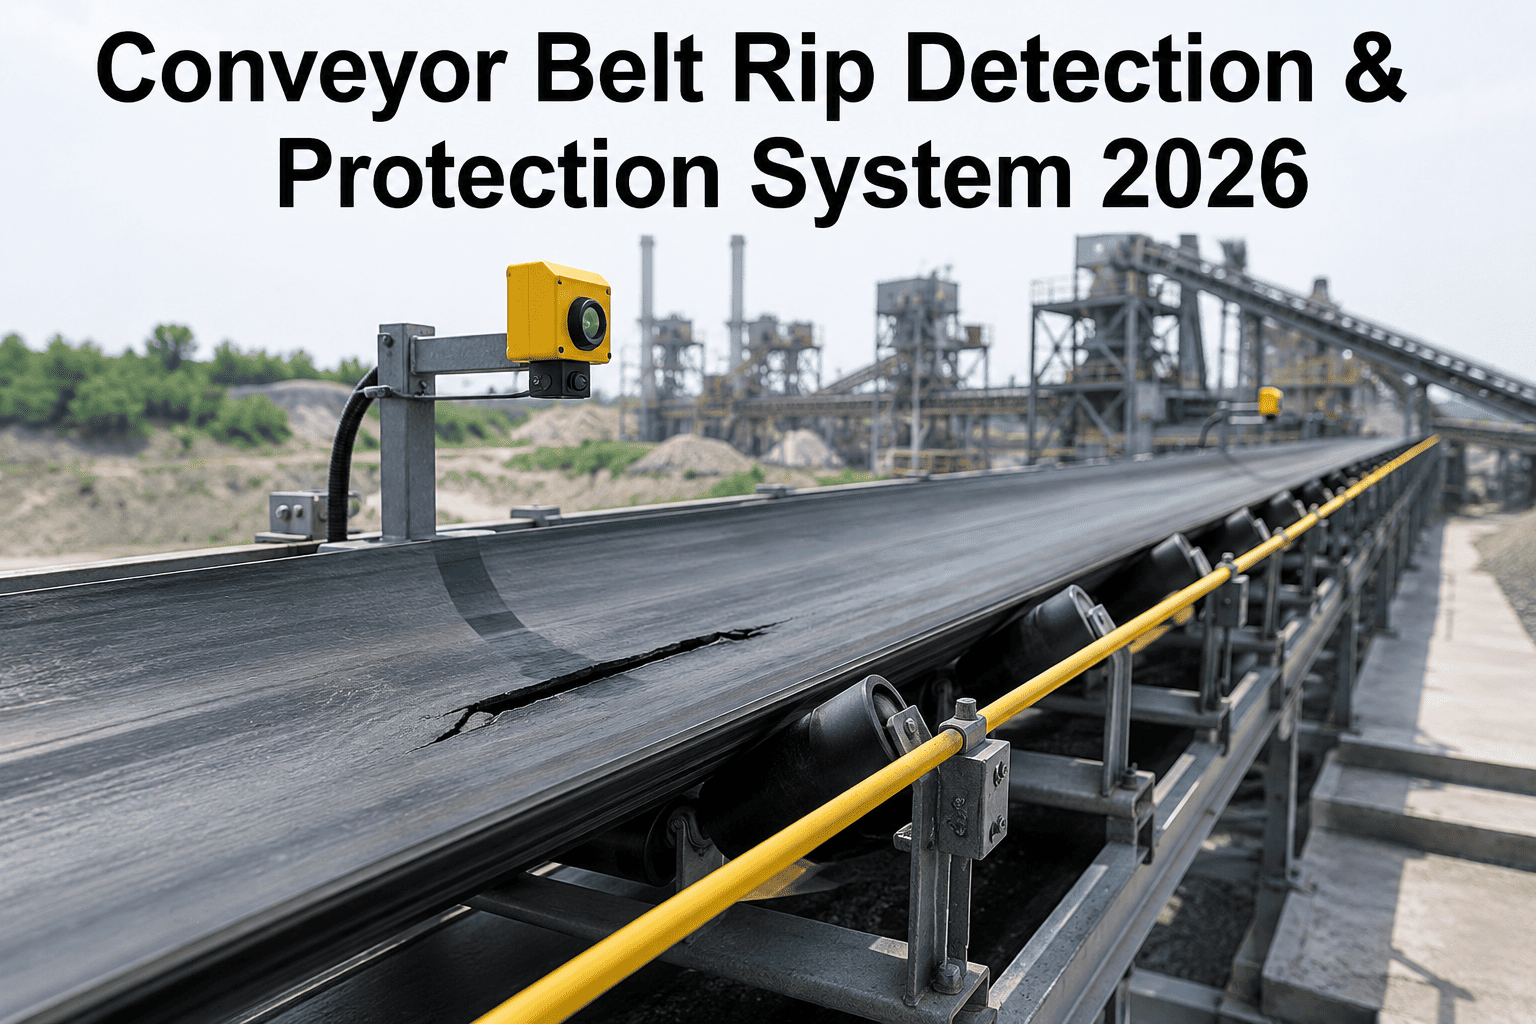
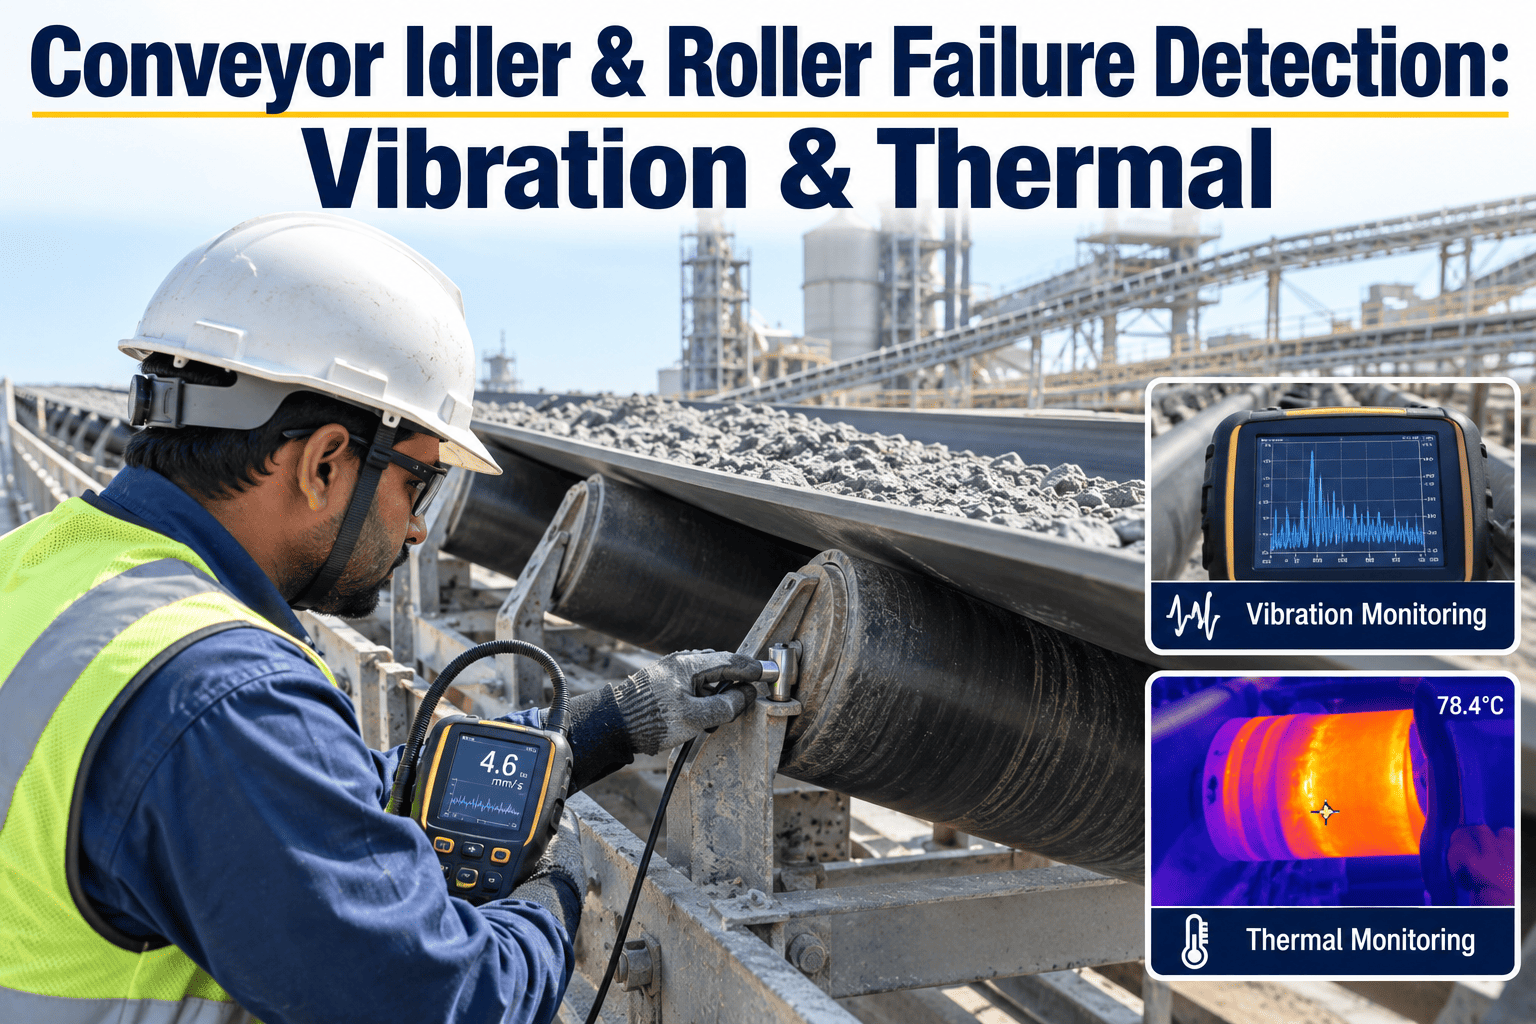
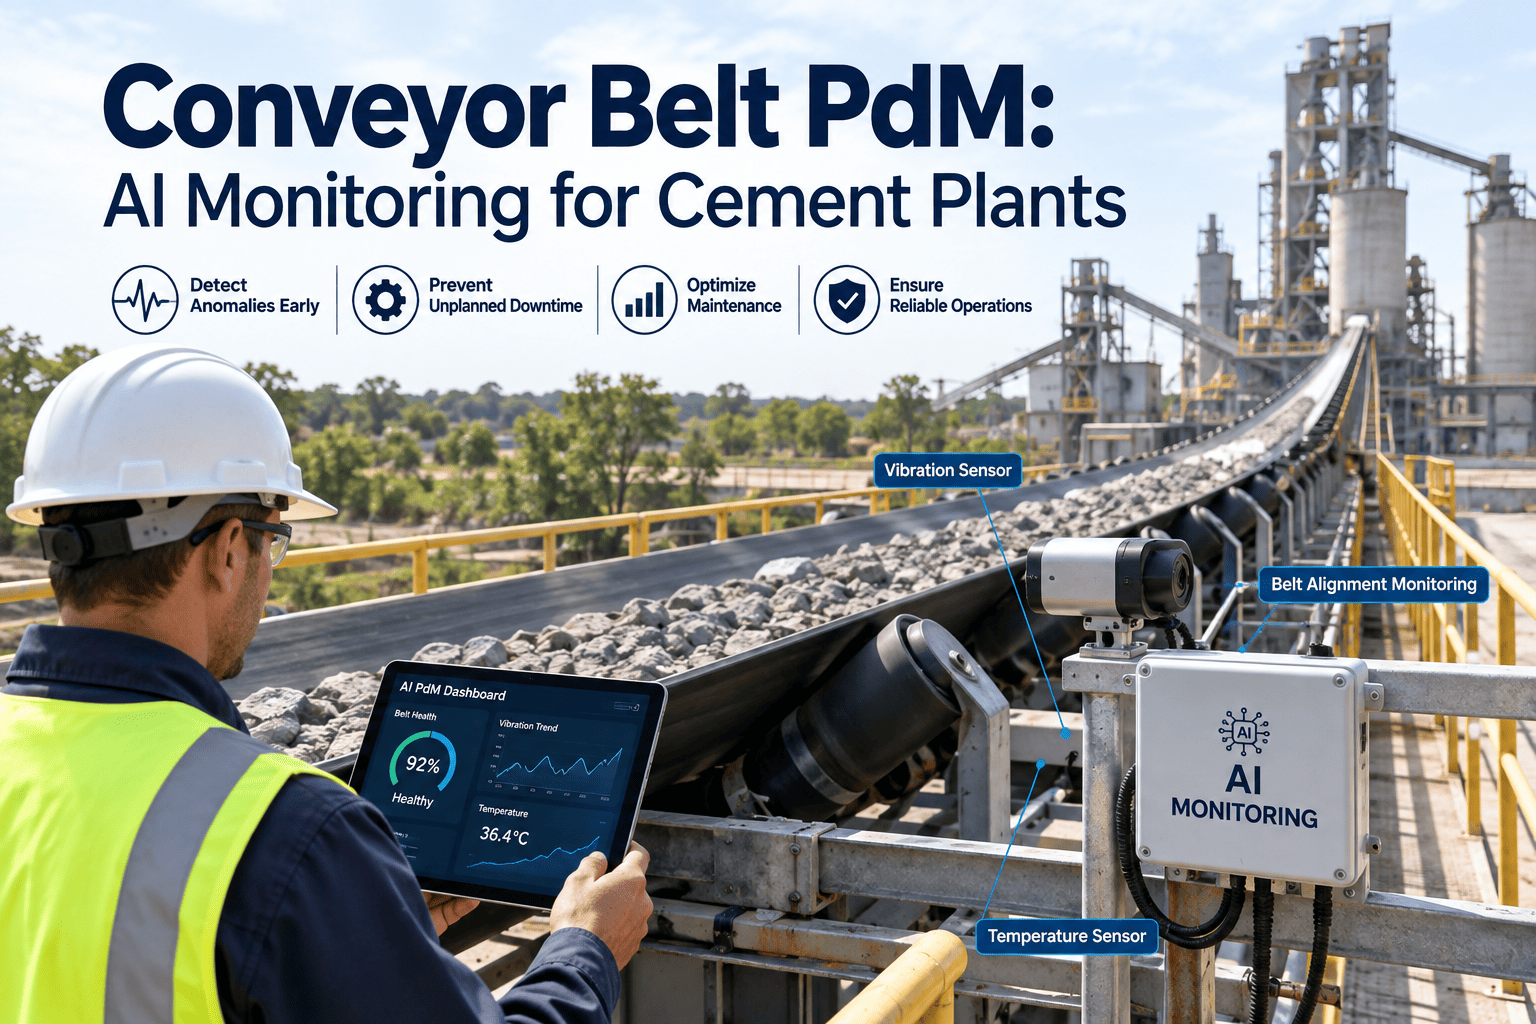
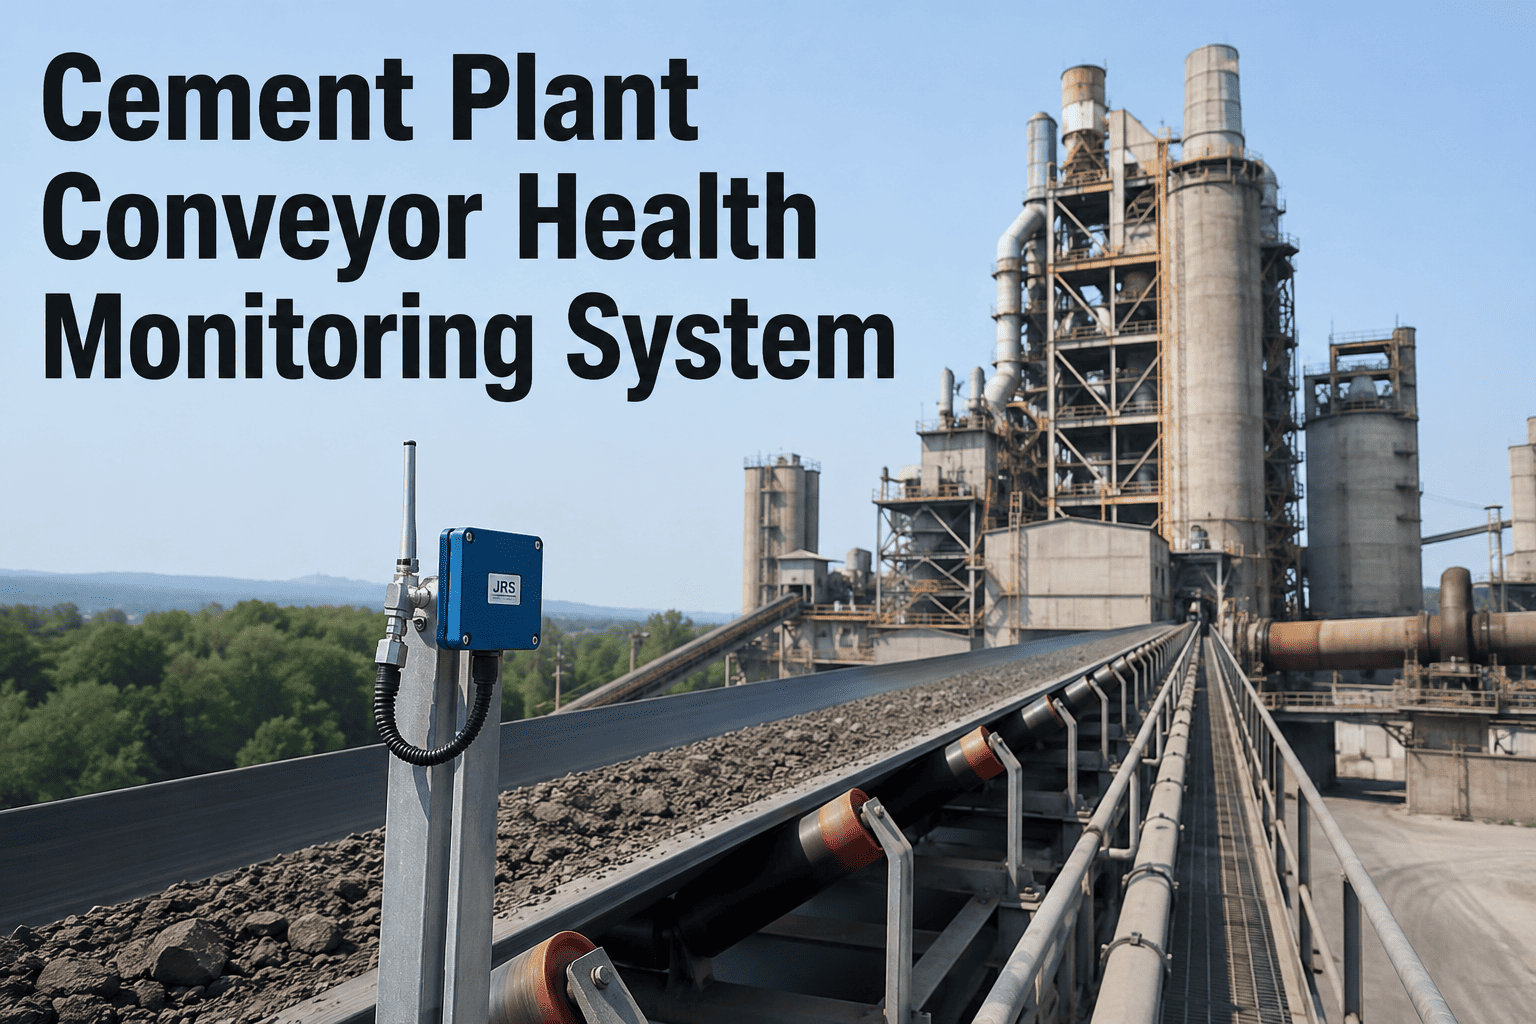
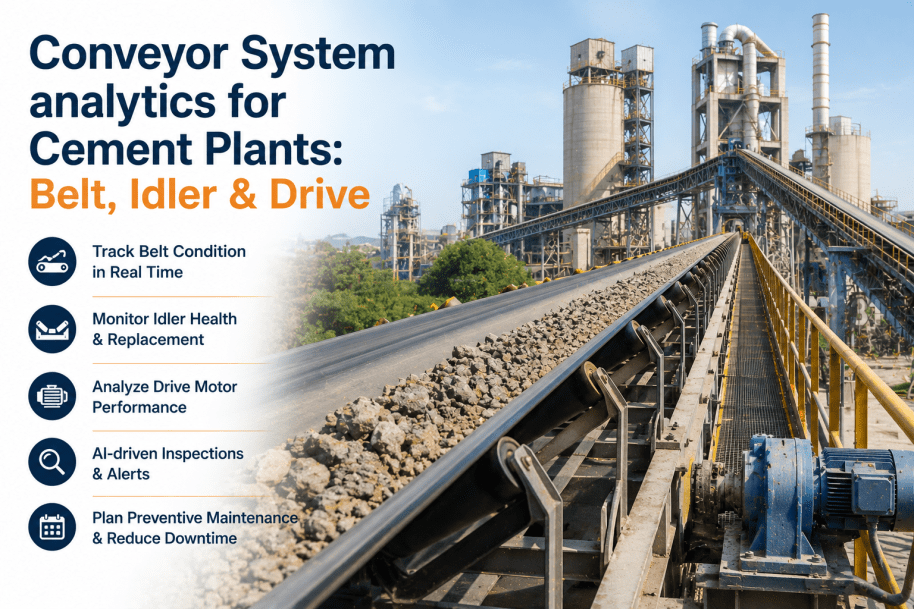
A typical cement plant operates 8 to 15 kilometers of conveyor belts moving limestone, raw meal, clinker, and finished cement around the clock. When a single idler roller seizes, the friction gouges the belt underside, and a full rip on a kiln feed conveyor can halt production for 2 to 5 days at over $100,000 per hour. Most plants still rely on walk-by inspections with flashlights, finding problems only after damage has begun. Predictive maintenance using acoustic sensors, thermal imaging, and vibration analysis detects failing rollers weeks before they harm the belt. Book a demo to see how iFactory monitors your entire conveyor network.
Cement Conveyor Intelligence
15 km of Conveyors, 24,000 Rollers, and No Way to Know Which One Fails Next
Predictive maintenance for belt condition, idler rollers, pulley lagging, and drive systems — catching failures weeks before they become production-stopping events.
Typical conveyor length in cement plants
8-15 km
Idler rollers requiring monitoring
15,000-30,000
Annual idler failure rate (unmonitored)
2-5%
Cost of main conveyor shutdown
$100K+/hr
Sources: Martin Engineering Conveyor Study, Continental Belt Systems Report, SKF Bearing Reliability Data
The 5 Critical Monitoring Zones on Every Cement Conveyor
Every conveyor in a cement plant has five distinct zones where failures originate, each with different failure modes, different monitoring needs, and different consequences if missed. A comprehensive PdM program must cover all five — monitoring only the drive end while ignoring the idler field is like putting a security system on the front door while leaving the windows open.
01
Head Pulley and Drive
Motor current signature and vibration
Gearbox temperature and oil level
Pulley lagging wear thickness
Belt slip and speed differential
02
Carry Side Belt
Belt rip and longitudinal tear detection
Belt tracking and edge wear
Splice condition monitoring
Cover wear and thickness measurement
03
Idler Roller Field
Bearing condition (acoustic emission)
Shell wear and flat spot detection
Roller alignment and frame condition
Carry and return roller differentiation
04
Return Side Belt
Carry-back material buildup
Return roller bearing condition
Belt cleanliness and cleaning efficiency
Bottom cover wear assessment
05
Tail Pulley and Take-Up
Take-up tension and travel range
Tail pulley bearing condition
Snub pulley lagging integrity
Counterweight or hydraulic tensioner status
Critical — Failure stops production
High — Failure degrades performance rapidly
Where Conveyor Failures Hide and What They Cost
Six failure modes account for over 95% of unplanned conveyor downtime in cement plants. Each has a distinct signature that predictive technologies can detect — but only if you are monitoring the right parameter at the right frequency. The gap between reactive and predictive is not incremental. It is the difference between a planned roller change during a shift break and an emergency belt replacement that shuts down the kiln line.
Critical
Idler Bearing Seizure
Frequency:300-1,200/yr
Cost/event:$500-$2,000
Acoustic emission sensors detect bearing degradation 6-8 weeks before seizure, when the roller can be changed during a scheduled stop.
Critical
Belt Rip and Longitudinal Tear
Frequency:1-3/yr
Cost/event:$200K-$1M
Embedded rip detection sensors or visual AI systems catch tears within seconds, triggering automatic stop before the belt is destroyed beyond repair.
High
Pulley Lagging Delamination
Frequency:4-8/yr
Cost/event:$15K-$40K
Thermal imaging and belt slip monitoring detect lagging loss early. Once lagging fails, belt slip accelerates and can destroy both pulley and belt within days.
High
Belt Misalignment
Frequency:20-50/yr
Cost/event:$5K-$20K
Laser alignment sensors and edge-detection cameras flag drift in real time, allowing adjustment before the belt contacts structure and sustains edge damage.
Medium
Belt Splice Failure
Frequency:2-5/yr
Cost/event:$50K-$150K
Visual AI systems monitor splice condition during operation, detecting cord separation, edge deterioration, and rubber pull-out before catastrophic splice separation.
Medium
Drive Motor Overheating
Frequency:3-6/yr
Cost/event:$10K-$30K
Motor current signature analysis and winding temperature monitoring detect insulation degradation, unbalance, and overload conditions weeks before thermal trip.
The Idler Roller Crisis: Where 80% of Conveyor Headaches Start
Idler rollers are the most numerous and most neglected components in any cement conveyor system. A single seized roller creates a flat spot that grinds against the belt like a grinding wheel — and with 24,000 rollers in a typical plant, even a 3% failure rate means 720 potential belt-damaging events per year. The economics are unambiguous: monitoring rollers is cheaper than replacing belts they destroy.
24,000
Average idlers per cement plant
480-1,200
Failures per year at 2-5% rate
6-8 Wk
Acoustic early warning window
85%
Belt damage reduction with PdM
The Seizure-to-Damage Chain
A failing bearing generates heat and increases rotational resistance. Within 24-48 hours, the roller stops rotating and develops a flat spot. This flat spot contacts the belt on every revolution, abraiding the bottom cover. Within 1-2 weeks, the abrasion penetrates the carcass and a longitudinal rip begins — destroying a belt worth $200,000-$1,000,000.
Why Walk-By Inspections Miss 90% of Failures
Human inspectors can hear a severely failed squealing roller, but the bearing degradation that leads to failure produces high-frequency acoustic emissions inaudible to the human ear. By the time a roller is loud enough to hear during a walk-by, the bearing is already in advanced failure and belt damage may have already started. Acoustic monitoring sensors detect the same degradation 6-8 weeks earlier.
The True Cost of One Missed Roller
A single seized idler that goes undetected for 3 weeks causes bottom cover abrasion costing $5,000-$15,000 in belt life reduction. If it progresses to a longitudinal rip before detection, the cost escalates to $200,000-$1,000,000 for belt replacement plus 2-5 days of production downtime at $100,000+ per hour. The roller itself costs $150-$500 to replace.
Monitoring Technology Match: What Catches What
No single monitoring technology catches every conveyor failure mode. Effective PdM programs layer multiple technologies, each covering the blind spots of the others. The matrix below shows which technologies detect which failure modes — and where the dangerous gaps exist if you rely on only one approach.
| Technology |
Bearing Wear |
Belt Rip |
Misalignment |
Lagging Wear |
Splice Failure |
Motor Issues |
| Acoustic Monitoring |
High |
Medium |
Low |
None |
Low |
None |
| Vibration Analysis |
High |
None |
Medium |
Low |
None |
High |
| Thermal Imaging |
Medium |
None |
None |
High |
None |
Medium |
| Visual AI Systems |
Low |
High |
High |
Medium |
High |
Low |
| Tension Monitoring |
None |
Medium |
Medium |
None |
Medium |
Low |
| Laser Alignment |
None |
None |
High |
None |
None |
None |
High effectiveness — primary detection method
Medium — secondary or supporting detection
Low — limited or indirect detection capability
None — cannot detect this failure mode
Which of Your 24,000 Rollers Is Failing Right Now?
iFactory's predictive maintenance platform connects acoustic, vibration, and thermal data from your conveyor systems — ranking every roller by failure risk and generating work orders before belt damage starts.
4-Step Deployment: From Walk-By Inspection to Full Predictive Coverage
Deploying conveyor PdM across a cement plant does not require a big-bang approach. The most successful programs start with the highest-impact conveyors, prove value quickly, and expand systematically. Here is the deployment path that leading cement plants follow to go from zero monitoring to full predictive coverage within 12 months.
01
Week 1-2
Audit and Prioritize
Map every conveyor by criticality ranking — which conveyors feed the kiln, which handle finish grinding, which have spare capacity. Identify the top 10 highest-impact systems where PdM delivers the fastest ROI. Document current failure history and maintenance costs for baseline comparison.
02
Month 1-3
Install Critical Conveyors
Deploy acoustic monitoring on kiln feed and raw mill conveyors first — these carry the highest downtime cost. Install vibration sensors on head and tail pulley drives. Set up the data platform and begin establishing baseline readings for each monitored component. First failing rollers typically identified within the first week of data collection.
03
Month 4-6
Expand to Full Plant
Extend acoustic monitoring to all major conveyors — clinker transport, cement mill feed, gypsum handling, and shipping. Add thermal imaging for pulley lagging and visual AI for belt tracking on critical splices. Integrate conveyor data with the CMMS for automated work order generation when thresholds are exceeded.
04
Month 7-12
Predictive Intelligence
AI models trained on 6+ months of data begin predicting remaining useful life for individual rollers and belts. Maintenance scheduling shifts from condition-based to predictive — planning roller replacements weeks in advance during scheduled stops. Cross-conveyor analytics identify systemic issues like contamination patterns or tension problems affecting multiple systems.
The Cost of Waiting: Reactive vs Predictive Conveyor Maintenance
The financial gap between reactive and predictive conveyor maintenance is not a marginal improvement — it is a structural cost reduction that transforms conveyor reliability from an uncontrollable expense into a managed, predictable budget line. The numbers below represent a mid-size cement plant with 15 km of conveyors and 24,000 idler rollers.
Annual Roller Replacement
Belt Replacement and Repair
Unplanned Downtime Losses
Inspection and Patrol Labor
Reactive Total
$1.62M/year
Predictive Total
$365K/year
Frequently Asked Questions
Which conveyor components should be included in a cement plant PdM program first?
Start with idler rollers on kiln feed and raw mill conveyors because these carry the highest downtime cost and have the highest failure volume. Then add head pulley drive monitoring — motor vibration, gearbox temperature, and pulley lagging condition. Third priority is belt condition monitoring on the same critical conveyors using rip detection and visual AI for splice tracking. Return side rollers and tail pulley monitoring come fourth, followed by secondary conveyors like gypsum handling and cement shipping.
Book a demo to see iFactory's conveyor prioritization framework.
How does acoustic monitoring detect failing idler rollers before they seize?
Acoustic emission sensors mounted along the conveyor structure detect high-frequency sound waves generated by bearing surface contact degradation. As a bearing begins to fail, the contact surfaces develop micro-cracks and spalls that produce acoustic signatures in the 20-100 kHz range — far above human hearing. The monitoring system tracks these emissions over time, establishing a trend that shows degradation velocity. When the trend crosses a calculated threshold, the system flags the specific roller location for replacement, typically 6-8 weeks before the bearing would seize and damage the belt.
Can predictive maintenance actually prevent belt rips and longitudinal tears?
PdM prevents most belt rips indirectly by eliminating the root cause — seized idler rollers that abrade the belt bottom cover until the carcass is exposed and tears. By replacing failing rollers before they seize, you remove the primary mechanism that initiates longitudinal tears. For rips caused by foreign objects like tramp metal or large rock fragments, embedded electronic rip detection loops in the belt or visual AI systems monitoring the belt surface provide direct detection within seconds, triggering an automatic stop before the tear propagates beyond the damaged section.
What is the cost difference between reactive and predictive conveyor maintenance?
For a mid-size cement plant with 15 km of conveyors and 24,000 idler rollers, reactive maintenance typically costs $1.4M-$1.8M annually when you account for emergency roller replacements, premature belt replacements, unplanned downtime losses, and manual inspection labor. A mature predictive program reduces this to $300K-$420K — a 75-78% cost reduction. The single largest savings category is unplanned downtime, which drops from $600K-$1M to under $100K when failures are caught and scheduled in advance.
Contact our support team for a customized ROI calculation for your plant.
How long does it take to deploy conveyor monitoring across a cement plant?
Critical conveyors — typically the kiln feed and raw mill systems — can be fully instrumented with acoustic sensors and drive monitoring within 2-4 weeks. Full plant coverage across all major conveyors takes 3-6 months depending on plant size and number of conveyors. Predictive AI models that forecast remaining useful life for individual rollers and belts require 4-6 months of operational data to reach full accuracy. Most plants see their first detected and prevented failure within the first 2-3 weeks of monitoring, and the program typically pays for itself within the first 90 days through avoided downtime alone.
Every Day Without Conveyor PdM Is Another Day of Invisible Belt Damage
iFactory deploys acoustic monitoring on your critical conveyors in weeks — ranking every roller by failure risk, generating automated work orders, and giving your team the early warning that walk-by inspections can never provide.