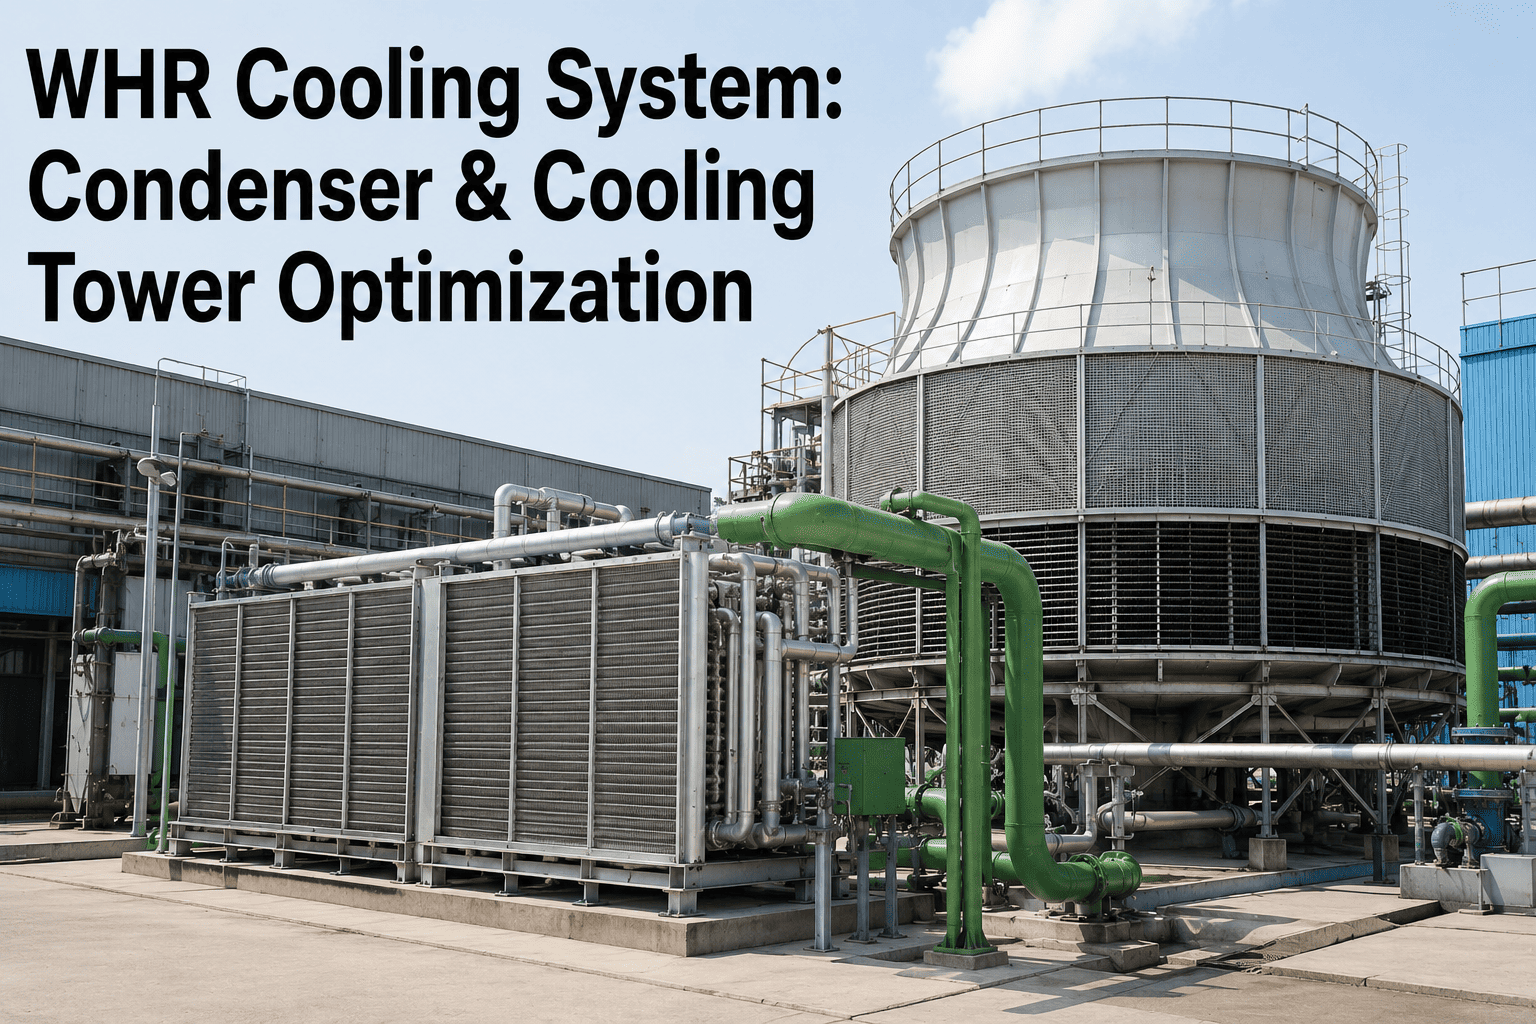
A WHR (waste heat recovery) power block only performs as well as its cooling system lets it. Boiler design, turbine selection, and steam header pressure get most of the attention during commissioning, but once the plant is running, generating capacity swings with condenser vacuum and cooling tower approach temperature more than almost any other single variable. A poorly performing condenser or a fouled, undersized cooling tower can quietly cost a cement plant 10 to 15 percent of its installed WHR capacity for months before anyone traces the shortfall back to the cooling loop. Plants that track vacuum, approach temperature, and fouling trends in real time catch this drift early and hold onto the capacity they paid for — book a demo to see how AI-driven cooling system monitoring works inside a live WHR plant.
CEMENT · WASTE HEAT RECOVERY · COOLING SYSTEMS
WHR Cooling System Optimization: Condenser and Cooling Tower Performance for Maximum Power Output
Every megawatt your WHR plant was designed to produce depends on a vacuum number most operators check once a shift and a cooling tower most plants never model against ambient conditions. Here is what actually controls generating capacity on the cooling side, and how AI monitoring keeps it from drifting away.
Condenser vacuum is the single number that ties cooling performance directly to turbine output
Why Condenser Vacuum Sets Your WHR Generating Ceiling
The WHR turbine expands steam against whatever backpressure the condenser can hold. A deeper vacuum means a longer, more complete expansion and more work extracted per kilogram of steam. A shallow vacuum means the turbine is fighting backpressure it was never designed to run against, and the plant loses output that the boiler already generated and paid the fuel-equivalent cost for — except in WHR, that fuel is free waste heat, which makes every lost megawatt purely a cooling-system problem, not a combustion one.
-0.65 bar (a)
72% output
-0.75 bar (a)
86% output
-0.84 bar (a)
100% output
Illustrative relationship at fixed steam flow and inlet conditions. The exact curve depends on turbine stage design, but the direction is universal: a 0.1 bar loss in vacuum routinely costs 10 to 15 percent of rated generating capacity in single-condensing WHR turbines.
Condenser Performance: What Is Actually Eating Your Vacuum
Vacuum does not degrade on its own — it degrades because heat transfer across the condenser tubes is getting worse, or because air is entering a system designed to run below atmospheric pressure. Both problems are gradual, both are invisible on a control room trend that only shows the final vacuum number, and both compound each other once they start.
Degradation Source
What It Looks Like
Typical Vacuum Impact
Tube-side fouling (scale, silt, biofilm)
Rising cooling water outlet temperature at constant flow
0.03–0.08 bar per fouling cycle
Air in-leakage through glands, joints, expansion bellows
Rising non-condensable gas load, vacuum pump running harder
0.05–0.15 bar depending on ingress rate
Tube pitting and under-deposit corrosion
Localized heat transfer loss, eventual tube leaks
Progressive, accelerates fouling above
Waterbox air binding / uneven flow distribution
Some tube bundles running hot, others starved of flow
0.02–0.06 bar, often missed on average readings
Cooling water inlet temperature rise
Follows cooling tower approach degradation, see below
Direct pass-through, no condenser fix available
See Your Own Condenser and Tower Data Modeled First
Send 6 to 12 months of vacuum, cooling water temperature, and ambient wet bulb readings. iFactory engineers return an expected recoverable-capacity estimate before you commit to any cleaning or retrofit spend.
Cooling Tower Efficiency: Approach, Range, and the Wet Bulb Ceiling
The condenser can only be as good as the water arriving at its inlet, and that water temperature is set entirely by the cooling tower's approach to ambient wet bulb temperature. This is the number most WHR plants never model against their own local climate data, which is exactly why capacity loss in the hot season gets blamed on "summer conditions" instead of being planned for as a design constraint.
RANGE
The temperature drop the tower achieves across the fill, driven by heat load and water flow. A shrinking range at constant load usually means fill degradation or airflow loss, not a condenser problem.
APPROACH
How close the cold water temperature gets to ambient wet bulb. A well-maintained tower holds a 4 to 6 degree approach. A degraded tower can drift to 8 to 10 degrees without any alarm firing.
WET BULB CEILING
No cooling tower can deliver water colder than ambient wet bulb temperature. This is a physical limit, not a maintenance target — which makes tracking approach against it the only honest efficiency metric.
Seasonal Swing: Why the Same Tower Behaves Differently Every Quarter
A cooling tower sized correctly on paper still produces very different condenser inlet temperatures across a full year, because wet bulb temperature and fouling rate both move with the season. Most WHR generation shortfalls that get reported as "seasonal" are actually the same underlying approach-temperature drift showing up at a worse baseline.
Season
Typical Wet Bulb Shift
Compounding Factor
Net Capacity Effect
Peak summer
+6 to +10°C vs annual average
Algae and scale growth accelerate with water temperature
Largest single-quarter capacity loss
Monsoon / high humidity
Wet bulb stays elevated even as dry bulb falls
Fill fouling from airborne dust and biological growth
Approach degrades faster than expected
Winter / dry season
-8 to -12°C vs annual average
Best natural window to run tube cleaning and fill inspection
Capacity recovery opportunity, often missed
Fill Media Degradation
Scale buildup and biological fouling on fill surfaces reduce the air-to-water contact area, shrinking range and widening approach at the same time.
Drift and Blowdown Drift
Poor cycles-of-concentration control accelerates scale formation on both fill and condenser tubes, tying tower and condenser degradation together.
Fan and Airflow Loss
Belt slip, blade fouling, and louver misalignment quietly cut airflow, and range shrinks well before anyone checks the fan motor amperage trend.
Basin and Distribution Issues
Uneven water distribution across the fill creates dry zones that lose cooling capacity even when the tower looks fully wetted from the platform.
Vacuum Leak Detection: Finding Air In-Leakage Before It Costs a Full Bar
Air in-leakage is the fastest-moving of the vacuum killers because it does not just insulate the tubes like fouling does — it directly raises condenser pressure and forces the vacuum pump or ejector to work against a load it was never sized for. Most plants find leaks reactively, after the vacuum pump is already running continuously and generation has already dropped.
1
Baseline the non-condensable gas load
Track vacuum pump or air ejector run-time and discharge flow as a continuous trend, not a shift-log entry, so a slow upward creep is visible weeks before it affects turbine load.
2
Correlate vacuum drop against cooling water temperature
If vacuum falls while cooling water inlet temperature stays flat, the source is almost always air in-leakage or fouling, not the cooling tower — this single correlation cuts diagnosis time from days to hours.
3
Zone-test suspect boundaries
Low-load shaft glands, expansion joints, manway gaskets, and instrument connections on the low-pressure turbine casing and condenser neck account for most ingress points and should be tested in a fixed rotation.
4
Verify against a helium or ultrasonic scan
Once the trend narrows the search zone, a targeted scan confirms the exact joint or gland rather than an open-ended walkdown of the entire low-pressure casing.
5
Close the loop with a repair-and-recheck record
Log the vacuum recovery achieved by each repair so future leaks can be triaged by expected impact instead of by guesswork, and repeat offenders get flagged for a permanent fix rather than another patch.
How AI Monitoring Changes the Cooling System Picture
The physics above is well understood by every WHR operations team. What is missing in most plants is the continuous correlation between vacuum, cooling water temperature, ambient wet bulb, and equipment run signals that turns isolated readings into an early warning. That correlation is exactly what AI monitoring adds without changing a single piece of rotating equipment.
Real-Time Vacuum Trending Against Design Curve
Live vacuum is continuously compared against the expected value for current load and ambient conditions, so a genuine deviation shows up immediately instead of blending into normal shift-to-shift variation.
Tube Fouling Rate Prediction
Terminal temperature difference trends across the condenser are modeled forward to predict when fouling will cross the point where cleaning pays back faster than continuing to run degraded.
Cooling Tower Thermal Performance Analytics
Approach and range are tracked against live wet bulb data rather than a fixed design assumption, separating genuine tower degradation from expected seasonal swing.
Cleaning and Maintenance Schedule Optimization
Condenser cleaning, fill inspection, and cooling tower maintenance windows are recommended based on measured degradation rate, not a fixed calendar interval that misses fast fouling seasons and wastes effort in slow ones.
Before and After: A Cement Plant's WHR Cooling Recovery
A single-condensing WHR turbine at a 6,000 TPD cement line had been quietly losing generating capacity for eight months, with the shortfall attributed to "hot weather" in every monthly report. Continuous monitoring of vacuum, cooling water temperature, and wet bulb data told a different story once the correlation was run.
BEFORE
Condenser vacuum-0.71 bar (a)
Cooling tower approach9.4°C
Generating output78% of rated
DiagnosisAttributed to ambient temperature
AFTER
Condenser vacuum-0.82 bar (a)
Cooling tower approach5.6°C
Generating output96% of rated
DiagnosisFill fouling plus one confirmed air leak
The correlated trend isolated two independent causes running at the same time — degraded fill media widening the approach, and a single expansion-joint air leak eating into vacuum separately. Fixing only one would have recovered roughly half the lost capacity; the combined view is what got the plant back to 96 percent of rated output within one planned outage window.
Frequently Asked Questions
How much generating capacity can a poorly maintained cooling system actually cost a WHR plant?
In single-condensing WHR turbines, a 0.1 bar loss in condenser vacuum commonly costs 10 to 15 percent of rated output, and combined condenser fouling with cooling tower approach drift can push total losses well beyond that in plants that have gone multiple seasons without a correlated review. The economics are stark because the lost energy is waste heat that was already recovered from the kiln exhaust — the only thing standing between that heat and usable power is cooling system performance. Continuous monitoring is the fastest way to see the real number for your own plant; book a demo to have your vacuum and cooling water trends reviewed.
How do I know if a vacuum drop is coming from the condenser or from the cooling tower?
The fastest diagnostic is correlating vacuum against cooling water inlet temperature. If vacuum falls while cooling water inlet temperature stays flat, the cause sits inside the condenser — fouling, air in-leakage, or tube-side flow distribution. If vacuum falls in step with rising cooling water inlet temperature, the root cause is upstream at the cooling tower, most often approach degradation from fill fouling or airflow loss. Running this correlation manually from shift logs takes days; running it continuously against a live trend narrows the search to hours, and the same logic applies whether the plant is single-condensing or extraction-condensing.
What is a realistic target for cooling tower approach temperature in a cement plant WHR system?
A well-maintained mechanical-draft cooling tower typically holds a 4 to 6 degree Celsius approach to ambient wet bulb temperature. Approach values drifting toward 8 to 10 degrees usually indicate fill fouling, uneven water distribution, or reduced airflow from fan or louver issues, and each additional degree of approach translates directly into a hotter condenser inlet and a shallower achievable vacuum. Because wet bulb temperature itself shifts by season, the useful comparison is always approach against current wet bulb, not cold water temperature against a fixed calendar-month assumption — a distinction that continuous monitoring makes automatic.
How often should condenser tubes and cooling tower fill be inspected or cleaned?
Fixed calendar intervals routinely clean too early in slow-fouling seasons and too late in fast-fouling ones, which is why terminal temperature difference and approach-temperature trending are better triggers than a date on a maintenance calendar. A condenser holding a stable terminal temperature difference can safely extend its cleaning interval, while one showing an accelerating trend should be scheduled ahead of the next planned outage rather than waiting for it. The same logic applies to fill inspection, particularly heading into monsoon or high-dust seasons when fouling rates can double compared to dry-season baselines. For a plant-specific cleaning trigger threshold, iFactory support can walk through how the monitoring platform sets it from your own data.
Can AI monitoring actually recover lost capacity, or does it just report the problem?
Monitoring itself does not turn a wrench, but it changes what gets fixed and when, which is where the recovered capacity comes from. In the case profiled above, correlated monitoring separated two independent causes — fill fouling and an air leak — that would have looked like a single vague vacuum problem on a shift log, and fixing only the more visible one would have left roughly half the lost output on the table. The platform's role is turning scattered readings into a clear, ranked list of what to fix, in what order, and how much capacity each fix is expected to return, so maintenance teams stop guessing and start prioritizing by impact.
STOP LOSING GENERATING CAPACITY TO THE COOLING LOOP
Your WHR Plant Was Sized for More Power Than You Are Getting
Send your recent vacuum, cooling water temperature, and ambient wet bulb readings. iFactory engineers return an estimate of the capacity currently trapped in condenser fouling, air in-leakage, or cooling tower approach drift, plus a prioritized recovery plan — before you commit to any cleaning or retrofit spend.