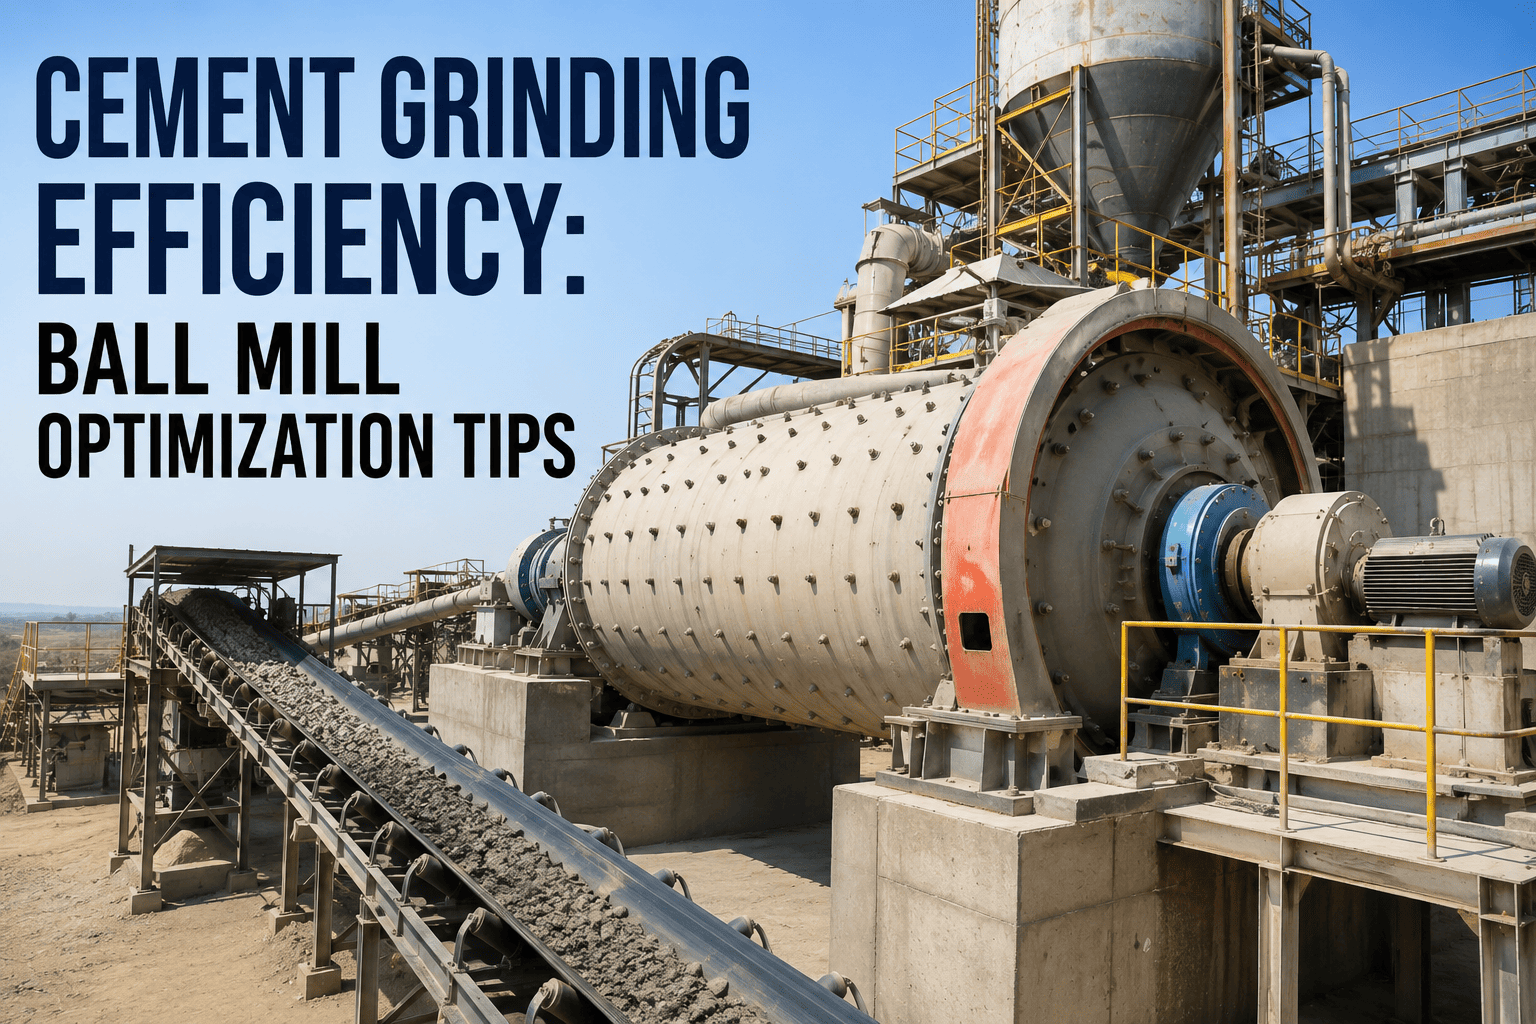
Every ball mill on your grinding line is either turning kilowatt-hours into fineness or quietly burning them into heat, noise, and worn steel. Grinding is the single largest electrical load in a cement plant, and a mill running even a few kWh per ton above its achievable baseline can cost a facility hundreds of thousands of dollars a year without a single alarm ever sounding. The frustrating part is that grinding efficiency is not a mystery — it responds predictably to three controllable levers, yet most plants let those levers drift for months between manual inspections. This guide breaks down exactly where grinding energy disappears, the benchmarks worth chasing, and how tracking ball charge, mill speed, and separator performance continuously with iFactory's monitoring platform turns that drift into recoverable savings.
CEMENT GRINDING · ENERGY OPTIMIZATION
Stop Paying For Kilowatt-Hours Your Mill Doesn't Need
Cement grinding routinely consumes 60 to 70 percent of a plant's total electrical draw, yet most ball mills operate at a small fraction of their theoretical energy efficiency. iFactory tracks ball charge, mill speed, and separator performance against your production data around the clock, so drift gets caught in hours instead of at the next quarterly audit.
Where Grinding Energy Actually Goes
Before optimizing anything, it helps to see the full scale of the number you are working with. Producing one ton of cement typically consumes somewhere between 85 and 120 kWh of electrical energy across the entire process, and grinding alone accounts for the largest share of it by a wide margin. Raw material crushing and grinding typically claims roughly a third of total plant power draw, while clinker finish grinding in the ball mill consumes an even larger share. At barely five percent thermodynamic efficiency, most of the energy fed into a conventional ball mill is converted into heat and noise rather than particle breakage — which is exactly why the gap between an average mill and a well-tuned one is so large.
60–70%
Share of total plant electrical load consumed by the grinding circuit alone
110–120
kWh consumed per ton of cement produced, across raw grinding and finish grinding combined
$250K+
Estimated annual savings for every 5 kWh per ton recovered at a 1 million ton per year plant
15–25%
Wasted energy typically recoverable from a ball mill with no prior optimization program
Specific Power Consumption Benchmarks By Mill Type And Chamber
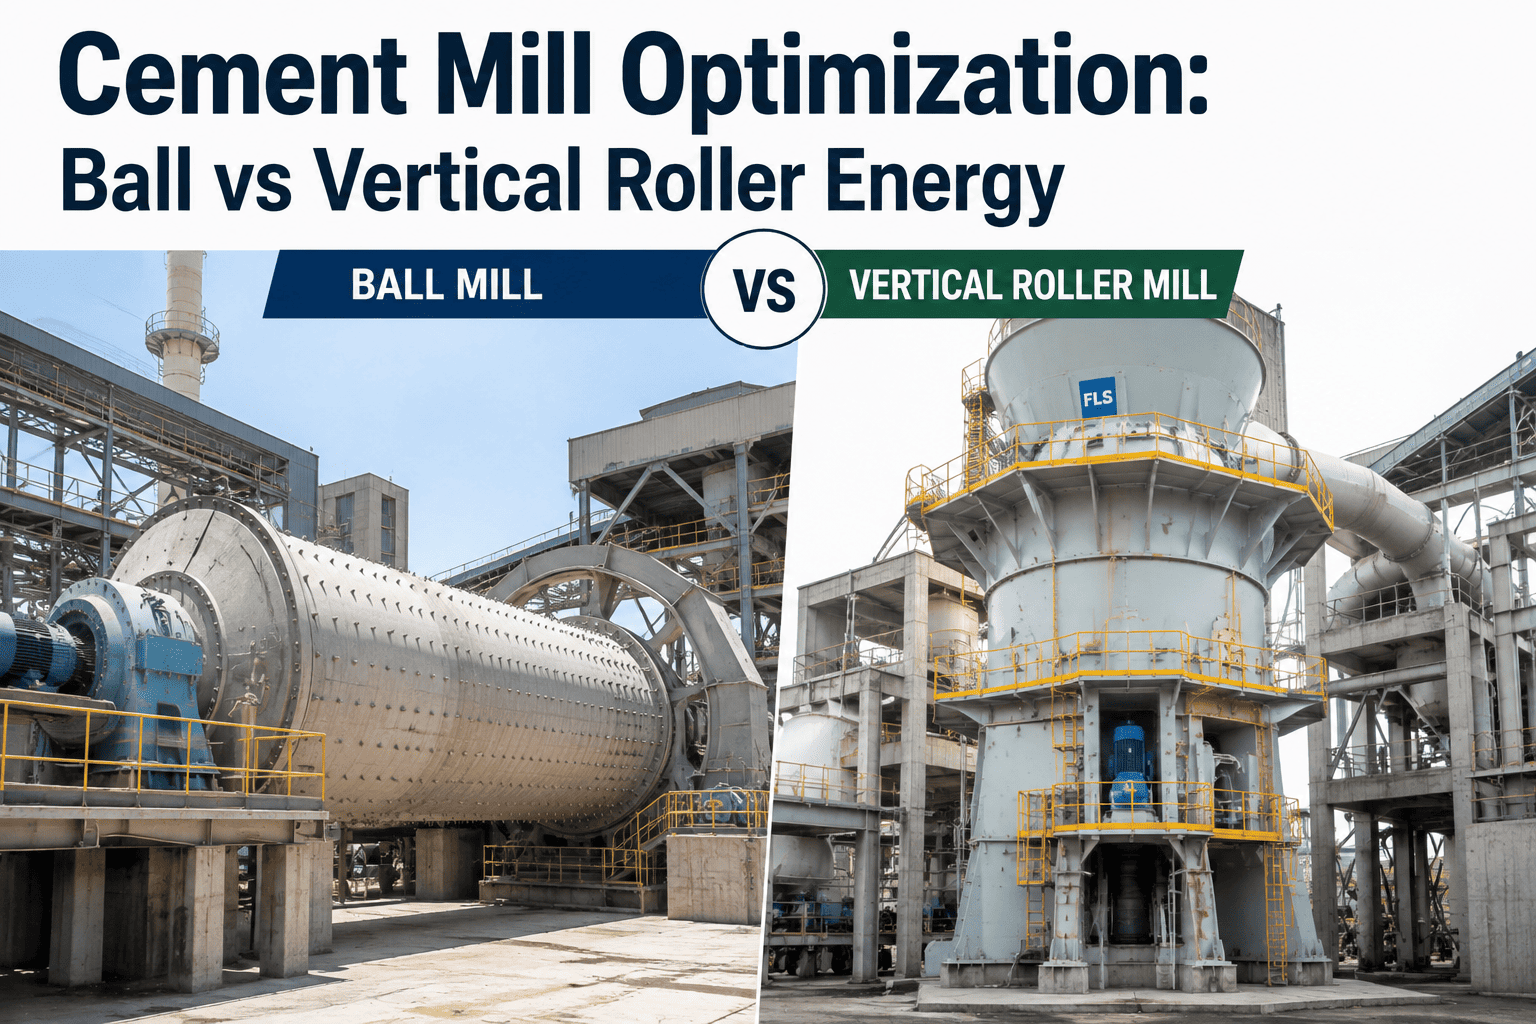
Benchmarking your mill against realistic targets is the first step toward a credible improvement plan, and the target depends heavily on mill technology and which grinding chamber you are looking at. A well-run first grinding chamber, where coarse clinker is broken down by larger balls, should sit in a fairly tight energy band. A second chamber, where fine grinding happens with smaller media, has its own separate target. Comparing your actual chamber-by-chamber numbers against the ranges below is usually enough to tell you which chamber is quietly wasting the most power.
| Grinding System |
Typical Specific Energy |
Best-In-Class Range |
Primary Efficiency Driver |
| Ball Mill — First Chamber |
8 – 12 kWh/ton |
Below 8 kWh/ton |
Ball charge grading and coarse liner condition |
| Ball Mill — Second Chamber |
12 – 18 kWh/ton |
Below 12 kWh/ton |
Fine media distribution and diaphragm airflow |
| Aging Ball Mill Circuit (Overall) |
33 – 40 kWh/ton |
25 – 30 kWh/ton |
Full-circuit tuning and separator generation |
| Vertical Roller Mill (Raw or Finish) |
20 – 25 kWh/ton |
15 – 20 kWh/ton |
Grinding bed stability and classifier speed |
| High-Pressure Grinding Rolls |
11 – 15 kWh/ton |
Below 11 kWh/ton |
Roll pressure and feed particle size control |
The Three Levers That Actually Move Your kWh Per Ton
Grinding optimization looks complicated from the outside, but almost every meaningful efficiency gain traces back to three controllable parameters. Get these three right and hold them there, and a mill that has never been formally optimized can typically recover fifteen to twenty-five percent of its wasted energy without any capital expenditure at all.
01
Ball Charge Design And Grading
Ball mills for cement grinding typically operate with a filling degree between 25 and 35 percent of total mill volume, and that number is one of the few adjustable parameters once mill diameter and liner shape are fixed. An undercharged mill loses six to eleven percent of its throughput capacity and produces fineness well below target, while an overcharged second chamber wastes energy grinding material that is already fine enough. Ball diameter distribution matters just as much as fill level — as media wears down without regrading, the charge drifts toward a size that no longer matches the material entering that chamber, and specific power consumption creeps upward by a couple of kWh per ton before anyone notices. Re-grading the charge every four to six months to restore the correct large-to-small ball ratio is one of the highest-return, lowest-cost interventions available in the entire grinding circuit.
02
Mill Speed And Critical Speed Ratio
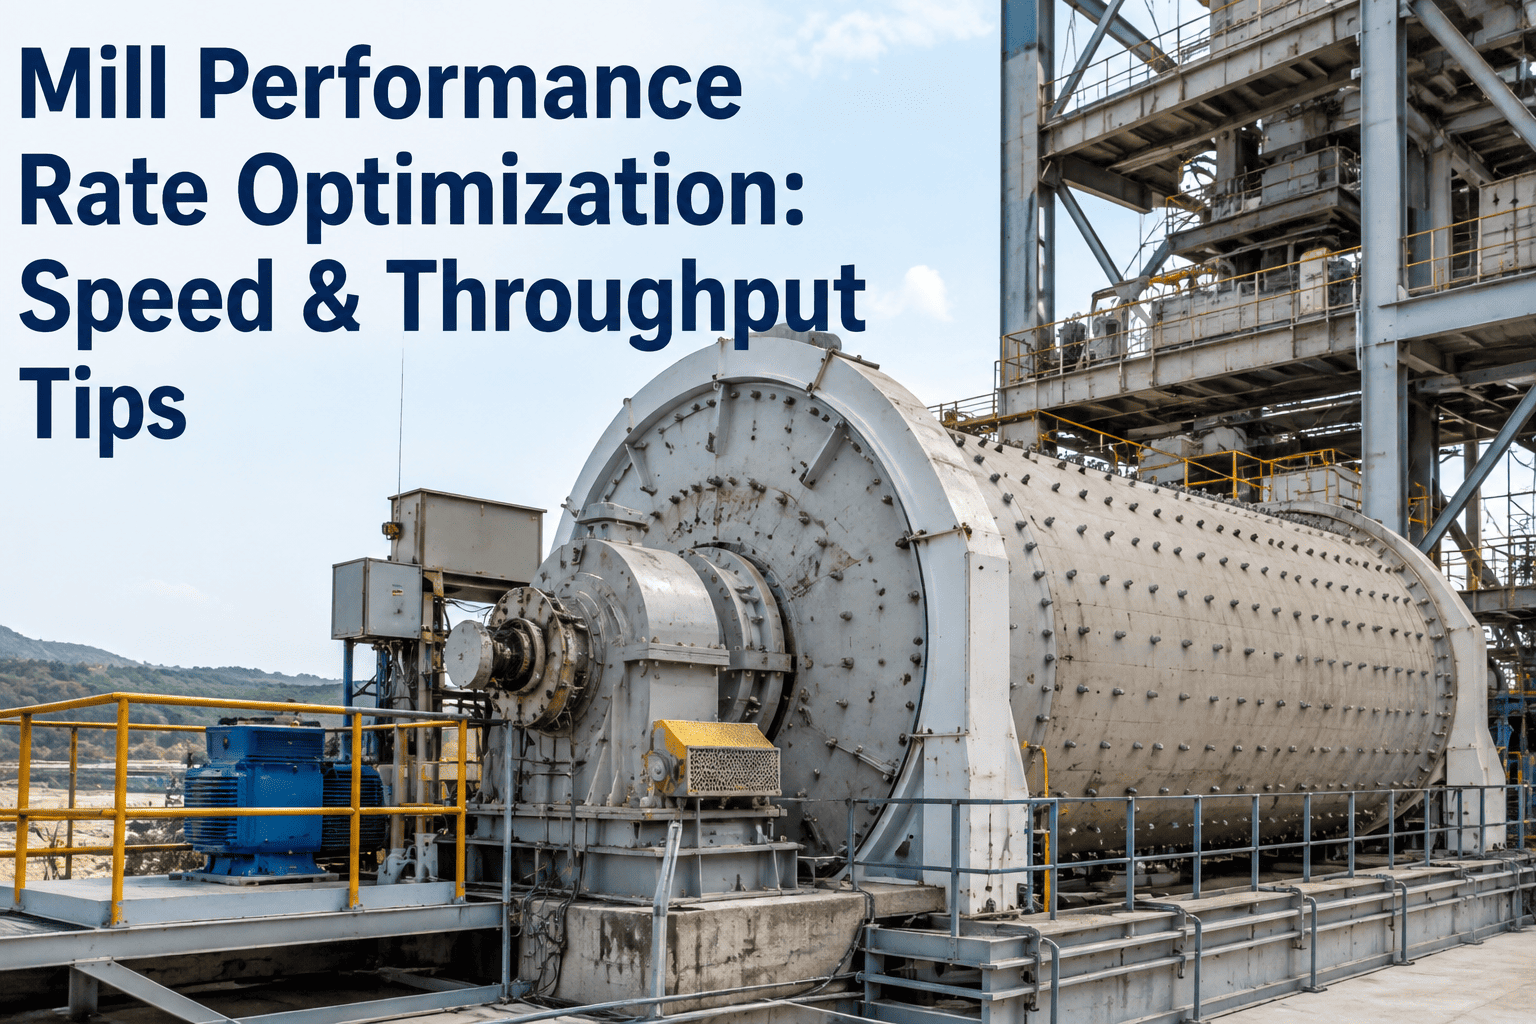
Most cement ball mills are designed to run at roughly seventy-five percent of critical speed, the theoretical rotation rate at which centrifugal force would otherwise pin the grinding media to the shell instead of letting it cascade. Run meaningfully below that ratio and the balls lack the kinetic energy to fracture clinker efficiently; run too close to critical speed and the media simply rides the wall instead of cataracting down onto the material bed. Liner lifter height plays directly into this relationship — once lifter height wears below roughly sixty percent of its original profile, media slip increases and specific power consumption can climb another three to five percent even with the mill still nominally running at its designed speed setting.
03
Separator And Classifier Efficiency
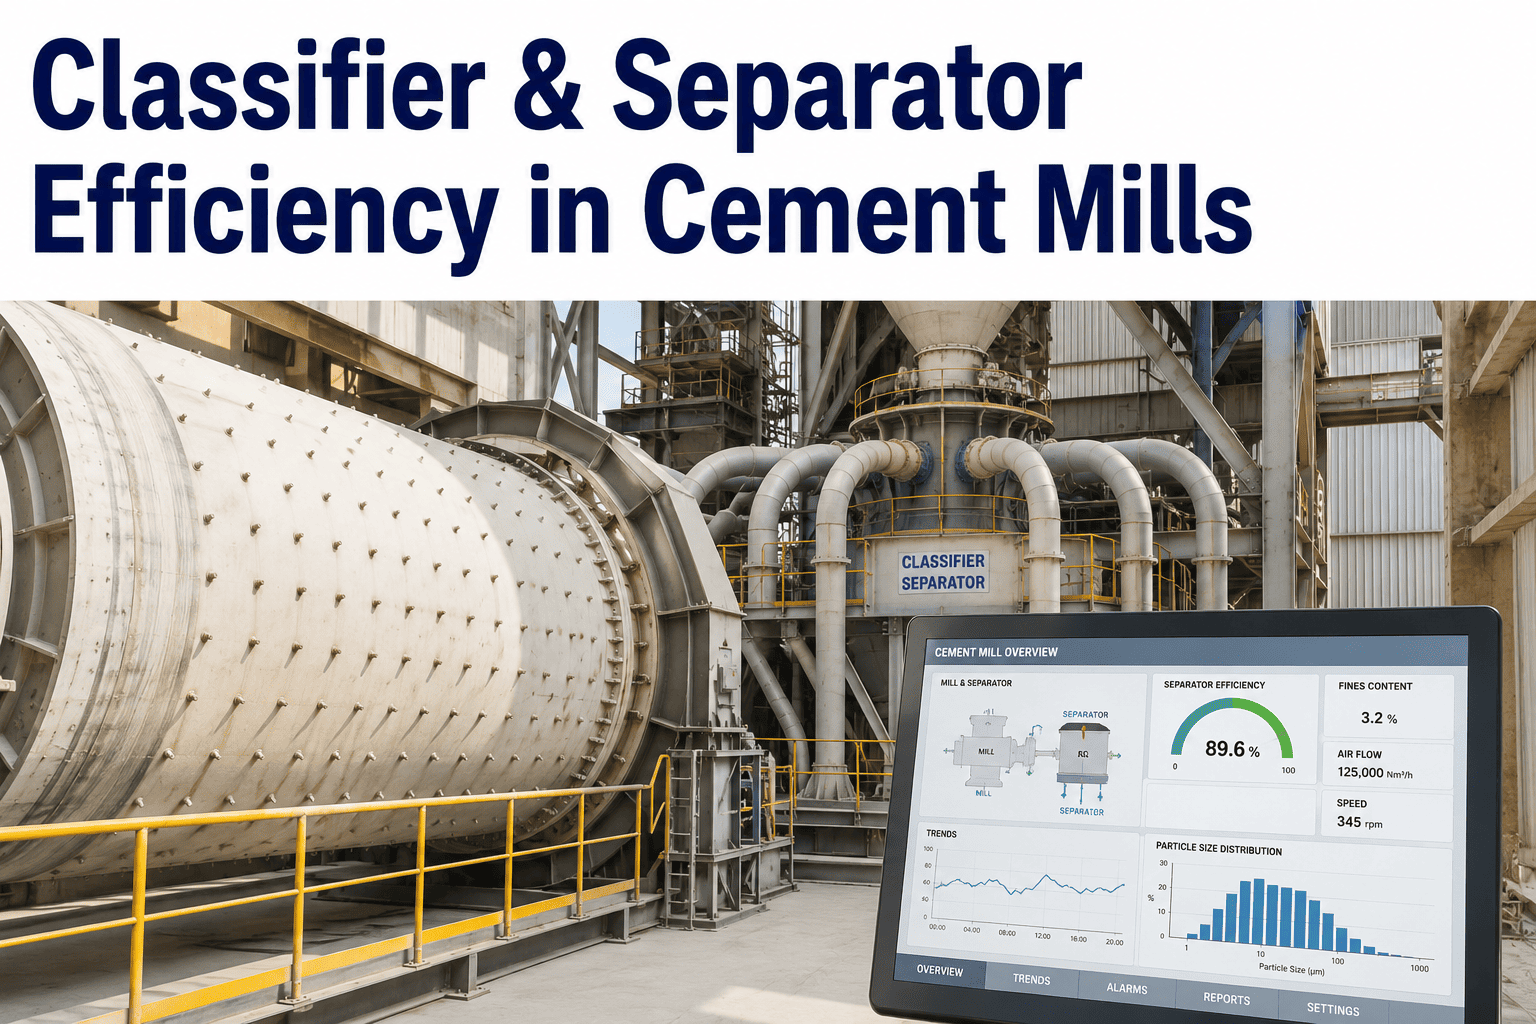
A grinding circuit is only as efficient as its separator, because every particle that gets classified as coarse and sent back through the mill for a second pass is energy spent twice. Older first and second-generation separators recirculate more material than necessary, while a modern high-efficiency classifier sharpens that cut and reduces recirculating load meaningfully. Rotor blade wear, guide vane condition, and reject cone geometry all degrade classification sharpness gradually, which is why separator efficiency should be checked on the same cadence as ball charge rather than only during a scheduled shutdown. Plugged or worn diaphragm slots compound the problem by starving the second chamber of properly classified material, so inspecting and cleaning the center diaphragm at every eight-week shutdown window keeps inter-chamber material flow balanced.
What A 4 kWh Per Ton Improvement Is Actually Worth
It helps to translate grinding efficiency out of engineering units and into a number a plant controller will recognize. A mill running 100 tons per hour at 38 kWh per ton is drawing roughly 3,800 kilowatts continuously, and at typical industrial electricity rates that single mill can burn through more than two million dollars a year in power alone. Shave four kWh per ton off that number through ball charge correction, liner attention, and separator tuning, and the same mill reclaims a meaningful six-figure sum annually without touching clinker factor, cement chemistry, or product quality in any way. Multiply that across every mill on site, and the case for treating grinding efficiency as a continuously monitored metric rather than a once-a-year audit item becomes hard to ignore. The plants that treat specific energy consumption the same way they treat safety metrics — tracked daily, reviewed weekly, and acted on immediately — are consistently the ones holding the lower end of the benchmark ranges rather than the higher end.
See Your Own Mill's Recovery Headroom, Chamber By Chamber
iFactory tracks kWh per ton against your mill's asset record automatically, flags deviations the moment they happen, and cross-references liner wear, ball charge level, and recent maintenance events as probable root causes — cutting energy investigation time dramatically.
Five Silent Ways Your Mill Is Leaking Efficiency Right Now
Grinding circuits rarely fail loudly. Efficiency erodes gradually, a fraction of a kWh per ton at a time, until the number has drifted far enough that a full audit is needed to explain it. Left uncorrected, these small leaks compound month over month, and the mill that was running near benchmark a year ago is quietly ten or fifteen percent worse today without a single equipment failure ever being logged against it. These are the five leaks that show up most often once a mill finally gets a proper energy review.
Product fineness sits 150–300 cm²/g below target
Usually traces back to an undercharged mill or a ball grading that has drifted too coarse for the material still arriving in that chamber.
Specific energy spikes by roughly 12 percent with no process change logged
Often connected to a recent maintenance event — a diaphragm repair, bearing replacement, or partial reline — that quietly changed the mill's operating dynamics.
Persistent excess residue building up at the intermediate diaphragm
A strong signal that chamber balance is off and that the second chamber is receiving material it is not properly sized to grind.
Grinding aid and media consumption climbing without a throughput increase
A classic sign of worn reverse-spiral or wave liners that have lost their classification effect, letting coarser media drift toward the discharge end.
Mill outlet temperature creeping above 110–120°C
Affects quality, energy, and downstream storage behavior simultaneously, and frequently points back to ventilation restriction from diaphragm blockage or an overloaded material bed.
Building A Repeatable Mill Optimization Program
A one-time tuning exercise buys a temporary improvement, but grinding circuits drift right back through liner wear, media degradation, and classifier fouling within months. A repeatable program is what actually holds the gains, and plants that pair disciplined operational tuning with a continuous monitoring rhythm routinely hold grinding energy eight to fifteen percent below industry benchmarks without sacrificing Blaine fineness or 28-day strength. The five stages below reflect the cadence that top-performing plants follow to keep grinding energy consistently below their peers.
Step 1
Establish The Chamber-By-Chamber Baseline
Log specific power consumption separately for each chamber rather than as a single mill-wide average, since the two chambers have entirely different target ranges and different root causes when they drift.
Step 2
Correct Ball Charge And Filling Degree
Bring filling degree back into the 25–35 percent range and re-grade the ball size distribution to match current feed characteristics rather than the original design curve.
Step 3
Verify Mill Speed Against Liner Condition
Confirm the mill is running near seventy-five percent of critical speed and check lifter height against nominal profile, since worn liners silently push effective speed off target.
Step 4
Tune Separator And Diaphragm Performance
Inspect rotor blades, guide vanes, and diaphragm slot openness on a fixed schedule, since classification sharpness degrades gradually and rarely triggers an alarm on its own.
Step 5
Monitor Continuously Instead Of Quarterly
Replace the periodic manual audit with continuous specific energy tracking so deviations are caught within hours of occurring rather than discovered months later at the next scheduled review.
Manual Quarterly Audits Versus Continuous AI Monitoring
The difference between a plant that holds its grinding gains and one that loses them again within a quarter almost always comes down to how the mill is monitored between formal reviews. A quarterly audit catches problems that have already been costing money for weeks or months, while continuous monitoring catches the same problem on the day it starts. The comparison below shows why continuous tracking consistently outperforms the traditional audit cycle, especially across a fleet of mills where manual review simply cannot scale.
Manual Quarterly Audit
Ball charge and liner condition checked only during scheduled shutdowns, leaving months of undetected drift in between.
Root cause analysis for an energy spike relies on an engineer manually cross-referencing maintenance logs after the fact.
Chamber-level specific energy is rarely isolated, so problems in one chamber get masked by an average across the whole mill.
Fleet-wide comparison across multiple mills or plants depends on manually compiled spreadsheets that are outdated by the time they are reviewed.
Continuous AI Monitoring
Specific energy is tracked against the mill's asset record around the clock, with deviations flagged the moment they occur.
Root cause candidates — liner wear, ball charge level, recent maintenance events — surface automatically alongside every anomaly.
Each grinding chamber is tracked independently, so a stalled second chamber never hides behind a healthy first chamber average.
Every mill across the site is normalized to the same view, making it simple to replicate a top-performing mill's settings fleet-wide.
Frequently Asked Questions About Cement Grinding Efficiency
What is a realistic kWh per ton target for a cement ball mill?
A reasonably well-tuned two-chamber ball mill circuit should be capable of running between 25 and 30 kWh per ton overall, with the first chamber sitting between 8 and 12 kWh per ton and the second chamber between 12 and 18 kWh per ton. Aging, unoptimized circuits commonly run at 33 to 40 kWh per ton or higher. You can benchmark your specific mill configuration by requesting a
demo of iFactory's grinding analytics against your own production data.
How often should ball charge be inspected and re-graded?
Most grinding circuits benefit from a full ball charge re-grading every four to six months to restore the correct large-to-small media ratio, since natural wear otherwise lets specific power consumption creep upward by a couple of kWh per ton without anyone noticing. Filling degree and lifter height should be checked more frequently, ideally every couple thousand operating hours, which is far easier to sustain with continuous monitoring than with manual logging alone.
Why does specific energy consumption vary so much between plants running the same mill type?
Two plants grinding the same feed material to the same fineness can post specific energy figures that differ by as much as forty percent, and mill type only explains part of that gap. Separator generation, classifier speed, ball charge condition, and grinding bed stability decide how close a plant actually gets to its mill's theoretical ceiling, which is why ongoing tuning matters just as much as the original equipment selection.
Can grinding efficiency improvements be made without capital expenditure?
Yes. Ball charge re-grading, filling degree correction, separator inspection, and diaphragm cleaning are all operational interventions rather than capital projects, and a mill with no prior optimization program typically recovers fifteen to twenty-five percent of its wasted energy through these steps alone. Larger gains beyond that point usually require separator upgrades or liner replacement, which can be planned once the operational levers have been exhausted.
What data does a grinding optimization platform need to start delivering value?
The minimum useful inputs are mill power draw, throughput, product fineness readings, and a maintenance history covering liner and ball charge events. Most plants see actionable insight within the first few weeks once these are connected, without needing full sensor retrofits first. Reach out through
iFactory support to scope the data connections required for your specific mill configuration.
Ready To Find The kWh Per Ton Your Mills Are Wasting?
iFactory connects to your existing CMMS and mill instrumentation to track ball charge, mill speed, and separator performance continuously, surface the root cause the moment specific energy drifts, and show you exactly which mill on your site has the most recovery headroom.