Cement grinding accounts for 60 to 70 percent of the total electrical energy consumed in a cement plant, making mill optimization the single highest-ROI target for energy cost reduction in any grinding operation. A typical finish mill consuming 35 to 40 kWh per ton of cement at 3,500 Blaine represents $2.5 to $3.5 million in annual electrical energy cost for a 1-million-ton-per-year plant — and every 1 kWh per ton reduction in specific energy consumption saves $50,000 to $70,000 per year in power cost alone. The challenge is that mill performance depends on a dynamic interaction of separator speed, classifier vane position, grinding aid dosage, ball charge gradation, feed Blaine, and material moisture — variables that operators adjust based on lab fineness results that arrive 30 to 60 minutes after the sample was taken. By the time the lab reports that Blaine has drifted 200 points above target, the mill has already been over-grinding for an entire shift, wasting energy and reducing mill throughput. AI-driven mill analytics closes this feedback loop by predicting Blaine fineness, specific energy consumption, and separator performance from real-time mill parameters — enabling operators to maintain grind consistency within plus or minus 20 Blaine points while reducing specific energy consumption by 3 to 8 percent. Book a Demo to see how iFactory's Performance Analytics and Energy Monitoring modules optimize your cement mill grinding circuit.
Is Your Finish Mill Consuming 8 to 15 Percent More Energy Than Necessary?
iFactory's Performance Analytics and Energy Monitoring modules predict Blaine fineness, specific energy consumption, and separator efficiency in real time from mill process data — enabling operators to optimize grinding conditions on every shift and reduce energy cost by $150,000 to $500,000 per year on an on-premise NVIDIA edge server with read-only PLC connectivity.
Why Grinding Efficiency Is the Largest Variable Cost in Cement Production
The finish mill is the single largest electrical load in a cement plant, drawing 3,000 to 7,000 kW depending on mill size and product type — more than the kiln main drive, the preheater fans, or the clinker cooler. Unlike the kiln system, where fuel cost is the dominant variable, the mill's operating cost is almost entirely electrical energy, which means every efficiency gain translates directly to the bottom line with minimal offset from other variable costs. A finish mill operating at 38 kWh per ton that could be operating at 34 kWh per ton through optimized separator settings, ball charge management, and grinding aid dosage is wasting $200,000 to $280,000 per year in electrical energy for every 1 million tons of cement produced. The operators managing that mill are making real-time decisions about separator speed, feed rate, and reject rate based on lab fineness results that arrive 30 to 60 minutes after the sample was collected — a latency that guarantees the mill operates outside its optimal efficiency window for a significant portion of every shift. Book a Demo to model the grinding efficiency opportunity for your finish mill configuration and product mix.
Separator Performance Optimization
The high-efficiency separator determines the fineness of the finished product and the recirculation load that drives mill power consumption. AI predicts separator bypass percentage and efficiency from rotor speed, vane position, fan flow, and feed rate — enabling real-time adjustments that maintain target Blaine with minimal recirculation.
Ball Charge Wear Monitoring
Media wear changes the grinding profile inside the mill over time, reducing grinding efficiency and increasing specific energy consumption. AI tracks ball charge condition from mill power draw, sound level, and throughput — predicting when ball charge replenishment or sorting is needed based on efficiency trend rather than calendar schedule.
Grinding Aid Dosage Optimization
Grinding aid dosage is typically set at a fixed rate based on average conditions, but mill temperature, feed moisture, and Blaine target all affect the optimal dosage. AI recommends dosage adjustments from mill process conditions, reducing aid consumption by 8 to 15 percent while maintaining or improving mill throughput.
Blaine Fineness Prediction
Real-time Blaine prediction from mill power, separator speed, feed rate, and reject rate enables operators to maintain fineness within plus or minus 20 Blaine points of target — reducing the over-grinding that wastes energy when operators compensate for lab latency by running the mill on the high side of the fineness spec.
Mill Circuit Configuration and AI Optimization Levers
Cement grinding circuits vary in configuration — closed-circuit ball mill, open-circuit ball mill, vertical roller mill, or hybrid circuits with pre-grinders and separate classifiers — and each configuration requires a different AI optimization approach. The table below maps each mill type to its specific AI optimization levers, sensor inputs, and the efficiency improvement achieved in industrial deployments. Book a Demo to review the optimization model configured for your mill type.
| Mill Circuit Type | AI Optimization Levers | Primary Sensor Inputs | Efficiency Improvement | Implementation Complexity |
|---|---|---|---|---|
| Closed-Circuit Ball Mill | Separator speed, vane position, feed rate, grinding aid dosage, ball charge management | Mill power, sound level, separator speed, reject rate, feed and product fineness, ventilation flow | SEC reduction of 5 to 12 percent; throughput increase of 8 to 15 percent | Medium |
| Open-Circuit Ball Mill | Feed rate, ball charge gradation, mill ventilation, grinding aid dosage, compartment loading | Mill power, sound level, mill outlet temperature, feed moisture, product fineness | SEC reduction of 3 to 8 percent; fineness variability reduction of 40 to 60 percent | Lower |
| Vertical Roller Mill | Grinding pressure, table speed, dam ring height, separator speed, feed moisture, bed depth | Mill power, grinding pressure, table differential pressure, separator speed, bed vibration, product fineness | SEC reduction of 8 to 15 percent; throughput increase of 10 to 18 percent | High |
| Hybrid (Pre-Grinder + Ball Mill) | Pre-grinder power split, ball mill feed rate, separator settings, circulating load optimization | Pre-grinder power and throughput, mill power, separator parameters, circulating load, product fineness | SEC reduction of 10 to 18 percent; system throughput increase of 15 to 25 percent | High |
Specific Energy Consumption and Blaine Fineness Control
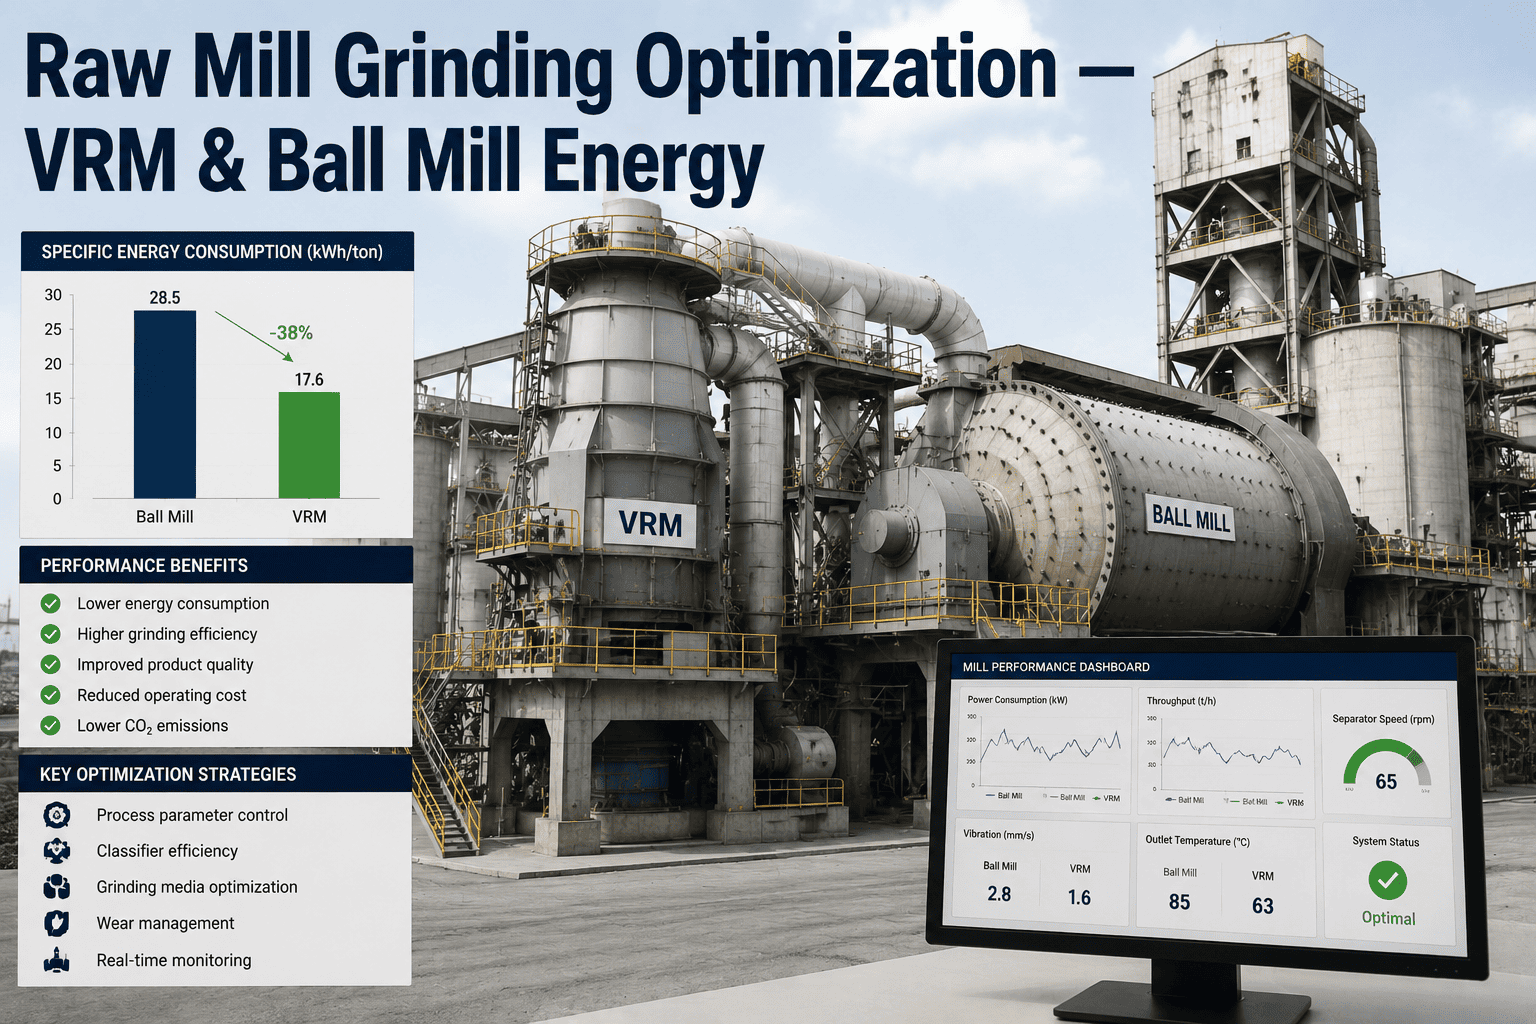
The relationship between specific energy consumption and Blaine fineness is the fundamental economic equation in cement grinding — a target Blaine of 3,500 requires approximately 35 kWh per ton, while 4,500 Blaine requires 50 to 55 kWh per ton, with the energy requirement increasing exponentially at higher fineness levels. The challenge is that operators typically run the mill on the high side of the fineness spec — adding a 100 to 200 Blaine safety margin — to avoid the risk of shipping out-of-spec cement that could trigger customer rejection or concrete performance issues. That safety margin costs 3 to 6 kWh per ton in unnecessary energy consumption and reduces mill throughput by 5 to 10 percent. AI fineness prediction eliminates the need for the safety margin by providing real-time Blaine estimates that enable operators to target the center of the specification range with confidence, recovering the energy and throughput that was previously consumed by over-grinding.
Industry Expert Perspective: Why AI Mill Analytics Is the Next Frontier in Cement Grinding
I have managed grinding operations across ball mills, vertical roller mills, and hybrid circuits for 24 years — starting as a shift operator in a closed-circuit ball mill plant, then moving through production management roles at three cement companies, and most recently serving as grinding specialist for a multi-plant group producing 12 million tons per year. The single largest operational frustration across every mill I have managed is the latency between what the mill is producing and what the lab tells us it is producing. A 45-minute lab delay means the mill operates blind for almost an hour of every shift — and during that hour, the operator is making feed rate, separator speed, and grinding aid decisions based on a guess.
AI mill analytics changes this by giving the operator a real-time Blaine prediction updated every 60 seconds, based on the mill power, separator current, reject rate, and material feed that the control system is already measuring. The first time I saw the AI predict a Blaine shift within 15 points of the lab result in real time, I understood that the gap between what our control system knows about the mill and what we could know in real time is the single largest source of energy waste in cement grinding. Plants that deploy AI mill analytics will have a grinding cost advantage that compounds with every ton of cement produced.
Deploy AI Mill Analytics Across Your Finish Mill and Vertical Roller Mill Operations.
iFactory's Performance Analytics and Energy Monitoring modules provide real-time Blaine fineness prediction, specific energy consumption tracking, and separator efficiency monitoring — enabling operators to maintain grind consistency within plus or minus 20 Blaine points while reducing specific energy consumption by 3 to 8 percent. Deployed on an on-premise NVIDIA edge server with read-only PLC connectivity and a 6 to 8 week installation timeline.
AI-Driven Mill Analytics: Six Capabilities That Change Grinding Economics
Beyond Blaine prediction, AI mill analytics creates a comprehensive performance management system that addresses every variable affecting grinding efficiency. The capabilities below represent the measurable impact that cement plants achieve after deploying AI-driven mill optimization across their grinding circuits. Book a Demo to see the mill analytics dashboard configured for your grinding circuit.
Every kWh per ton of cement produced is tracked in real time against the target for the current product type and Blaine specification. The energy dashboard displays actual vs. target SEC for each mill, enabling shift supervisors to identify efficiency deviations within minutes and take corrective action before energy waste accumulates.
The AI model predicts Blaine fineness from mill power, separator speed, feed rate, reject rate, mill sound level, and material temperature — updated every 60 seconds with prediction accuracy within plus or minus 15 Blaine points of the lab result. Operators use the real-time Blaine prediction to maintain fineness at the center of the spec range.
The AI model calculates separator bypass percentage and classification efficiency from reject rate, finished product rate, and feed analysis. Recommendations for separator speed, vane position, and fan flow adjustments are displayed on the operator screen with the expected impact on Blaine and SEC before the operator implements the change.
Media wear is tracked from mill power draw trend, mill sound level frequency analysis, and throughput degradation. The model predicts when ball charge replenishment will be needed based on the wear rate trend and recommends the optimal time for charge addition or sorting during a scheduled maintenance outage.
The AI model correlates grinding aid dosage with mill throughput, specific energy consumption, and product fineness across different feed materials, moisture levels, and mill temperatures. Recommended dosage adjustments are displayed in real time, reducing aid consumption by 8 to 15 percent while maintaining or improving mill throughput.
Mill operating time, throughput rate, and downtime events are logged against product type, Blaine target, and shift. The analytics module identifies the operating conditions that produce the highest throughput for each product and the maintenance events that cause the most downtime — enabling continuous improvement in mill productivity.
Mill Analytics Implementation Roadmap
Deploying AI mill analytics does not require replacing the mill control system or installing expensive sensors — it requires connecting the existing PLC data stream to the AI analytics platform and configuring the Blaine prediction model for your specific mill configuration and product portfolio. The roadmap below guides plant managers through a deployment sequence that delivers measurable energy savings within the first month of operation.
Mill Process Data Audit and PLC Integration
Catalog every process signal available from the mill control system — mill power, separator speed, feed rate, reject rate, mill sound level, mill outlet temperature, ventilation flow, and grinding aid flow. Configure the data connection between the PLC and the AI analytics platform with read-only access that preserves existing control system integrity.
Blaine Prediction Model Training
The AI model is trained on 6 to 12 months of historical mill data paired with lab fineness results for each product type. The model learns the relationship between mill process parameters and product fineness, establishing the baseline prediction accuracy before live deployment through a validation period where predictions are compared against lab results.
Operator Dashboard and Alert Configuration
Deploy the operator dashboard that displays real-time Blaine prediction, SEC, separator efficiency, and grinding aid effectiveness on the mill control room screen. Configure threshold-based alerts that notify operators when Blaine deviates from target by more than 25 points, when SEC exceeds the target by more than 5 percent, or when separator bypass exceeds the efficiency threshold.
Energy Monitoring Dashboard and Reporting
The Energy Monitoring module displays mill SEC, total energy consumption, and energy cost per ton in real time for each mill and each product type. Automated reports document energy performance by shift, product, and operator — providing the data required for energy management programs, sustainability reporting, and continuous improvement initiatives.
Continuous Improvement and Model Refinement
The AI model continues to improve through an active learning loop that incorporates lab fineness results, product changeovers, ball charge additions, and seasonal material moisture variations. Monthly model validation against lab data confirms that prediction accuracy is maintained, and the model is retrained when new product types or mill configuration changes are introduced.
Conclusion
Cement mill optimization through AI-driven analytics represents one of the highest-ROI digital investments available to cement plants today — because the mill control system already generates the data required for Blaine prediction, the energy savings are measurable from the first shift of deployment, and the 3 to 8 percent SEC reduction that AI analytics delivers translates directly to $150,000 to $500,000 per year in energy cost savings at a typical finish mill. Cement plants that deploy AI mill analytics recover the energy that was previously consumed by over-grinding, optimize separator performance to reduce recirculation load, and extend ball charge life through condition-based media management.
The next step for production managers and plant engineers evaluating this technology is a mill analytics pilot study — a 30-day data collection and model validation period during which iFactory's Performance Analytics module characterizes the current mill efficiency, identifies the largest sources of energy waste, and quantifies the SEC reduction opportunity for each optimization lever. The study produces a prioritized action plan with expected energy savings, throughput improvement, and payback timeline for each intervention. Book a Demo to start the mill analytics pilot study for your finish mill or vertical roller mill operation.
Cement Mill Optimization with AI — Frequently Asked Questions
What sensor data is needed for AI-based Blaine fineness prediction?
The minimum sensor set includes mill power draw, separator speed and current, feed rate, reject rate, mill sound level, and mill outlet temperature — all of which are standard measurements available from the mill PLC in virtually every modern cement plant. Additional sensors such as online particle size analyzers or near-infrared moisture sensors improve model accuracy but are not required for initial deployment. The model achieves prediction accuracy within plus or minus 20 Blaine points using standard PLC signals alone.
How does the AI model handle product changeovers between different cement types and Blaine targets?
The model maintains separate prediction profiles for each product type — defined by Blaine target range, clinker source, additive type and dosage, and mill configuration settings. When the mill changes over to a new product, the model automatically loads the corresponding prediction profile and begins tracking fineness and SEC against the new target within 15 minutes of the changeover. For new products that have not been run before, a baseline profile is generated from the product specification data and the first 24 hours of mill operation.
Can the mill analytics platform be deployed on both ball mills and vertical roller mills?
Yes. iFactory's Performance Analytics module supports both ball mill and vertical roller mill configurations with model architectures specific to each mill type. The ball mill model uses mill power, sound level, and separator parameters as primary inputs, while the VRM model uses grinding pressure, table differential pressure, bed vibration, and separator speed. The same dashboard, alert, and reporting framework applies to both mill types with mill-specific parameter displays.
What is the typical payback period for AI mill analytics deployment?
Most cement plants achieve full payback within 4 to 8 months, driven by specific energy consumption reduction of 3 to 8 percent, valued at $150,000 to $500,000 per year in energy cost savings at a typical finish mill. Additional savings from reduced grinding aid consumption (8 to 15 percent), increased mill throughput (5 to 10 percent), and extended ball charge life add 20 to 40 percent to the total economic benefit. The payback timeline varies with mill size, production rate, local power cost, and current SEC baseline.
Does the AI mill analytics platform require cloud connectivity or can it run on-premise?
The mill analytics platform is deployed on an on-premise NVIDIA edge server at the cement plant with read-only PLC connectivity, processing all data locally without cloud dependency. The edge server runs the AI inference pipeline for Blaine prediction, SEC tracking, and separator efficiency monitoring. A cloud dashboard is available for multi-plant reporting and data aggregation, but the real-time operator interface and control recommendations operate entirely on the edge server without internet connectivity requirements.
Launch Your Mill Analytics Pilot with iFactory Today
Cement producers across North America and Europe are using iFactory's Performance Analytics and Energy Monitoring modules to reduce specific energy consumption by 3 to 8 percent, optimize separator efficiency, and maintain Blaine fineness within plus or minus 20 points of target — all from existing mill PLC data on an on-premise edge server.