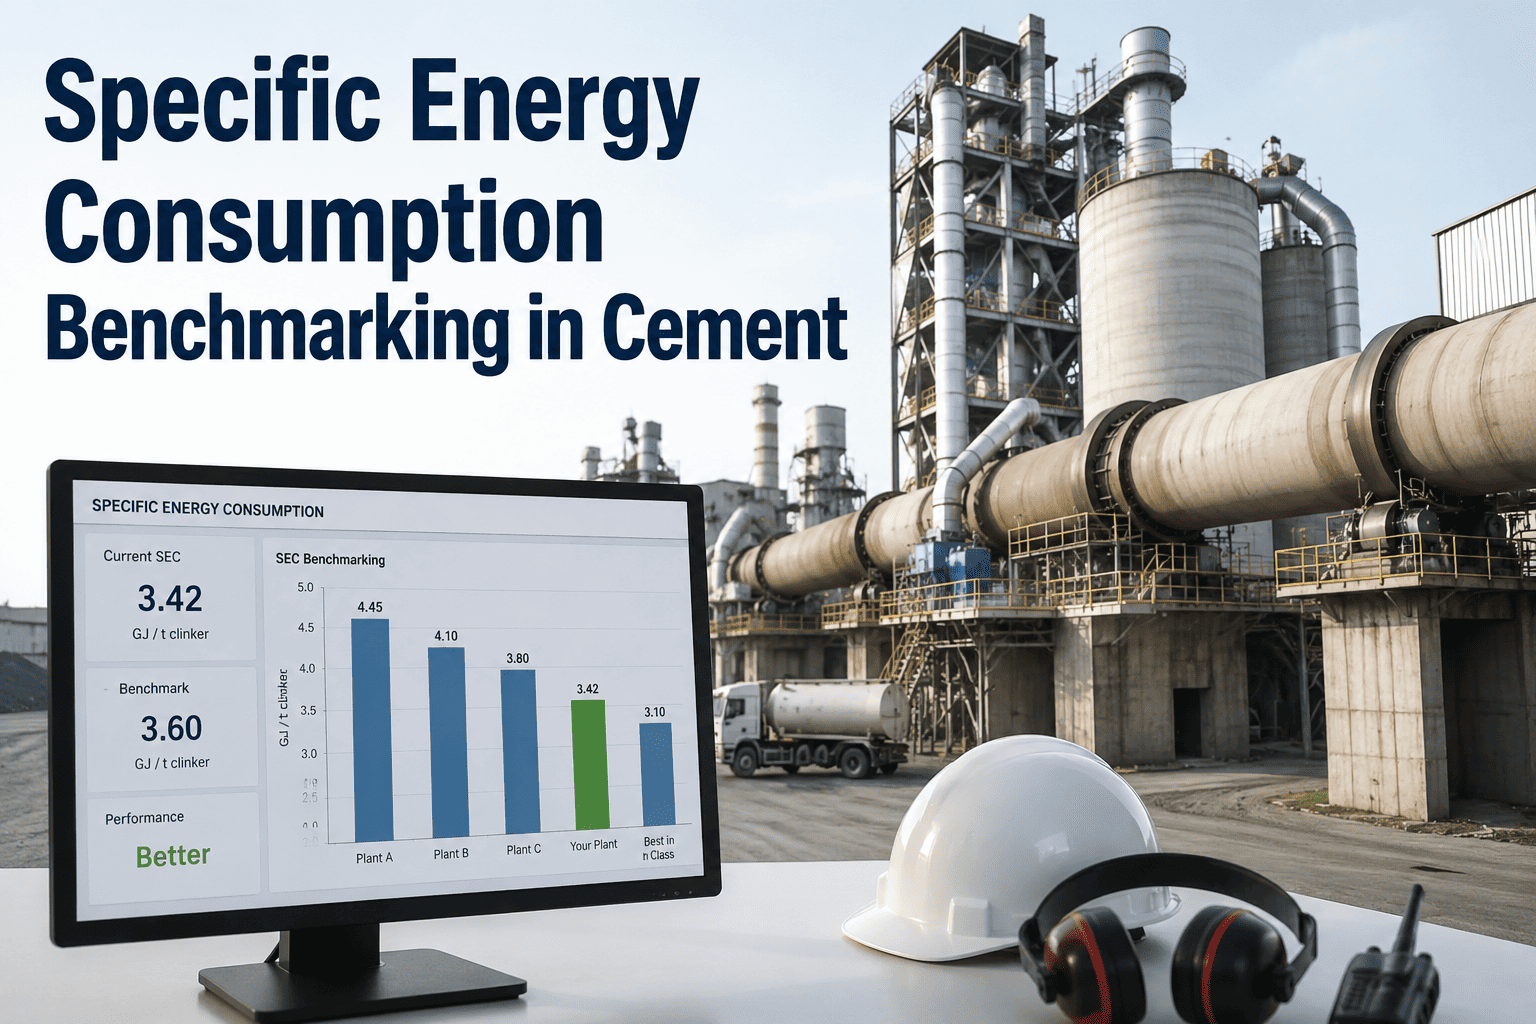
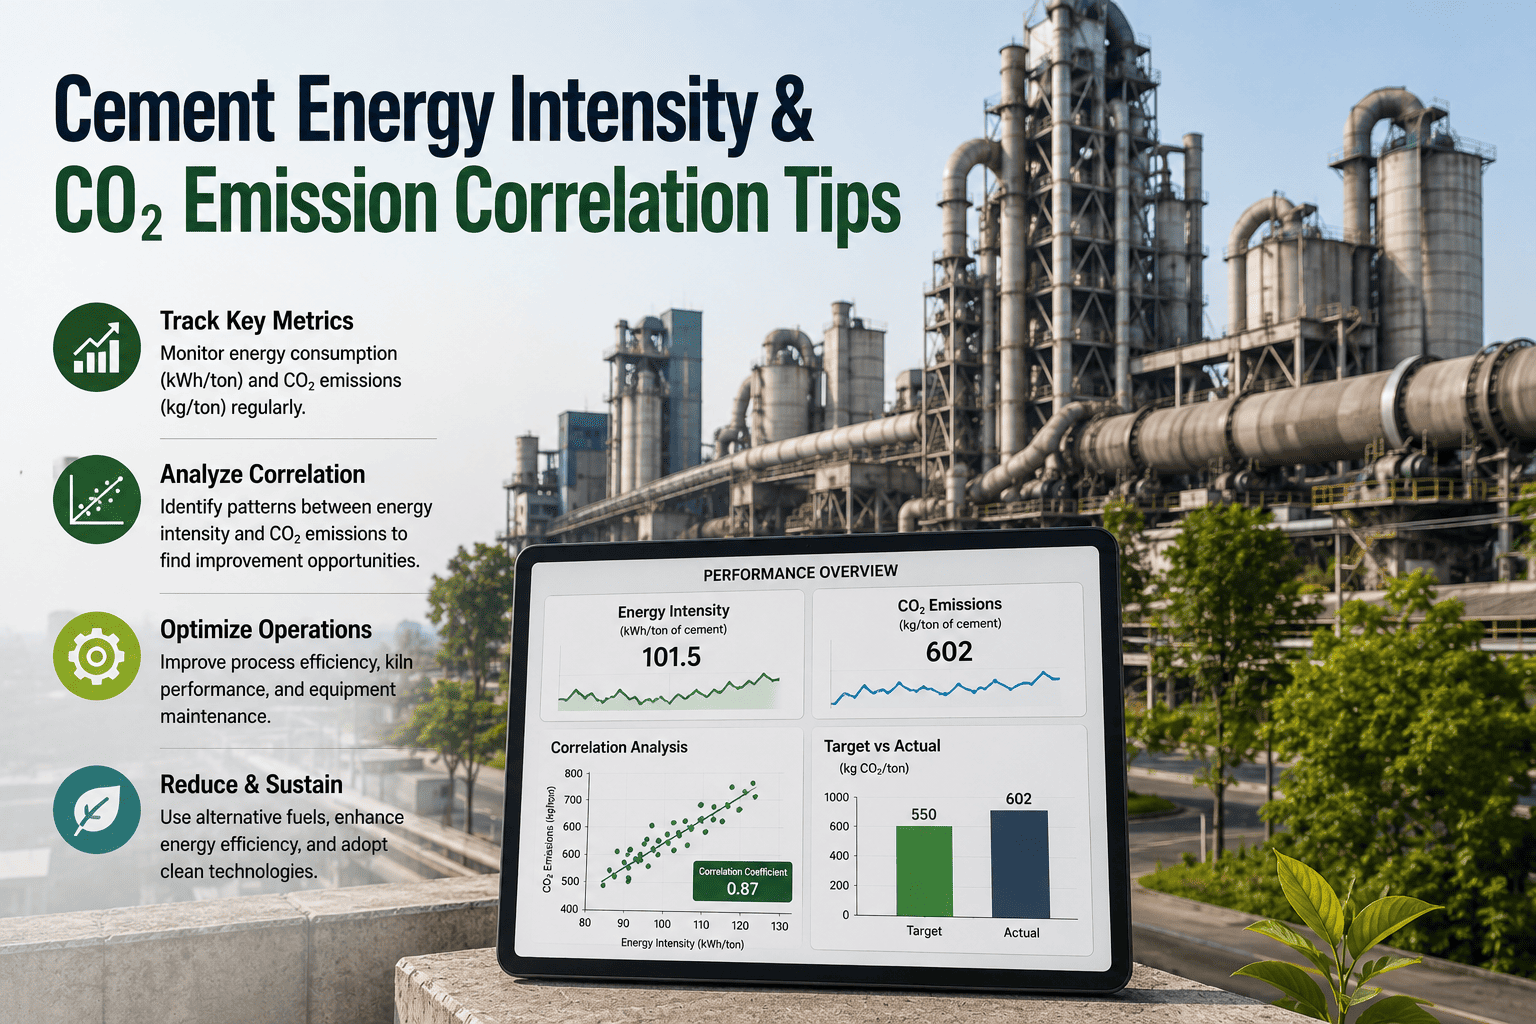
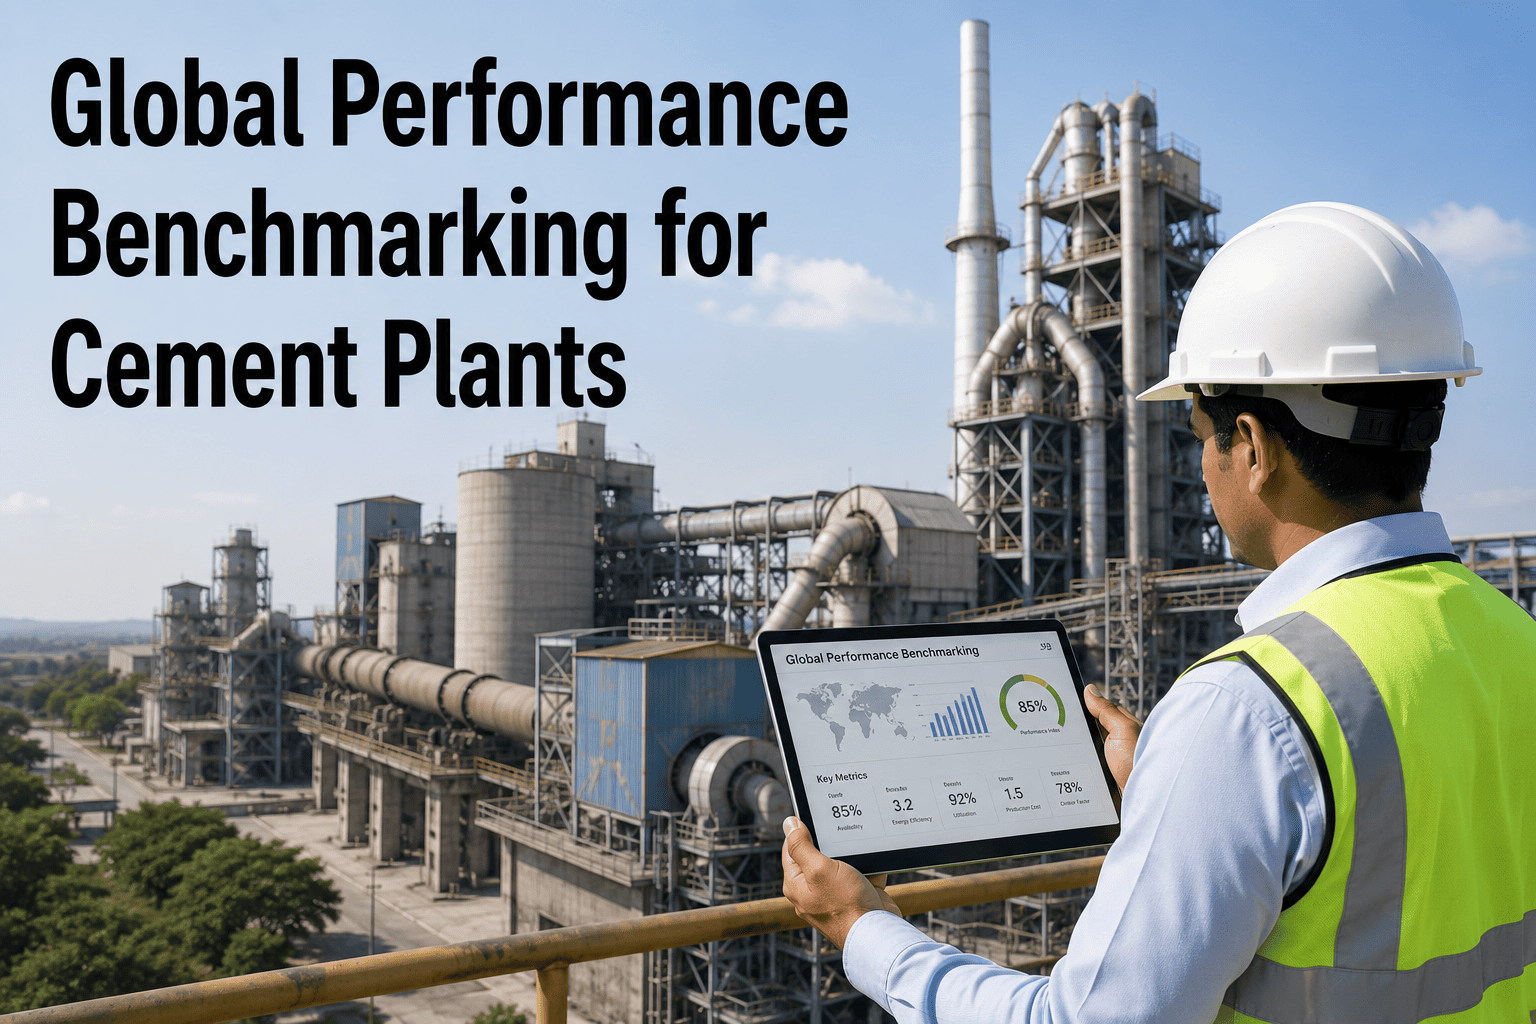
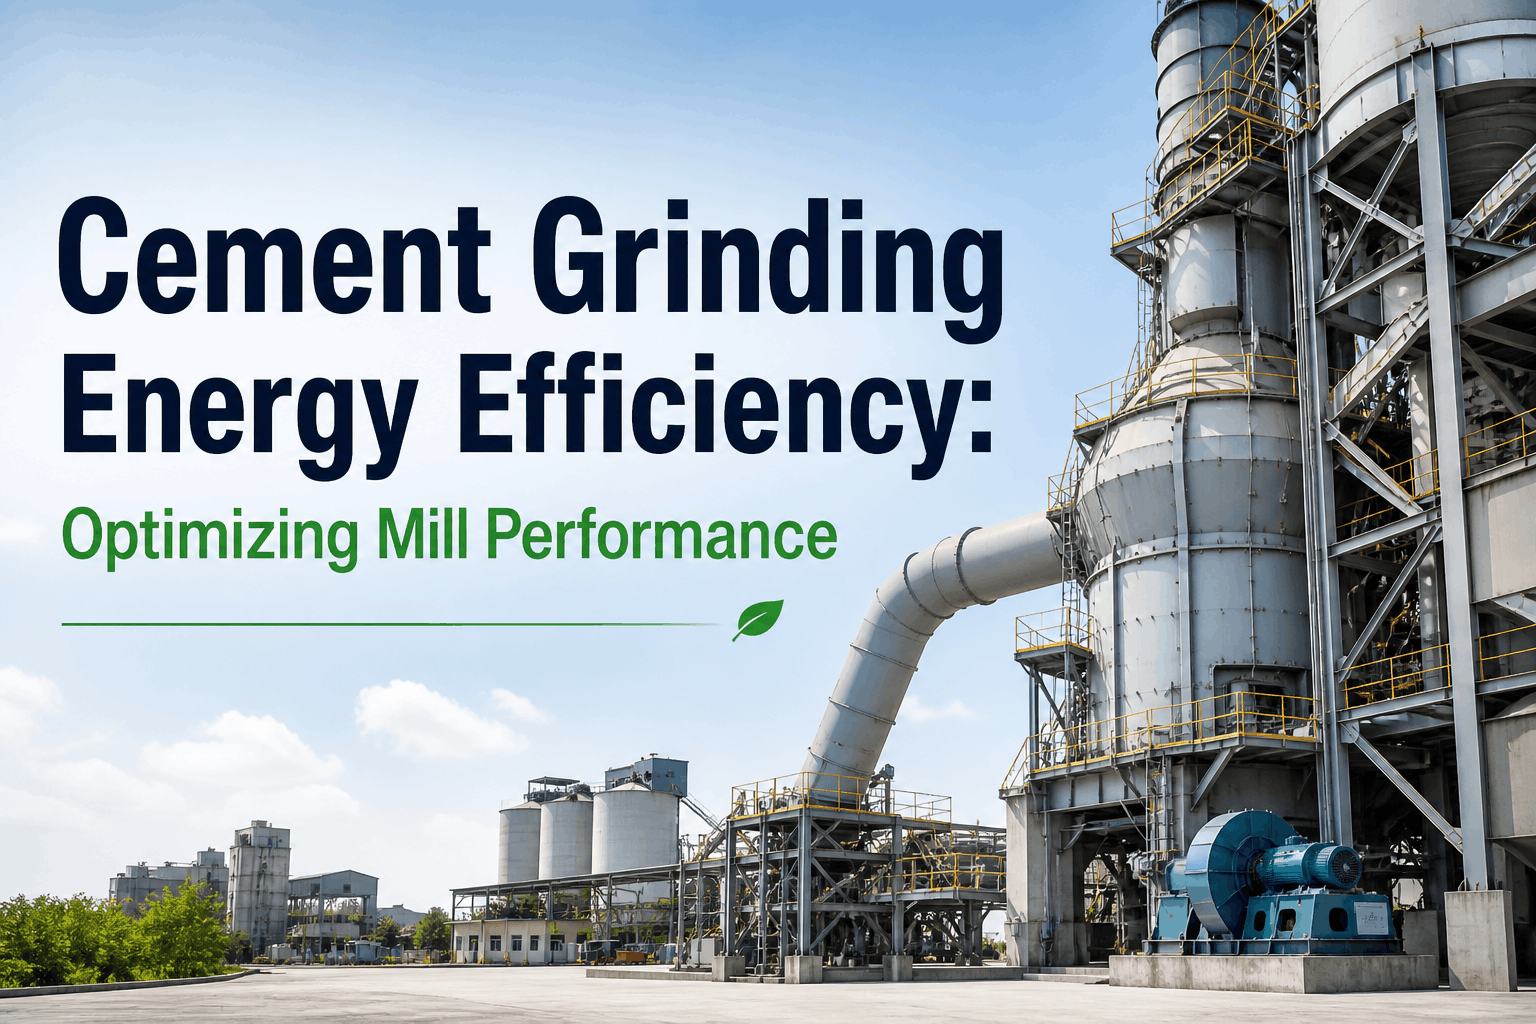
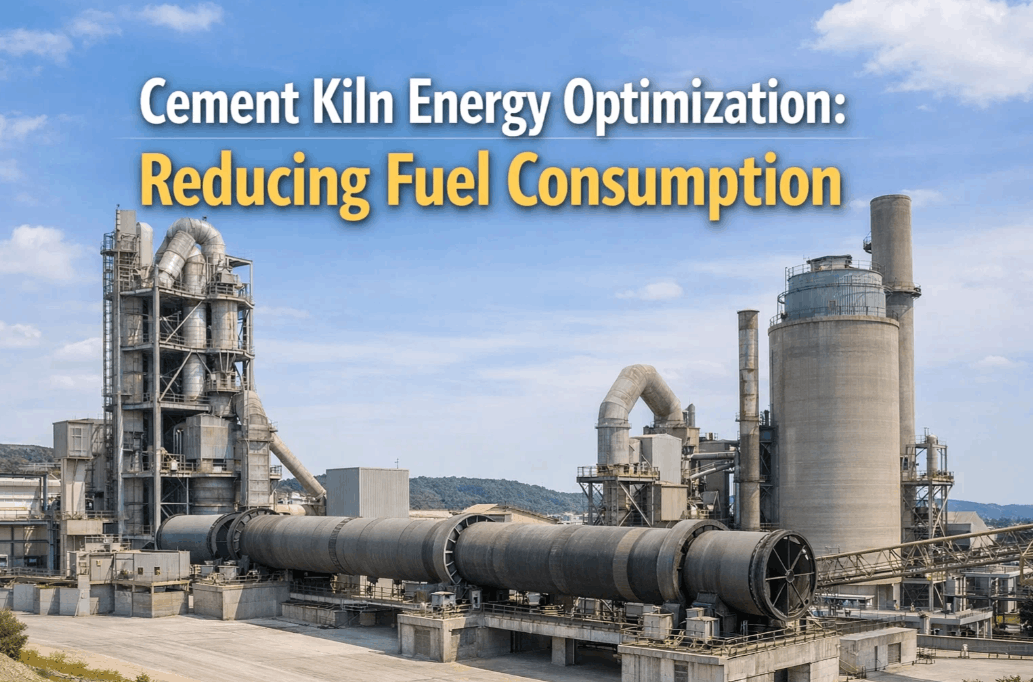
Most cement plants know their specific energy consumption number. Far fewer know how that number compares to what the same equipment, running well-maintained and well-tuned, is actually capable of. That gap between "our number" and "the achievable number" is where the real opportunity sits, and it is usually larger than plant teams expect — international studies of surveyed cement facilities have found technical electricity-saving potential in the double digits once a plant is measured against true best-practice benchmarks rather than its own history. Book a demo to see your plant's SEC benchmarked stage by stage.
Cement · Energy Optimization
Specific Energy Consumption Benchmarking — Know Exactly Where You Stand
Thermal SEC, electrical SEC, and process-stage energy intensity, compared against global average and best-in-class figures so the gap between what your plant uses today and what it could use is a documented number, not a guess.
Electrical SEC Ladder
Where 100 kWh per Ton of Cement Puts You on the Global Scale
Electrical specific energy consumption is one of the clearest ways to place a plant on a global performance scale, because the measurement methodology is largely consistent across regions and equipment types.
Underperformer
Above 135 kWh/ton
Global Average
110–120 kWh/ton
Domestic Best Practice
95–105 kWh/ton
International Best-in-Class
85–95 kWh/ton
Process-Stage Breakdown
SEC Is Not One Number — It Is Four Process Stages Added Together
A single plant-wide SEC figure hides where the actual improvement opportunity sits. Breaking it into process stages is what turns a benchmark into a work plan.
Raw Grinding
15–25 kWh/t (VRM) vs 25–35 kWh/t (ball mill)
Mill technology and separator efficiency drive most of the variation seen between plants at this stage.
Pyroprocessing (Thermal)
700–750 kcal/kg (best-in-class) vs 1,000+ kcal/kg (older kilns)
Preheater stages, kiln design, and cooler recuperation efficiency define the thermal side of the benchmark.
Finish Grinding
25–35 kWh/t (VRM) vs 35–45 kWh/t (ball mill)
Fineness targets and separator generation matter as much as the mill type itself at this stage.
Utilities and Material Handling
10–15% of total electrical SEC
Fan systems, compressed air, and conveying often carry more unmanaged savings than any single process stage.
iFactory Benchmarks Every Process Stage Against Your Own Historical Best.
Live SEC dashboards compare current shift performance against your plant's documented best-practice window and the global benchmark tier, so drift gets caught before it becomes next quarter's energy bill.
Gap Analysis Method
Turning a Benchmark Comparison Into a Prioritized Action List
Knowing you sit above the global average is only useful once the gap is broken into causes that can each be assigned an owner and a target date.
Gap Analysis Step
What It Reveals
Typical Owner
Normalize for raw material hardness
Whether grinding SEC is genuinely high or explained by feed characteristics
Process Engineering
Normalize for clinker factor
Whether thermal SEC reflects kiln performance or product mix
Production Planning
Segment by shift and crew
Whether the gap is equipment-driven or operating-practice driven
Operations Manager
Segment by equipment age and condition
Which assets carry the largest share of the recoverable gap
Reliability Engineering
From the Field
What Changed When SEC Was Tracked by Stage, Not Plant-Wide
Our plant-wide SEC number looked reasonable next to the industry average, so nobody questioned it for years. Breaking it down by process stage showed our finish mill was running nearly 20% above the benchmark for our separator generation, while raw grinding was actually close to best practice. That single insight redirected an entire year's improvement budget toward the separator upgrade instead of a generic kiln project that would have delivered far less.
— Plant Energy Manager, Integrated Cement Facility
Frequently Asked Questions
SEC Benchmarking — Common Questions
What is the difference between thermal SEC and electrical SEC?
Thermal SEC measures the fuel energy required per unit of clinker, typically expressed in kilocalories per kilogram, and is driven mainly by kiln and preheater design. Electrical SEC measures power consumption per ton of cement across grinding, material handling, and utilities. Both need separate benchmarking because a plant can lead on one metric while lagging on the other, and combining them into a single figure hides which side of the operation needs attention.
Book a demo to see both tracked side by side for your plant.
Why does normalization matter before comparing SEC across plants?
Raw material hardness, moisture content, product fineness targets, and clinker-to-cement ratio all legitimately change energy consumption without reflecting equipment performance. A plant grinding harder limestone or producing a finer cement grade will show a higher SEC than a benchmark plant even if both are operating at their true best practice level, so normalization is what makes the comparison fair.
How much energy savings is realistically achievable through benchmarking alone?
Benchmarking studies across surveyed cement facilities have found that reaching domestic best-practice levels typically unlocks meaningful electrical savings, while international best-practice levels unlock significantly more. The realistic figure for any single plant depends heavily on its current equipment generation and how much of the gap is operating-practice driven versus capital-driven.
Should SEC be tracked continuously or through periodic audits?
Periodic audits catch large, structural gaps but miss day-to-day drift caused by wear, operating habits, or minor process upsets. Continuous SEC tracking against a rolling best-practice baseline catches that drift within days, turning benchmarking from an annual report into an operating discipline the whole plant can see in real time.
Which process stage should a plant benchmark first if starting from scratch?
Finish grinding and pyroprocessing are usually the highest-value starting points, since together they typically account for the largest share of total plant energy cost and carry the clearest published best-practice figures to compare against.
Contact support to help scope a first benchmarking pass for your specific configuration.
Turn Your SEC Number Into a Documented Improvement Plan.
Stage-by-stage benchmarking against global best practice, normalized for your raw materials and product mix, delivered as a ranked, ownable action list.