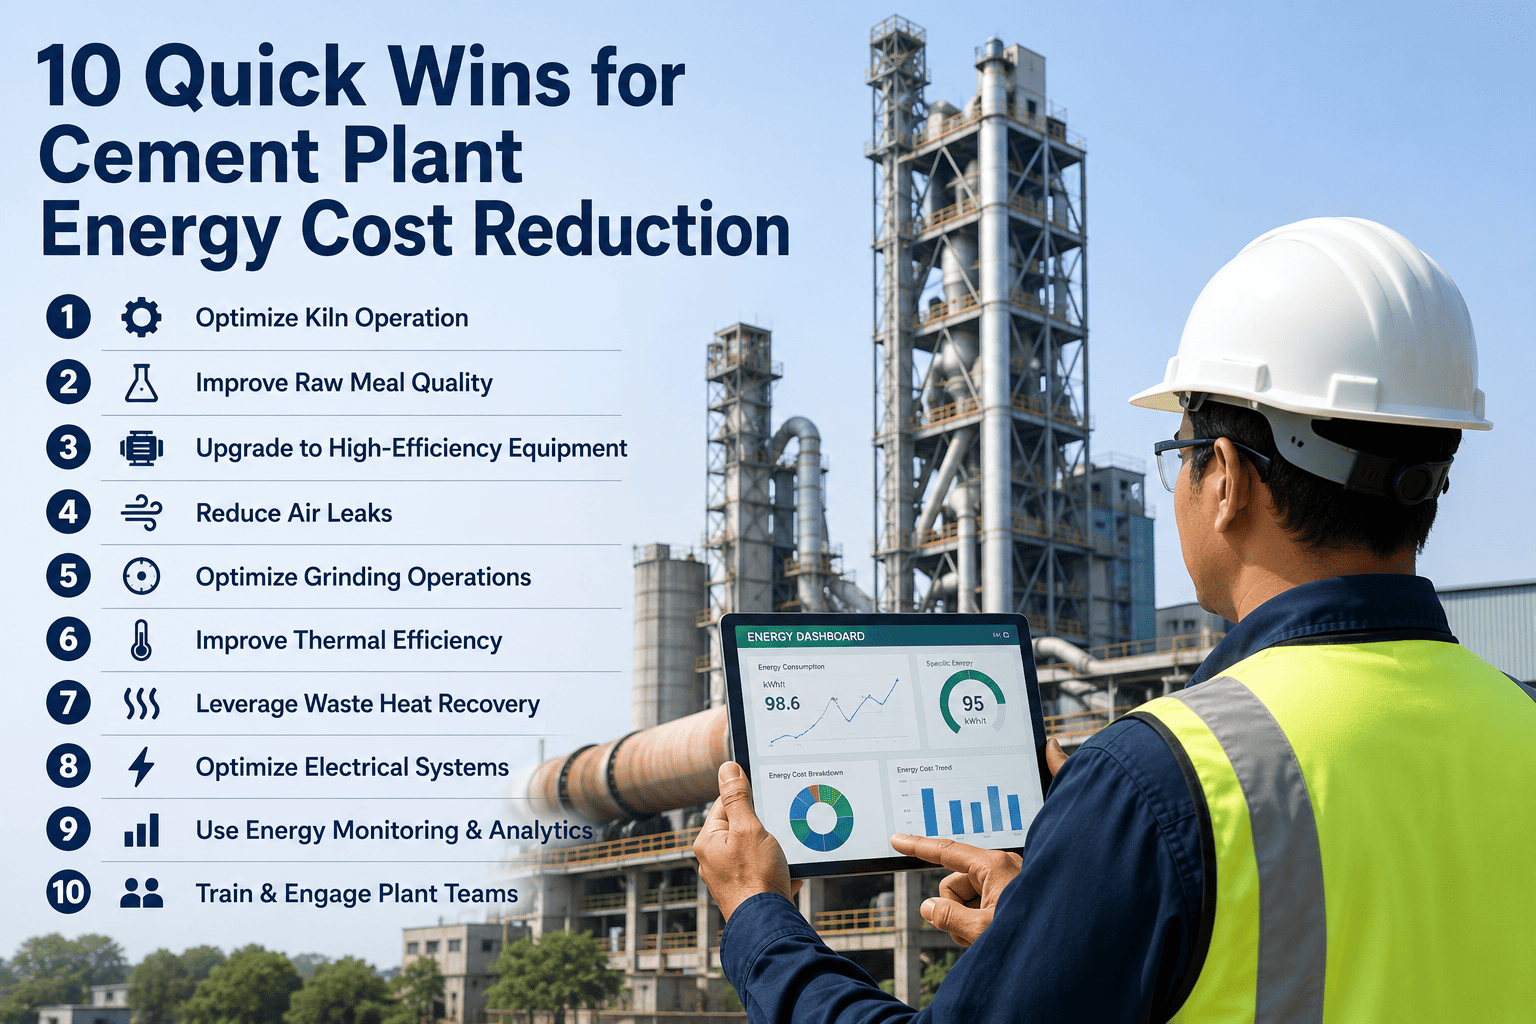
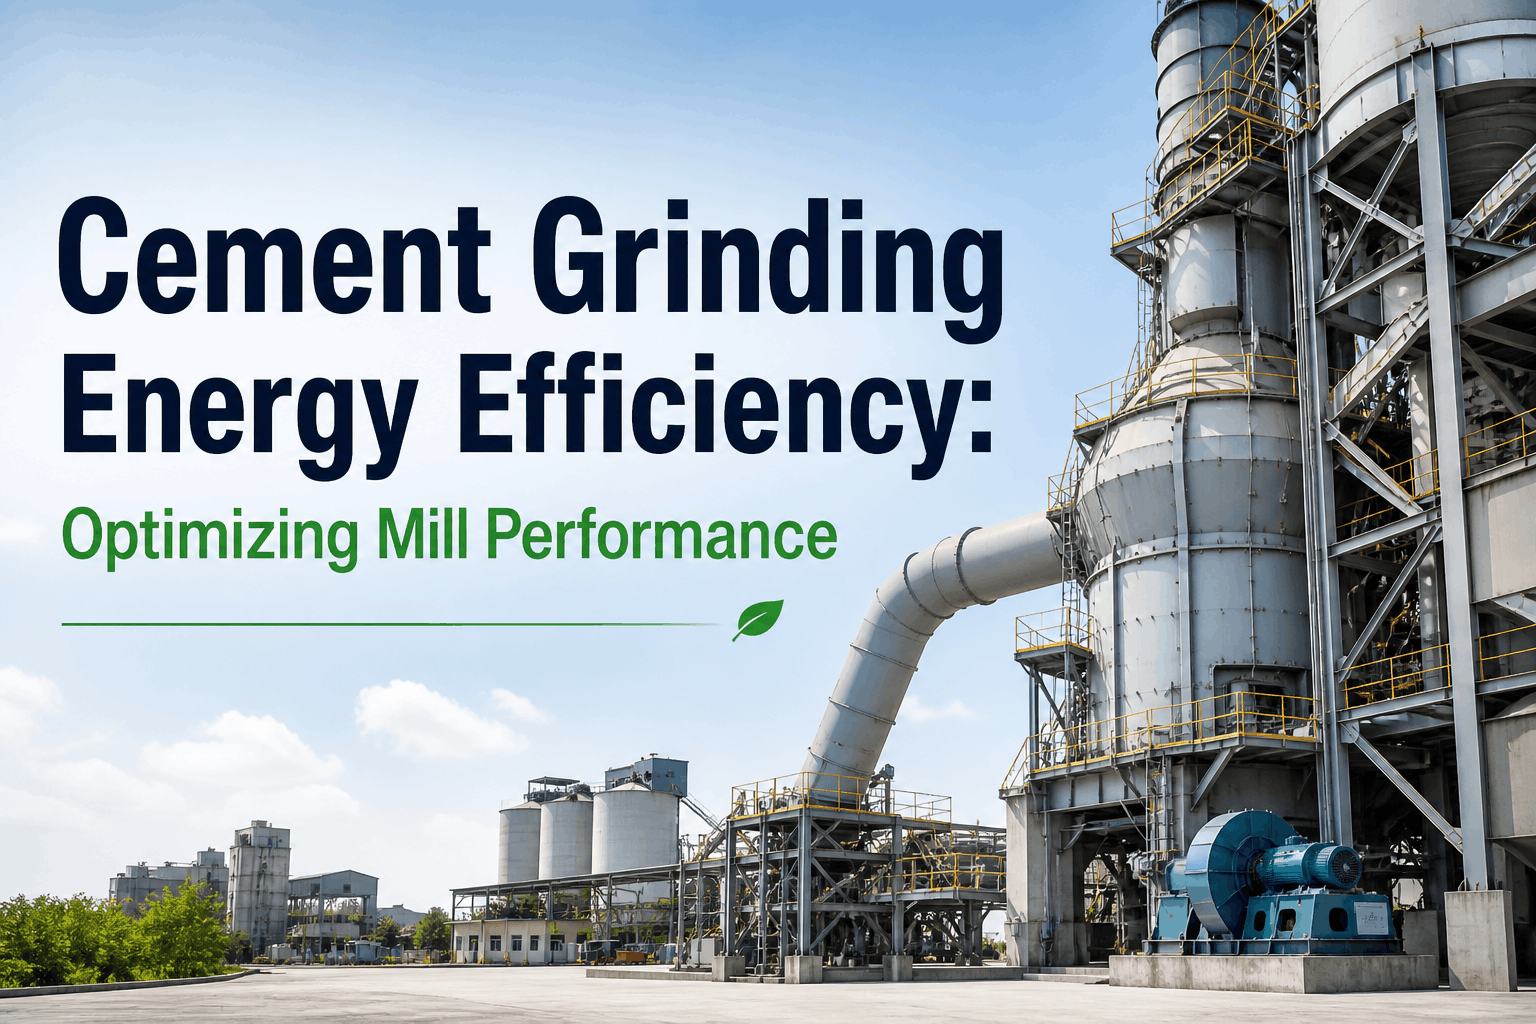
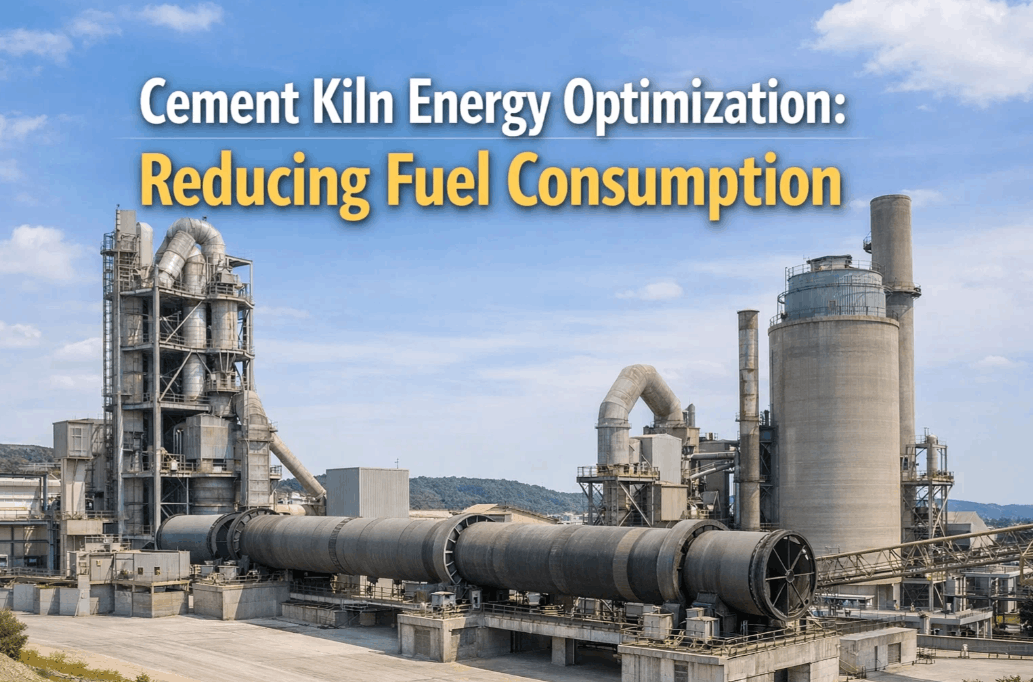
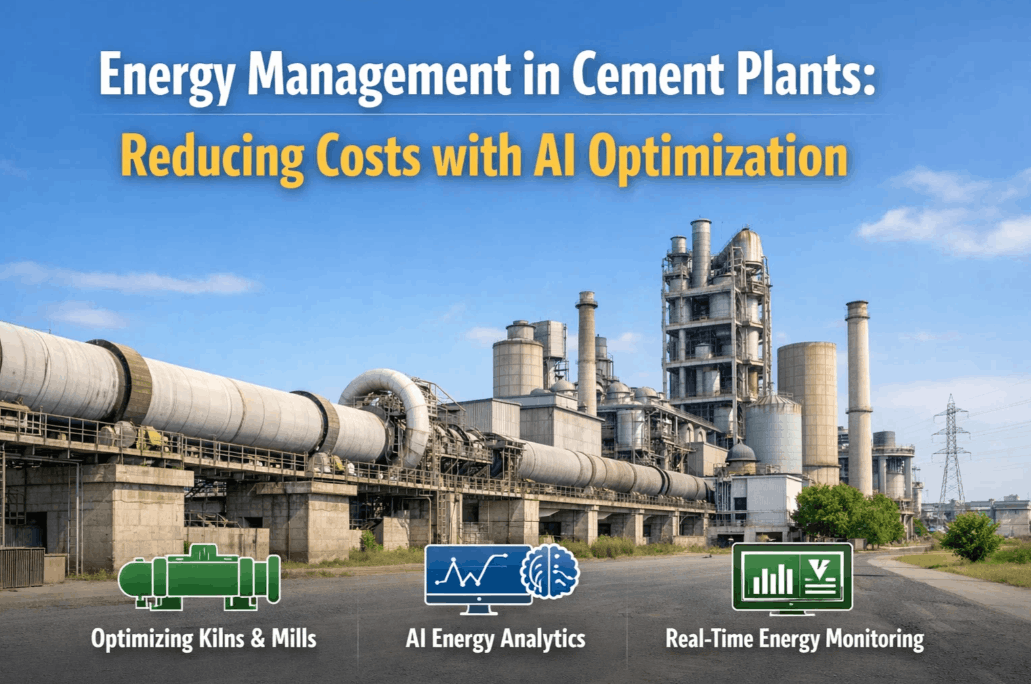
The cement industry consumes approximately 5% of global electricity and produces 8% of worldwide CO2 emissions — making it the third-largest emitter if it were a country. Energy costs represent 30–40% of total cement production costs. A single modern dry-process plant consumes 3,000–3,500 MJ of thermal energy and 90–130 kWh of electrical energy per tonne of cement — yet only half the thermal energy actually contributes to clinker formation. The rest exits as exhaust heat, kiln shell radiation, and cooler losses. Grinding circuits alone consume 60–70% of total plant electricity, and over-grinding wastes up to 30% of milling energy without improving product quality. These are not marginal inefficiencies — they are millions of dollars bleeding from your plant every year. AI-driven energy optimization addresses this at a level no human operator can replicate: continuously analyzing 47+ interdependent process variables across kiln, mills, and auxiliaries simultaneously, 24 hours a day. iFactory deploys AI-powered energy optimization systems for cement plants — book a 30-minute consultation to see how AI can cut your energy costs within 90 days.
Cement Industry AI Solutions
Cut Energy Costs.
Not Production.
AI-Driven Fuel Optimization, Power Monitoring & Carbon Reduction for Cement Plants
Book a Free Consultation
30–40%
Of Total Cement Production Costs Are Energy
8%
Of Global CO2 Emissions Come from Cement
60–70%
Of Plant Electricity Consumed by Grinding Circuits
5–20%
Energy Reduction Achieved with AI Optimization
Where Energy Disappears in a Cement Plant
Understanding the energy flow is the first step to optimizing it. A cement plant is a thermodynamic system with massive losses at every stage — but the losses are not equal. Some units offer 10x the optimization potential of others. AI identifies exactly where every megajoule goes and where the highest-ROI interventions sit.
Kiln System
~75% of thermal energy
3.0–3.5 GJ/tonne clinker. Only ~50% contributes to clinker formation. Losses: preheater exhaust (300–350°C), kiln shell radiation, cooler vent air (200–250°C). Every 10 kcal/kg clinker reduction saves $100K–$300K/year for a 5,000 TPD plant.
Grinding Circuits
60–70% of electrical energy
30–40 kWh/tonne cement across raw mill, finish mill, and coal mill. 95% of grinding energy converts to heat and noise — not particle size reduction. Over-grinding wastes up to 30% of milling electricity without quality improvement.
Fans & Auxiliaries
15–20% of electrical energy
ID fans, preheater fans, cooler fans, and bag house fans. False air infiltration directly increases fan power consumption. Each percentage point of false air adds ~0.03 GJ/tonne to heat consumption.
Compressed Air
Often overlooked
15–30% of generated compressed air typically lost through leaks at a cost of $0.02–$0.04/Nm3. A 3,000 TPD plant recovers $150K–$400K annually from leak sealing alone — repair costs often under $30K.
What AI Optimization Does That Humans Cannot
A skilled kiln operator manages 5–8 variables simultaneously based on experience and periodic lab data. AI optimization manages 47+ interdependent variables continuously, using real-time sensor data and machine learning models trained on years of your plant's specific operating history. The difference is not incremental — it is fundamental.
Operator adjusts 5–8 variables based on experience
Lab data arrives every 2–4 hours for clinker quality
Quarterly energy audits detect problems after thousands wasted
Fixed setpoints regardless of raw material variability
Shift-to-shift inconsistency in operating practices
Reactive response to energy anomalies
vs
47+ interdependent variables optimized simultaneously
Real-time inference from continuous sensor data streams
Anomaly detection within minutes, not months
Dynamic setpoints adapting to raw material chemistry changes
Consistent optimization 24/7/365 across all shifts
Predictive alerts before energy waste occurs
The 5 AI Optimization Zones in a Cement Plant
AI energy optimization in cement is not a single model — it is five specialized optimization zones, each targeting a different part of the energy equation. Together, they deliver compounding savings that individual interventions cannot achieve alone.
01
Kiln Thermal Optimization
$800K–$3M/year savings potential
AI adjusts fuel feed rate, secondary air temperature, kiln speed, and preheater cyclone distribution in real time based on burning zone temperature, clinker free lime, and exhaust gas composition. Eliminates overburning — the hidden cost that most plants accept as normal.
02
Grinding Circuit Efficiency
$500K–$800K/year savings potential
AI controls mill feed rate, separator speed, water injection, and ventilation based on incoming material hardness and target Blaine. Prevents over-grinding that wastes 30% of milling energy. Research validates AI models achieving R2 above 0.97 for predicting and optimizing kWh/tonne.
03
Alternative Fuel Management
10–20% fuel cost reduction
AI dynamically adjusts fuel blend ratios — balancing coal, pet coke, biomass, RDF, and waste-derived fuels — to maintain kiln stability while maximizing lower-cost alternative fuel substitution. Automatically compensates for variable calorific values in real time.
04
Peak Demand Management
$200K–$600K/year savings potential
AI schedules high-load operations to avoid coincident demand peaks that trigger punitive utility charges. Shifts non-critical loads to off-peak tariff periods and coordinates mill starts, compressor staging, and EAF sequences to flatten the demand profile.
05
Waste Heat Recovery Optimization
8–12% of kiln fuel input recoverable
AI optimizes heat recovery from kiln exhaust (300–350°C) and cooler vent air (200–250°C) by continuously adjusting steam cycle parameters, clinker cooler grate speed, and airflow distribution to maximize electricity generation or raw material preheating.
The ROI: What AI Energy Optimization Delivers
For a typical 3,000 TPD cement plant, AI energy optimization delivers $2–5 million in annual savings with a 3–8 month payback on the system investment. The savings are documented, measurable, and begin accruing within 90 days of deployment — not years.
$2–5M
Annual energy savings for a 3,000 TPD plant
3–8 mo
Payback period for full AI system deployment
5–20%
Reduction in kWh/tonne across grinding circuits
62%
Reduction in cement strength variance with AI blending
Kiln thermal optimization
0.1–0.2 GJ/tonne clinker
3–8 months
Medium — requires DCS integration
Grinding energy reduction
5–12 kWh/tonne cement
12–18 months
Medium-High — multi-variable control
Compressed air leak sealing
$150K–$400K/year
Immediate
Low — ultrasonic detection + repair
False air elimination
$200K–$800K/year
1–3 months
Low — smoke stick testing + sealing
Peak demand management
$200K–$600K/year
1–2 months
Low — scheduling + load coordination
Carbon & ESG: The Regulatory Imperative
Every kWh and calorie saved directly reduces CO2 emissions. With EU ETS carbon pricing at $53–80/tonne CO2, CSRD mandatory disclosure requirements expanding, and CBAM targeting cement imports, energy optimization is no longer just a cost play — it is a regulatory compliance and carbon liability reduction strategy. AI provides the real-time CO2/tonne tracking that ESG reporting frameworks demand.
Scope 1: Direct Fuel Emissions
40% of cement CO2 comes from fuel combustion. AI reduces fuel consumption per tonne through kiln thermal optimization, alternative fuel management, and waste heat recovery — directly cutting Scope 1 emissions.
Scope 2: Grid Electricity Emissions
Grinding circuits consume 60–70% of plant electricity. AI reduces kWh/tonne by 5–20%, directly cutting Scope 2. Peak demand management shifts loads to lower-carbon grid periods.
Automated ESG Reporting
Real-time CO2/tonne tracking feeds directly into GHG Protocol, BRSR, CSRD, and CDP reporting frameworks. Eliminates manual data collection that delays and distorts ESG reports.
Carbon Border Adjustment (CBAM)
EU CBAM targets cement imports. Plants with documented lower emissions gain competitive advantage over higher-emitting exporters. AI provides the verified data trail regulators require.
Deployment Timeline: From Sensors to Savings in 90 Days
AI energy optimization does not require replacing your existing automation. It adds an intelligent layer on top of your current DCS and SCADA infrastructure using standard industrial protocols — OPC-UA, Modbus, or direct historian connection. No control system modifications required.
Phase 1
Weeks 1–4
Connect & Baseline
Connect DCS/SCADA data, map sensor tags to KPI formulas, validate historical data, establish energy baselines per process area. Benchmark against best practice: 3.0–3.3 GJ/tonne thermal, 85–95 kWh/tonne electrical.
Phase 2
Weeks 4–8
Monitor & Alert
Deploy real-time dashboards with anomaly detection and alerting. Operators see kWh/tonne, SHC, and WAGES consumption at equipment level with sub-minute granularity. Immediate value from anomaly detection.
Phase 3
Weeks 8–12
Predict & Optimize
Activate predictive models and AI setpoint recommendations. Advisory mode first — operators compare AI recommendations with current practice before transitioning to closed-loop control on highest-impact variables.
Phase 4
Ongoing
Autonomous Optimization
Closed-loop optimization writing directly to DCS within defined safety bounds. AI adapts to raw material changes, seasonal variations, and alternative fuel switches. Models retrain automatically when drift is detected.
Frequently Asked Questions
How much can AI save on cement plant energy costs?
For a typical 3,000 TPD plant, AI energy optimization delivers $2–5 million in annual savings with a 3–8 month payback. Grinding energy reductions of 5–20% kWh/tonne are documented across peer-reviewed research and industrial deployments. Kiln thermal optimization typically saves 0.1–0.2 GJ/tonne clinker. Quick wins like compressed air leak sealing and false air elimination can deliver $350K–$1.2M in savings with near-zero capital investment.
Does AI optimization require replacing our existing control system?
No. AI optimization adds an intelligent layer on top of your existing DCS and SCADA infrastructure via standard industrial protocols — OPC-UA, Modbus, or direct historian connection. No control system modifications are required. Phase 1 deployment typically completes in 2–4 weeks with no production interruption.
How does AI handle raw material variability?
AI models are designed for exactly this variability. When incoming limestone or clay composition shifts — detected by XRF analyzers — the models dynamically adjust kiln targets, raw mill feed ratios, and fuel parameters in real time. If shifts exceed the model's training distribution, the system flags it for automatic retraining without disrupting production operations.
How does iFactory approach cement plant energy optimization?
iFactory deploys AI-powered energy optimization across kiln, grinding, and auxiliary systems using NVIDIA GPU-accelerated analytics. We start with a comprehensive energy audit benchmarking your plant against world best practice, then deploy real-time monitoring dashboards, predictive models, and closed-loop optimization — delivering proven ROI within 90 days. Every deployment begins in advisory mode so your operators build confidence before autonomous control activates.
Your Kiln Is Burning Money Right Now. Let AI Find It.
iFactory delivers AI-powered energy optimization for cement plants — from kiln thermal control and grinding efficiency to peak demand management and real-time ESG reporting. Every calorie tracked. Every kilowatt-hour optimized. Every tonne of CO2 accounted for.