How QA Leaders Use AI Root Cause in Cement Grinding

By Hazel Green on June 23, 2026

ai-root-cause-detection-cement-grinding-quality-leaders-energy-optimization

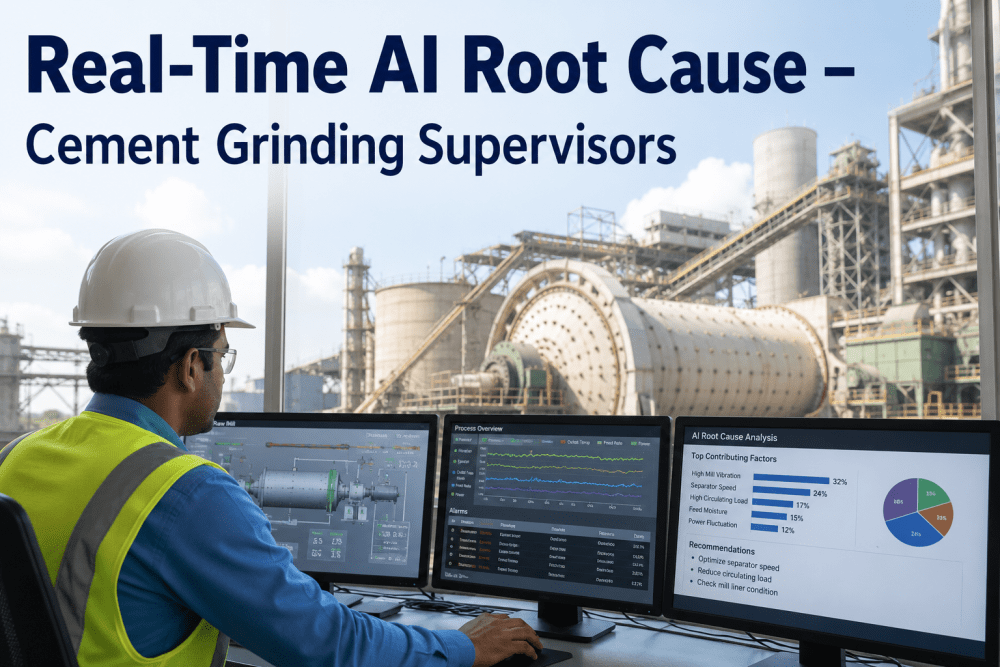
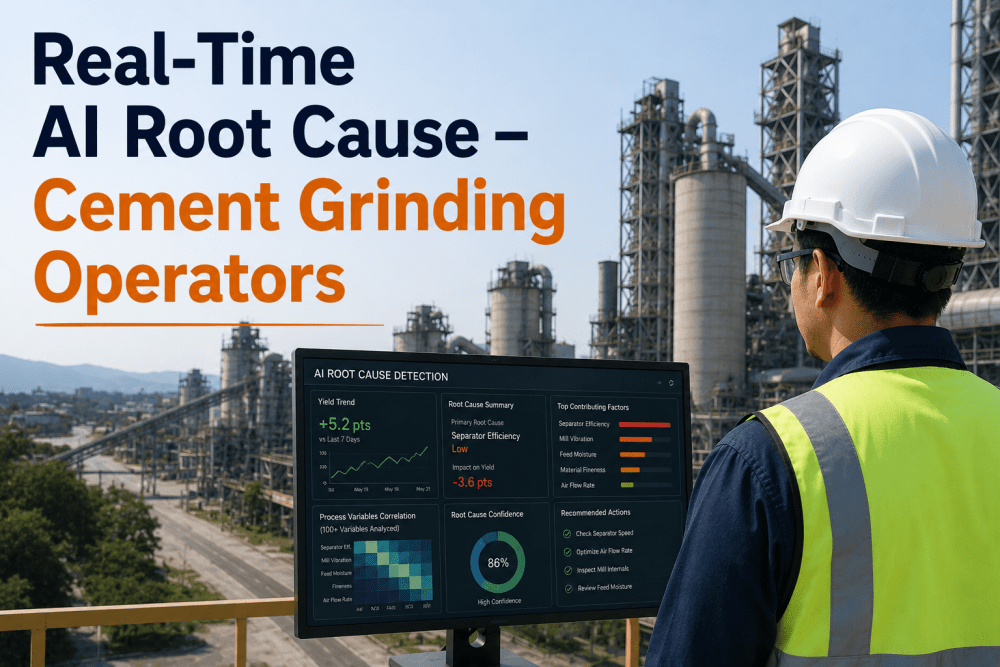
In cement grinding, energy consumption represents 60-70% of total production cost — and the most effective path to energy reduction is not replacing mill motors or installing variable frequency drives. It is detecting the operating conditions that waste energy before they produce their full cost impact. A finish mill operating with a recirculation load that has drifted outside the optimal range, a separator running at sub-optimal speed for the current clinker grindability, or a temperature excursion that reduces grinding efficiency — each of these conditions consumes excess energy for every ton of material produced, and each is invisible to traditional SPC systems that monitor single variables against static limits. AI root cause detection changes this by analyzing 100+ process variables in real time applying Western Electric rules to detect anomalous patterns, and using multivariate machine learning to pinpoint the exact variable combination driving energy inefficiency. For quality leaders managing finish grinding operations, this means shifting from energy management based on monthly specific consumption reports to real-time energy optimization that compounds savings across every operating hour. Quality leaders who book a free Cpk and audit-readiness assessment with iFactory are finding that AI root cause detection uncovers 4-10% energy reduction opportunities that traditional energy management approaches could never identify.

4-10%
Specific energy consumption reduction achieved by cement plants using AI root cause detection in finish grinding operations
$0.48
Average cost savings per ton of cement produced from AI-identified energy optimization opportunities
100+
Process variables monitored in real time for root cause detection of energy inefficiency
<5 sec
Time to identify the root cause of energy inefficiency with multivariate ML models
1.5-3
kWh per ton opportunity from recirculation load optimization

Recirculation load in a closed-circuit cement grinding mill represents the ratio of material returned to the mill from the separator versus new feed. When recirculation load drifts above the optimal range for the current product type and mill condition, energy consumption increases because the mill is grinding material that has already reached target fineness. AI root cause detection correlates mill power draw, separator current, and feed composition to identify the specific recirculation load deviation and its root cause — typically separator wear, airflow imbalance, or feed composition change — enabling corrective adjustment that recovers 1.5-3 kWh per ton.

1-2.5
kWh per ton savings from separator efficiency optimization

Separator efficiency directly determines how much of the mill's grinding energy is applied to material that still needs size reduction versus material that has already reached target fineness. A separator operating below design efficiency — due to vane wear, rotor speed drift, or airflow distribution imbalance — forces the mill to over-grind material that should have been discharged to the product stream. AI root cause detection identifies separator efficiency degradation by correlating separator power draw, differential pressure, and product fineness measurements, enabling targeted maintenance or adjustment that restores efficiency and recovers 1-2.5 kWh per ton.

0.5-2
kWh per ton variation from clinker grindability shifts

Clinker grindability — measured by the Bond Work Index or equivalent — varies with kiln operating conditions, raw mix chemistry, and cooling rate. A shift in clinker grindability that increases the energy required to achieve target fineness by 10% directly adds 3-4 kWh per ton to grinding energy consumption if mill operating parameters are not adjusted. AI root cause detection correlates mill power draw response with clinker chemistry data and cooler operating parameters to identify grindability shifts within minutes, enabling proactive mill parameter adjustment that maintains energy efficiency despite changing clinker characteristics.

0.5-1.5
kWh per ton impact from mill temperature excursions

Mill temperature affects grinding efficiency through its influence on material rheology, gypsum dehydration, and mill coating conditions. High mill inlet temperatures from hot clinker reduce grinding efficiency by accelerating gypsum dehydration and increasing mill coating, while low temperatures increase material moisture and reduce separator efficiency. AI root cause detection monitors mill inlet and outlet temperature in correlation with clinker cooler status, feed composition, and ambient conditions to identify temperature excursions and their root causes — enabling corrective action that recovers 0.5-1.5 kWh per ton in energy efficiency.

The Real Cost of Unidentified Root Causes in Cement Grinding Energy

Every untagged root cause of energy inefficiency in cement grinding has a compounding cost that extends beyond the immediate energy waste. When a recirculation load deviation goes unidentified, the excess energy consumption continues shift after shift, month after month — accumulating thousands of dollars in avoidable energy cost while the mill operates at sub-optimal efficiency. When separator degradation goes undetected, the resulting product fineness variability triggers scrap events that consume additional energy for reprocessing. The following gaps represent the most common energy optimization opportunities that AI root cause detection identifies — and that traditional monitoring systems miss entirely.

Recirculation Load Drift
Recirculation load drifts above optimal range due to separator vane wear, airflow imbalance, or feed composition change. Without AI root cause detection, the drift continues until it causes a quality deviation that triggers investigation — weeks or months of excess energy consumption.
Separator Efficiency Degradation
Separator rotor wear, vane erosion, or cage wheel imbalance reduces classification efficiency by 5-15% before it produces measurable fineness changes. The energy waste from inefficient classification continues undetected between scheduled inspection intervals.
Grinding Media Wear Interaction
As grinding media wears, the mill's energy transfer to the material bed decreases — but standard power draw monitoring cannot distinguish between normal load variation and efficiency loss from media wear. AI root cause detection isolates the media wear signature from other operating variables.
Mill Coating and Blinding
Mill coating — material buildup on grinding media and mill liners — reduces grinding efficiency by 8-15% before it manifests as a fineness deviation or mill power draw change large enough to trigger operator attention. The energy waste accumulates silently between mill maintenance stops.
$0.48/ton
Average energy cost savings per ton of cement produced from AI root cause optimization
4-10%
Specific energy consumption reduction achieved across commercial deployments
60-70%
Energy's share of total cement grinding production cost
Every Hour of Unidentified Energy Inefficiency Costs Thousands. AI Root Cause Detection Finds It in Seconds.
iFactory's AI root cause detection platform correlates 100+ process variables in real time to identify the specific operating conditions driving energy inefficiency in cement grinding — delivering 4-10% specific energy reduction without capital equipment investment. Book a free Cpk and audit-readiness assessment to see what your current monitoring system is missing.

How AI Root Cause Detection Identifies Energy Optimization Opportunities in Cement Grinding

AI root cause detection for energy optimization in cement grinding operates through a systematic process that begins with data ingestion from mill DCS sensors and ends with specific, actionable recommendations for parameter adjustment. The platform's machine learning models are trained on 12-24 months of historical data correlating mill operating parameters with specific energy consumption measurements, enabling the identification of the specific variable combinations that drive energy inefficiency under current operating conditions. Quality leaders who schedule a platform review receive a detailed demonstration of how each stage of the root cause detection process is configured for their specific mill configuration and product portfolio.

01
Historical Data Ingestion and Energy Baseline Modeling
iFactory ingests 12-24 months of mill operating data — mill power draw, separator speed, feed rate, recirculation load, temperature profiles, and specific energy consumption — to establish baseline energy efficiency models for each product type and mill configuration.
02
Real-Time Multivariate Monitoring with Western Electric Rules
Western Electric rules are applied to each process variable to detect early-stage pattern deviations — runs, trends, and cycles — within individual sensor streams before they produce measurable energy efficiency degradation.
03
Correlation ML for Interaction Effect Detection
Multivariate regression and random forest models analyze correlations between all monitored variables simultaneously, identifying interaction effects that single-variable Western Electric rules would miss — for example, a separator speed drift that only increases energy consumption when clinker temperature is elevated.
04
Adaptive UCL/LCL for Dynamic Energy Baseline
iFactory's adaptive control limits automatically adjust energy efficiency baselines for feed composition changes, ambient conditions, and equipment wear state — eliminating false alarms from normal process variation while detecting genuine energy efficiency degradation.
05
Root Cause Output with Energy Impact Quantification
When energy efficiency degradation is detected, the platform identifies the specific root cause variable combination and quantifies the energy impact in kWh per ton — enabling quality leaders to prioritize interventions based on energy savings potential.

Measured Energy and Quality Outcomes from AI Root Cause Detection Deployments

iFactory's AI root cause detection platform has been deployed across cement grinding operations in North America and Europe, delivering measurable energy reduction and quality improvement outcomes that compound over time. The following KPIs reflect aggregated performance data from cement plants using AI root cause detection for integrated energy and quality optimization in finish grinding operations.

4-10%
Specific Energy Reduction
Reduction in kWh per ton of cement produced through AI-identified root cause optimization opportunities across recirculation load, separator efficiency, and temperature management.
$0.48
Cost Savings per Ton
Average energy cost savings per ton of cement produced at $0.08-0.12/kWh from 4-10% specific energy reduction across all product types and mill configurations.
<5 sec
Root Cause Identification Time
Average time from energy efficiency degradation detection to automated root cause identification across 100+ process variables in finish grinding operations.
38%
Scrap Reduction
Reduction in off-spec cement production achieved by identifying root causes before deviations compound into scrap events that consume additional energy for reprocessing.
0.55
Average Cpk Improvement
Process capability improvement from continuous root cause detection enabling preventive quality interventions that maintain consistent fineness and particle size distribution.
8 wk
Average Deployment Time
Full deployment timeline from project kickoff to live root cause detection and energy optimization across all monitored mill parameters.
4-10%
Energy Reduction
Specific energy consumption reduction across commercial cement grinding deployments
$0.48
Savings per Ton
Average energy cost reduction per ton of cement produced
<5 sec
Root Cause Time
Time from detection to root cause identification across 100+ variables
8 wk
Time to Value
Full deployment from kickoff to live energy optimization alerts

Expert Perspective: What AI Root Cause Detection Changes in Cement Grinding Energy Management

We had been managing grinding energy consumption the same way for eight years — reviewing monthly specific energy reports and comparing them to budget targets. When the monthly report showed an increase, we would investigate, but by then the efficiency loss had already accumulated for days or weeks. Deploying iFactory's AI root cause detection transformed our approach completely. Within the first week, the platform identified that our recirculation load was drifting 12% above the optimal range during every shift transition because the incoming operators were setting separator speed based on their predecessor's handover notes rather than current mill conditions. This single root cause was consuming an extra 2.3 kWh per ton during every shift transition — costing us approximately $840 per day in wasted energy. We corrected the separator speed protocol based on the AI's root cause output, and the 2.3 kWh per ton excess was eliminated immediately. The platform paid for its first year of deployment in less than three months from that single finding.
Quality Assurance Manager
Cement Grinding Operations, 1.8M TPY Capacity — U.S. Midwest

How iFactory Compares to Standard Energy Monitoring and SPC in Cement Grinding

Most cement plants monitor energy consumption through mill power draw meters and monthly specific energy reports compiled from production totals. These approaches identify efficiency trends at the aggregate level but cannot pinpoint the root causes of energy inefficiency at the resolution required for corrective action. The following comparison illustrates how AI root cause detection differs from standard energy monitoring and single-variable SPC for energy optimization in cement grinding.

Capability Standard Energy Monitoring / SPC iFactory AI Root Cause Detection
Energy Monitoring Resolution Monthly or weekly specific energy reports aggregated from production totals Continuous real-time specific energy tracking per mill, per product, per shift — updated every minute
Root Cause Identification Manual investigation by process engineers using DCS trend review — 2-4 hours per event Automated root cause identification across 100+ variables in under 5 seconds with causal AI engine
Interaction Effect Detection Single-variable SPC charts that cannot detect interactions between mill power draw, separator speed, and feed composition Multivariate ML that identifies interaction effects — e.g., separator speed drift only impacts energy when clinker temperature is elevated
Energy Baseline Adaptation Fixed budget targets that do not adjust for feed composition, ambient conditions, or equipment wear state Adaptive UCL/LCL that adjusts energy baselines in real time based on current operating conditions — 70% fewer false alarms
Corrective Recommendation Operator experience and engineering judgment — no data-driven guidance on which parameter to adjust Ranked prescriptive recommendations with energy impact quantification — specific parameter adjustments ranked by savings potential
Energy Savings Compounding Reactive — savings identified after efficiency loss has already occurred and accumulated Preventive — root cause detected before efficiency loss compounds across hours or shifts of production

8-Week Deployment and ROI Roadmap: From Baseline Energy Audit to Live Optimization

Every iFactory AI root cause detection deployment for energy optimization follows a structured 8-week program with defined deliverables per phase — and measurable energy savings beginning from the first operating week after live deployment. No open-ended data science projects. No months of model tuning before a single root cause fires.

Weeks 1-3
Data Integration and Energy Baseline Assessment
Mill DCS data integration and historical data extraction. Energy baseline model established per mill, per product type with specific energy consumption profiling.
Western Electric rule engine configured with sensitivity parameters per variable. Adaptive UCL/LCL baselines established from historical operating data.
Data quality validation and completeness verification across all 100+ monitored variables.
Weeks 4-6
Model Training and Root Cause Engine Validation
Multivariate ML models trained on 12-24 months of historical data correlating mill parameters with energy consumption and quality outcomes.
Root cause identification accuracy validated against known historical energy efficiency events. Prescriptive recommendation engine calibrated for energy impact quantification.
Quality leader dashboard configured with real-time energy efficiency alerts, root cause displays, and energy savings tracking.
Weeks 7-8
Go Live and Energy Optimization Activation
Live root cause detection activated across all monitored mill parameters. Energy optimization alerts and prescriptive recommendations operational.
Quality leader and operator training completed. Alert response protocols and escalation procedures established.
First energy savings interventions executed. ROI baseline report delivered with measured energy reduction from AI-identified root causes.
ENERGY ROI FROM WEEK 8: MEASURABLE SAVINGS FROM FIRST OPTIMIZATION CYCLE
Plants completing the 8-week program report an average of $0.36-$0.48 per ton in energy cost savings from the first month of full production rollout — with specific energy consumption reduction of 4-10% documented across all product types. Energy optimization ROI alone achieves full platform payback within 6-10 months, with additional ROI from scrap reduction, Cpk improvement, and maintenance optimization compounding the total return.
4-10%
Energy reduction in first quarter
$0.48
Avg savings per ton produced
8 wk
Full deployment timeline
AI Root Cause Detection for Energy Optimization — Integration and Compliance Checklist
Mill DCS integration — ABB 800xA, Siemens PCS 7, Emerson DeltaV, Rockwell PlantPAx
Laboratory LIMS integration — LabVantage, StarLIMS, SampleManager bidirectional connectors
Read-only historian connectivity — OPC-UA and Modbus TCP with no write-back to OT systems
ISO 9001 and ASTM C150 compliance documentation generated automatically from root cause records
On-premise deployment available for NERC CIP-compatible and air-gapped OT network environments
Continuous model retraining from confirmed root cause events — accuracy improves 12% per cycle

Frequently Asked Questions

AI root cause detection identifies the specific operating condition combinations driving energy inefficiency — recirculation load drift, separator efficiency degradation, temperature excursions — and enables operators to correct them through parameter adjustments that consume no capital budget. The 4-10% energy reduction comes from operating the existing equipment at its optimal efficiency point, not from equipment replacement or modification.
The model ingests mill power draw, separator RPM and current, mill feed rate, recirculation load, mill inlet and outlet temperature, differential pressure, grinding aid dosage, gypsum and limestone feed rates, clinker temperature and chemistry, separator vane position, and specific energy consumption — typically 100-120 variables depending on plant instrumentation depth.
Cement plants deploying AI root cause detection in finish grinding achieve 4-10% reduction in specific energy consumption, with the average across commercial deployments at 6.2%. At $0.08-0.12/kWh, this translates to $0.36-$0.48 per ton in energy cost savings — approximately $360,000-$480,000 per year for a 1M ton plant.
Standard SPC applies Western Electric rules to each variable independently with fixed control limits. iFactory applies rules across 100+ variables simultaneously with adaptive UCL/LCL that adjust for operating conditions, and feeds rule violations into the multivariate root cause engine that identifies interaction effects — catching energy efficiency deviations that single-variable SPC would miss.
Typical deployment from kickoff to live energy optimization is 8 weeks. Measurable energy savings begin in the first week after live deployment, with the first root cause-identified energy optimization typically implemented within the first operating shift. Full ROI is achieved within 6-10 months from energy savings alone, excluding additional savings from scrap reduction and Cpk improvement.

Conclusion: From Energy Cost Management to Real-Time Energy Optimization

The cement grinding operations that will lead the industry in energy efficiency, production cost, and environmental performance over the next decade are those that have closed the gap between energy data collection and root cause identification. Monthly specific energy reports tell you what happened. AI root cause detection tells you why it happened, what combination of variables caused it, and exactly which parameter adjustment will restore optimal efficiency — in real time, for every operating condition, without waiting for the end-of-month report.

The technology is proven across commercial cement grinding deployments, the implementation timeline is measured in weeks, and the energy savings deliver measurable ROI from the first month of operation. For quality leaders responsible for energy cost management, Cpk targets, and environmental compliance, the decision is not whether AI root cause detection will become the standard for cement grinding energy optimization — it is which plants will capture the 4-10% energy reduction of early adoption and which will continue managing energy efficiency with monthly reports that arrive too late to act on.

Turn 100+ Process Variables Into a Continuous Energy Optimization Engine. Deploy in 8 Weeks. Savings in Month One.
iFactory's AI root cause detection platform delivers real-time energy efficiency monitoring, automated root cause identification in under 5 seconds, and 4-10% specific energy reduction for cement grinding operations — purpose-built for quality leaders managing finish mill energy performance and compliance.
4-10% Energy Reduction
$0.48/Ton Savings
100+ Variable Monitoring
8-Week Deployment
Adaptive UCL/LCL

Share This Story, Choose Your Platform!