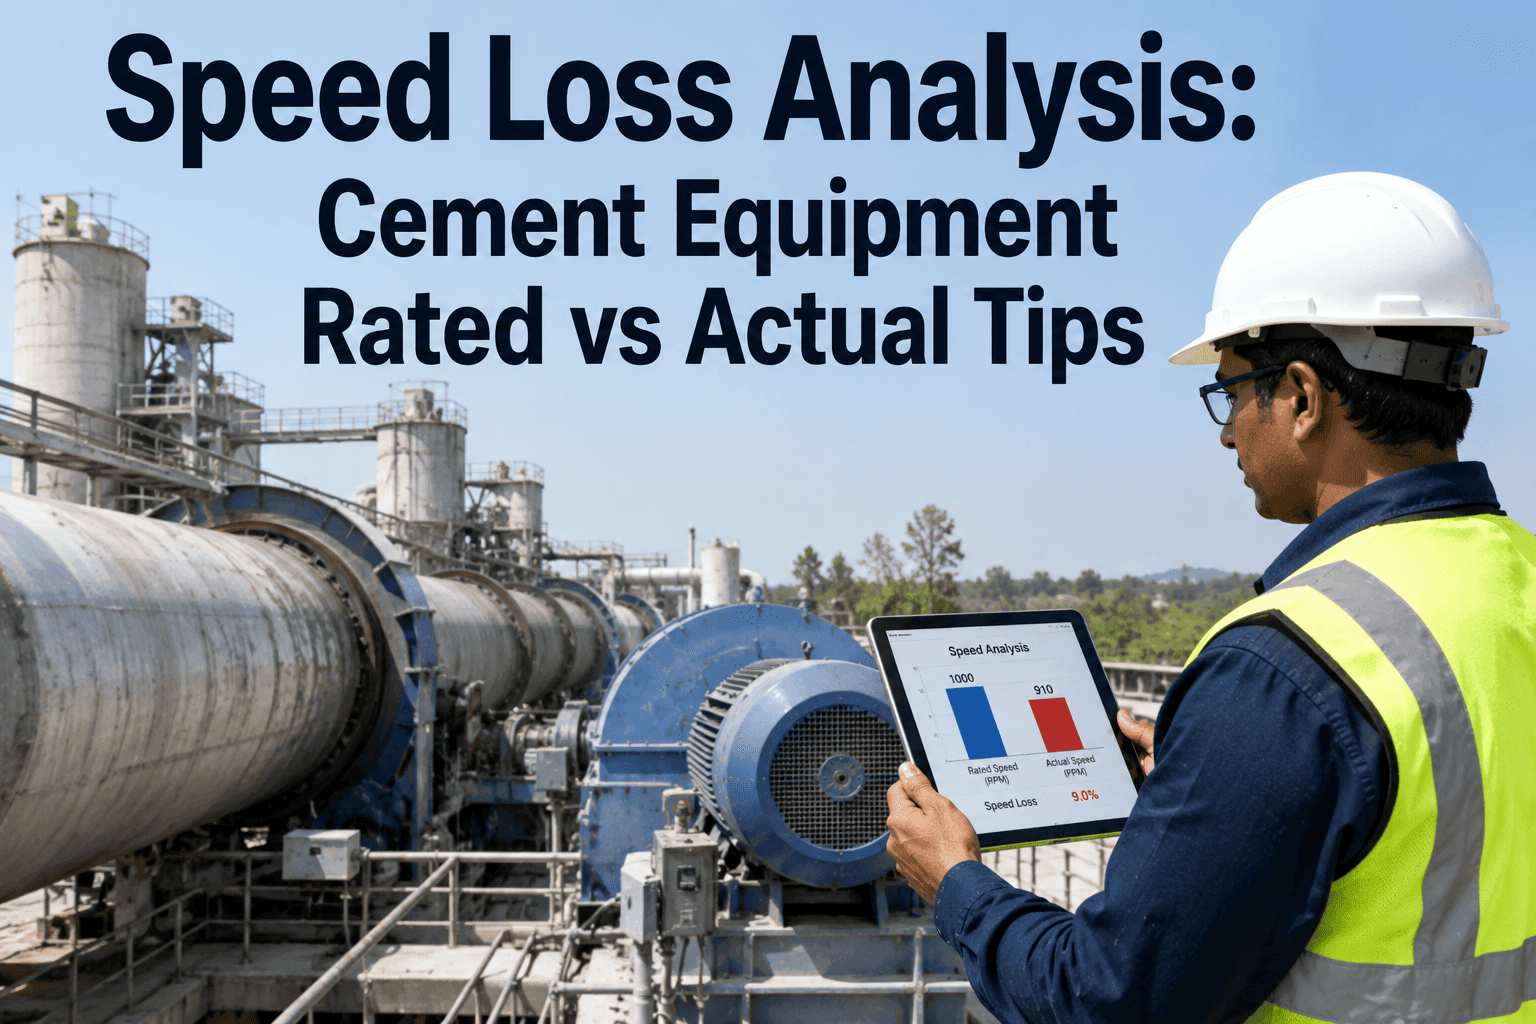
A cement mill rated to grind 200 tons an hour rarely holds that number for an entire shift, and the gap between what the nameplate promises and what the control room log actually shows is almost always hiding inside performance rate rather than downtime. Unlike a tripped breaker or a jammed chute, a mill running ten percent below design speed for hours at a time never shows up as a stoppage on a shift report, which is exactly why it goes unnoticed longer than almost any other loss a plant tracks, and iFactory surfaces that gap in real time through a Book a Demo.
Find The Output Your Mill Is Already Capable Of, Without Adding Equipment
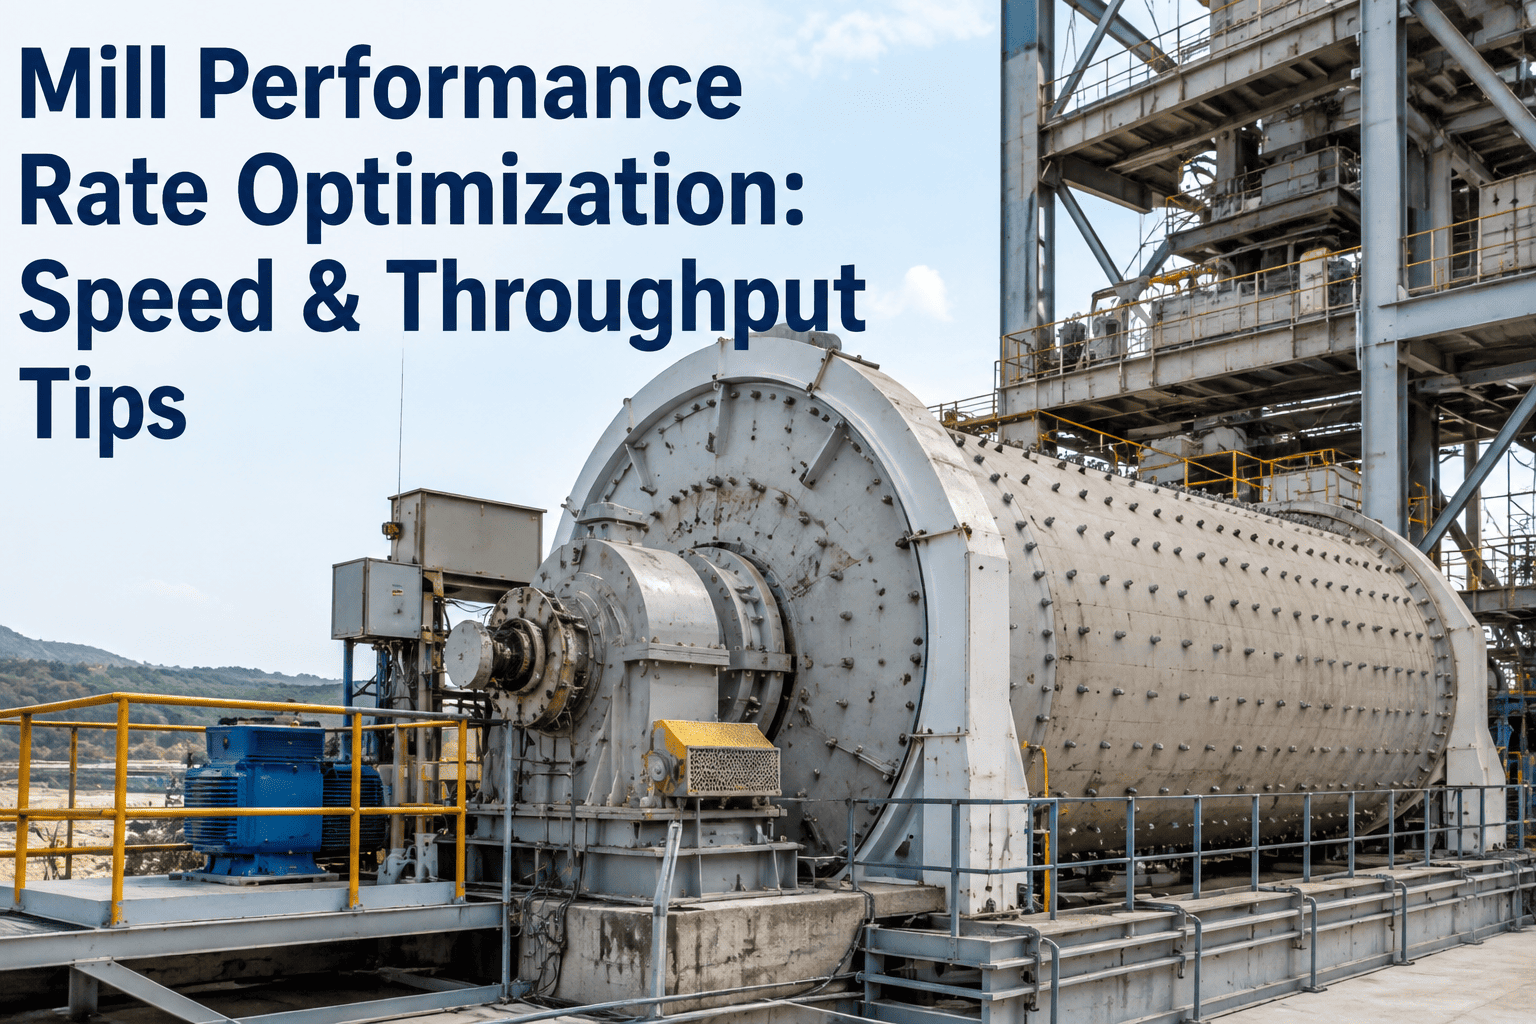
Performance rate measures how close a running mill gets to its design throughput, and closing even a modest gap here often unlocks more tonnage than any downtime-reduction project on the plant.
Performance Rate Is The Middle Term Everyone Forgets To Measure
Overall equipment effectiveness is the product of three separate ratios: availability, which asks how much scheduled time the mill was actually running; performance rate, which asks how fast it ran while it was running, compared with its design or nameplate rate; and quality, which asks how much of what it produced met specification. Most plants track availability closely because a stopped mill is impossible to miss, and quality closely because off-spec product triggers an immediate rejection. Performance rate is the term that slips through, because a mill running at reduced speed still looks productive on a shift log — tonnage is still coming off the discharge, the amps are still drawn, nothing has alarmed — even though the plant is quietly leaving capacity on the table for the entire run.
The formula itself is simple: performance rate equals actual output divided by the output the mill should have produced at its design rate over the same running time. A mill designed for 200 tons per hour that runs for eight hours but only produces 1,312 tons, instead of the 1,600 tons design speed would predict, is running at a performance rate of 82 percent, even though it never once stopped during the shift. That 18-point gap is invisible to anyone only watching for downtime alarms, which is exactly why performance losses tend to persist far longer than availability losses before anyone investigates them.
This also explains why two plants can report nearly identical overall tonnage for a month while sitting on very different underlying OEE profiles. One plant might have excellent performance rate but mediocre availability, losing tonnage mainly to scheduled and unscheduled stoppages, while another runs almost continuously but at a chronically depressed speed. Both plants would benefit from very different improvement projects, which is exactly why performance rate needs to be tracked as its own distinct number rather than folded into a single blended output figure that hides which of the three OEE components is actually the constraint.
Speed Loss And Minor Stops Make Up Almost All Of The Performance Gap
Performance loss on a mill almost always traces back to one of two mechanisms, and distinguishing between them matters because the fixes for each look completely different. Speed loss tends to be a deliberate, if often forgotten, operating decision, while minor stops are usually the accumulated result of small mechanical or material issues that no one has bothered to trace back to a root cause because each individual occurrence seems too minor to justify the investigation.
The mill runs continuously but below its design rate, often because an operator has intentionally throttled it back to manage vibration, feed variability, or a downstream bottleneck, and that reduced setting is never revisited once the original reason has passed. Because nothing alarms and tonnage still flows, this setting can persist for months or even years without anyone questioning whether it is still necessary.
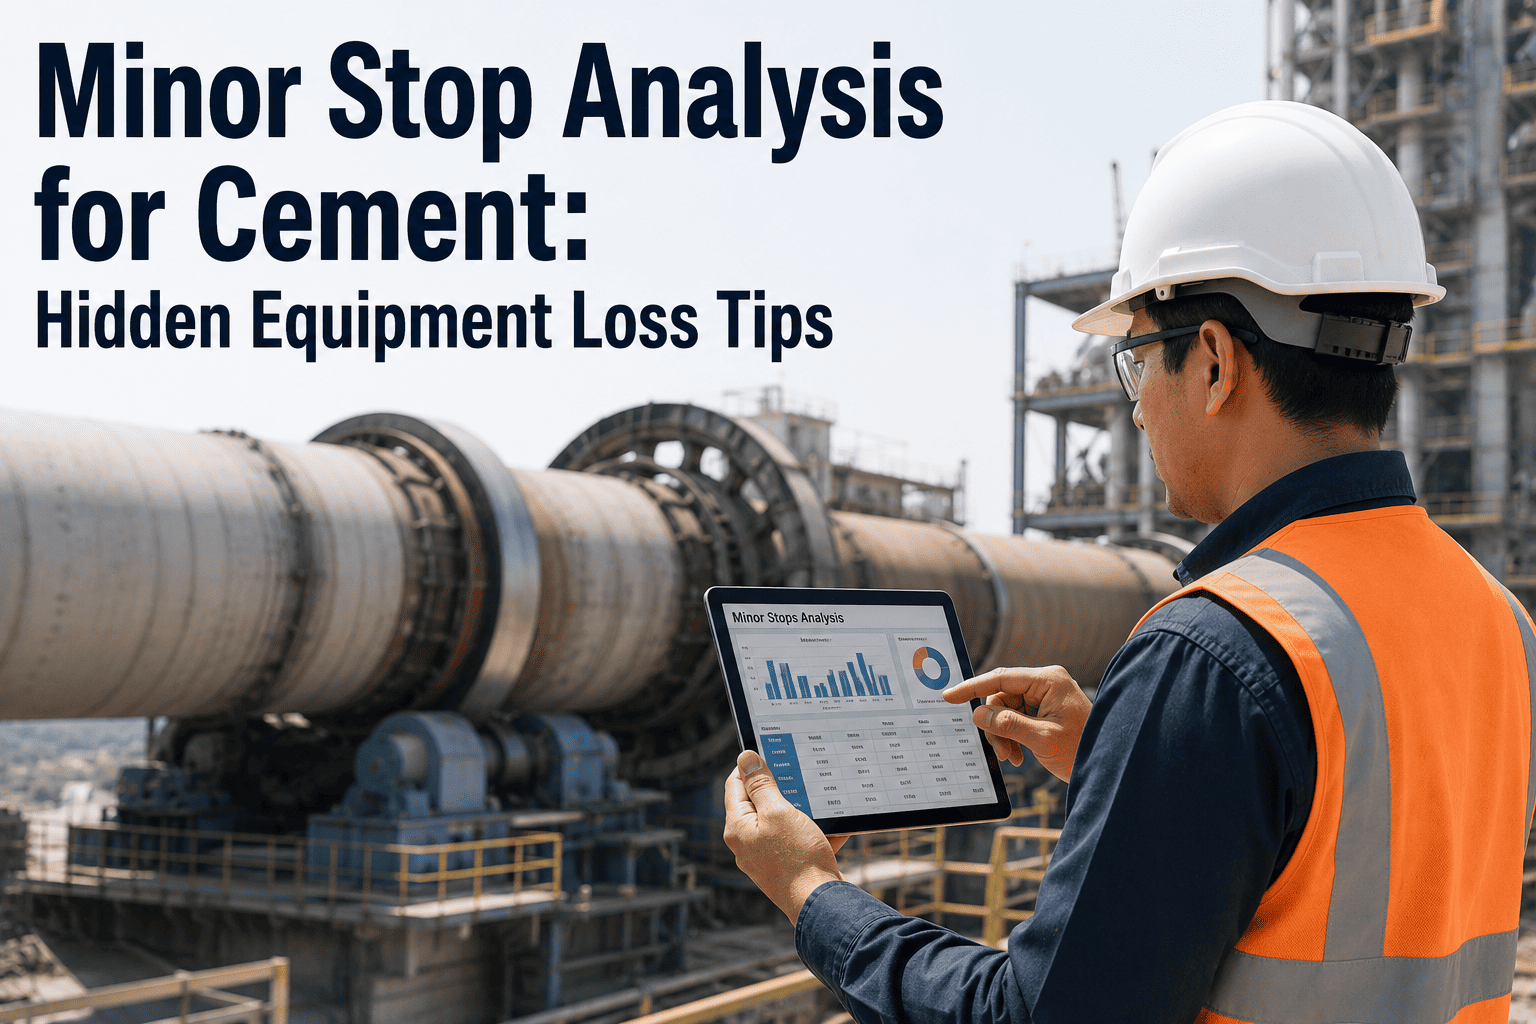
The mill stops and restarts repeatedly for periods too short to log as a formal downtime event — a blocked chute cleared in ninety seconds, a feeder hiccup, a brief interlock trip — and each one individually looks trivial but adds up across a shift. A shift with forty such interruptions of ninety seconds each has lost an hour of running time that will never appear on a downtime report at all.
Common Sources Of Performance Loss And Their Typical Impact
The table below lists the causes that most frequently show up once a plant starts investigating a persistent performance rate gap on a mill circuit. None of these causes are exotic or hard to understand once identified, which is exactly what makes them frustrating in hindsight — most plants that finally trace a long-standing performance gap back to its source find the underlying issue had been sitting in plain sight the entire time, simply never connected to the tonnage it was quietly costing.
| Cause Category | Typical Example | Typical Performance Impact |
|---|---|---|
| Reduced Speed Operation | Operator throttles mill back to manage vibration | 5-15% below design rate |
| Minor Stops & Idling | Repeated short chute blockages | 5-10% lost to cumulative micro-stoppages |
| Material Feed Variability | Inconsistent raw feed moisture or sizing | 3-8% lost to inconsistent grinding rate |
| Worn Liners Or Grinding Media | Liner profile degraded past optimal wear point | 4-10% lost to reduced grinding efficiency |
| Undersized Downstream Equipment | Separator or conveyor capping mill throughput | Variable, often the largest single factor |
These figures overlap in most real mills, since a worn liner and a feed variability issue often compound each other, which is why performance losses need to be trended over time rather than diagnosed from a single shift's data. A mill showing a stable ten percent gap for months is telling a different story than one whose gap widens and narrows with each shift change or with each change in raw material source, and the investigation should follow whichever pattern the data actually shows rather than assuming a single dominant cause from the outset.
The Value Sitting Inside A Modest Performance Rate Improvement
Because performance rate multiplies directly against availability and quality to produce OEE, even a small improvement here tends to translate into a proportional gain in usable output, without a single additional hour of run time or a single additional ton of raw feed. This is what makes performance rate projects unusually attractive from a capital-efficiency standpoint: the mill, the drive, and the grinding media are already paid for, and the gain comes almost entirely from operating the existing asset closer to what it was designed to do.
See Actual Mill Speed Against Design Rate, Updated Continuously
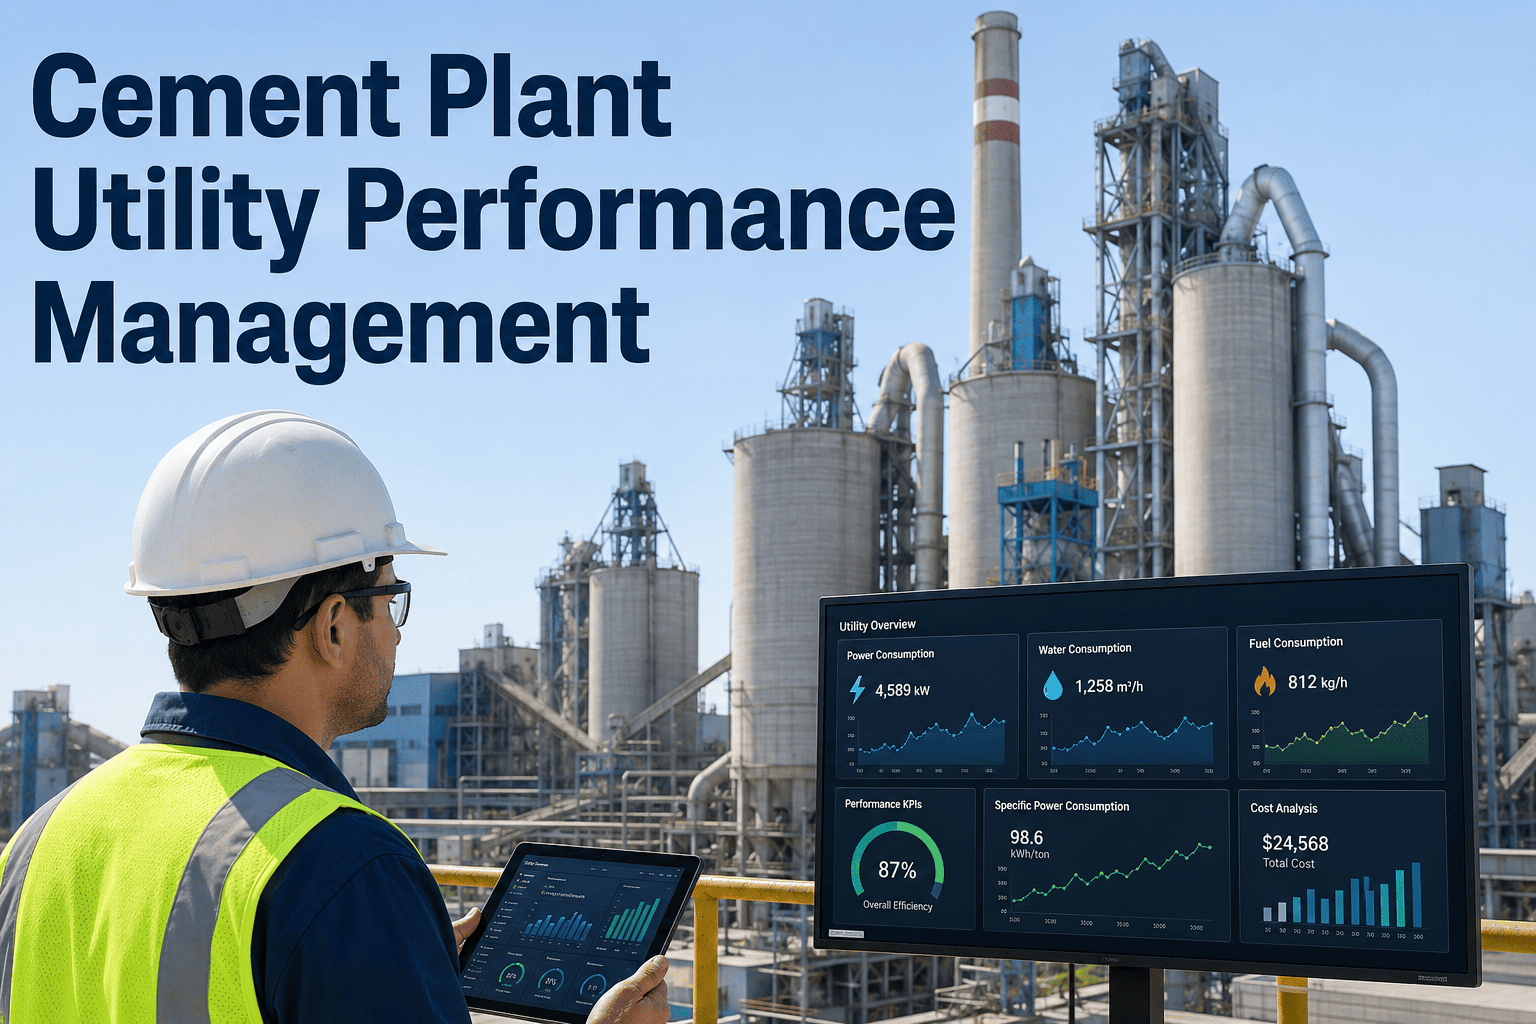
iFactory plots real-time mill speed and minor-stop frequency against design capacity, so a quiet performance leak shows up on a dashboard instead of hiding inside a shift report that only tracks tonnage.
A Practical Sequence For Recovering Lost Performance Rate
Plants that successfully close a performance rate gap tend to follow the same general sequence, starting with visibility before moving into any physical change on the mill. Skipping straight to a mechanical fix without first confirming where the loss is actually concentrated often means solving a problem that wasn't the biggest contributor in the first place, while the real driver of the gap goes untouched.
Establish A True Design Rate Baseline
Confirm the nameplate or design rate actually reflects current product mix and fineness targets, since a baseline set for a different product blend will always show a misleading gap. Many mills are still measured against a design figure that predates a product change made years earlier, which produces a performance number that never quite matches operator experience on the floor.
Trend Actual Speed Against That Baseline Continuously
A single shift snapshot hides intermittent losses; continuous trending across weeks reveals whether the gap is constant, shift-dependent, or tied to a specific product change. Patterns that only show up over several weeks are exactly the ones a single-day audit is most likely to miss entirely.
Separate Speed Loss From Minor Stops In The Data
These two loss types have different root causes and different fixes, so lumping them into one performance number makes it far harder to know where to start improving. A mill losing most of its gap to minor stops needs a very different investigation than one losing it to a single sustained speed reduction.
Investigate The Largest Recurring Cause First
Whether that's liner wear, feed variability, or a downstream bottleneck, tackling the single largest recurring contributor typically returns more gain than spreading effort thin across every minor cause at once.
Re-Baseline And Repeat
Once a fix is in place, confirm the new sustained performance rate before moving to the next cause, since improvements that aren't verified against trend data tend to quietly erode back to the old baseline.
Mistakes That Keep A Performance Gap From Closing
A handful of recurring mistakes explain why some plants chase a performance rate gap for years without meaningful progress.
Treating Every Minor Stop As Unimportant
A ninety-second stoppage feels too small to investigate individually, but a mill accumulating dozens of them per shift is losing far more tonnage than a single hour-long stop that gets a full root-cause review, simply because the total minor-stop time so rarely gets added up and compared against the big, obvious stoppages that draw all the attention.
Never Revisiting A Reduced Speed Setting
Speed reductions made to manage a temporary issue often stay in place long after the original cause is resolved, simply because no one is assigned to periodically check whether the setpoint can be restored, and the longer a reduced setting sits unquestioned, the more it starts to feel like the mill's normal operating condition rather than a workaround.
Using A Stale Or Incorrect Design Rate
Comparing actual output against a design rate that no longer matches current product fineness or blend produces a performance number that misleads every decision built on top of it.
Our finish mill had been running at what we thought was close to full output for years, but once we started trending actual speed against design rate continuously, we found we were sitting closer to 80 percent performance rate most weeks, mostly from an operating speed that had been dialed back during a vibration issue two years earlier and simply never revisited. Restoring that setpoint and tightening our feed consistency brought us to the low nineties within a quarter, which added meaningfully more tonnage than any project we had budgeted for that year, and it cost us essentially nothing beyond the time it took to trend the data and confirm the fix held.
Frequently Asked Questions
Q: What is considered a good performance rate for a cement mill?
Well-run mills commonly sustain performance rates in the low-to-mid nineties, though the achievable ceiling depends heavily on product mix, feed material variability, and the mechanical condition of the mill itself. Mills producing a wide range of cement types with frequent changeovers typically run lower than a mill producing a single consistent product continuously, simply because changeover periods almost always run at reduced speed while the process stabilizes. Comparing your rate against a mill of similar type and product range, rather than against a generic industry figure, gives a more realistic sense of how much room actually remains. A Book a Demo session can help benchmark your current rate against comparable operations.
Q: How is performance rate different from tracking downtime?
Downtime, tracked through the availability component of OEE, only captures time when the mill was completely stopped against its schedule, while performance rate captures the separate loss that occurs when the mill is running but at less than its design speed. A mill can have excellent availability, running nearly every scheduled minute, while still leaving significant tonnage on the table through reduced speed or accumulated minor stops that never register as formal downtime events. Both metrics are needed together to see the full picture of lost capacity.
Q: Do minor stops need to be tracked individually if each one is so short?
Yes, because the cumulative effect of dozens of short stoppages per shift routinely exceeds the tonnage lost to a single formally logged downtime event, even though no individual minor stop looks significant on its own. Tracking them individually, including their cause, also reveals patterns that a shift-level summary hides entirely, such as a specific feeder or chute that triggers a disproportionate share of the total minor-stop count. Once that pattern is visible, a targeted fix on that one component often recovers more performance than a broad initiative spread across the whole line.
Q: Can improving performance rate reduce energy cost per ton?
In most cases yes, since a mill drawing roughly the same power whether it runs at reduced speed or design speed produces less usable output per unit of energy consumed when performance rate is low. Closing a performance gap therefore tends to improve specific energy consumption alongside raw throughput, which is one of the reasons performance rate projects often pay for themselves faster than throughput alone would suggest. The exact energy relationship varies by mill type and drive configuration, so measuring it directly on your own equipment gives a more reliable figure than a general industry rule of thumb.
Q: How often should design rate baselines be reviewed?
Design rate baselines should be reviewed whenever a plant changes product mix, fineness target, or grinding media configuration, and as a general practice at least once a year even without an obvious trigger, since gradual changes in feed material or equipment condition can shift the realistic achievable rate without anyone deciding to change it. A baseline left unreviewed for several years often no longer reflects current operating reality in either direction, understating genuine gains in some cases and masking real losses in others. Reach out through Support Contact to discuss reviewing yours.
Turn Your Mill's Hidden Performance Gap Into Tonnage You Can Count On.
iFactory gives you continuous visibility into speed loss and minor stops so the next percentage point of performance rate gets found and fixed, not lost in a shift report.