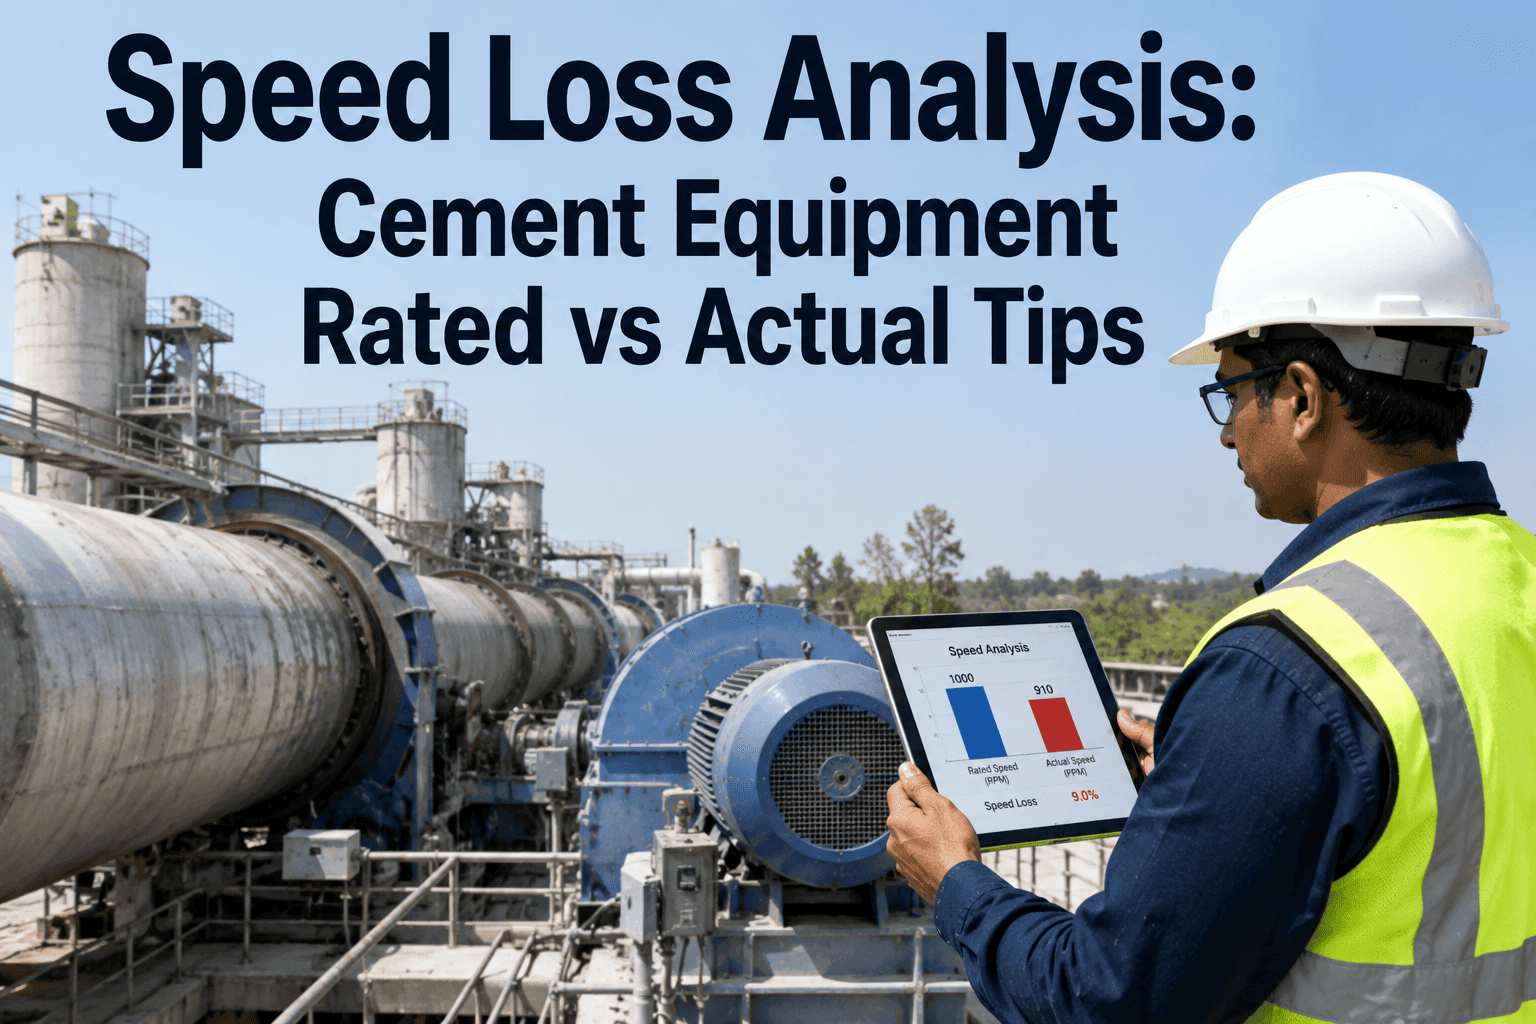
A raw mill nameplate reads 220 tons per hour. The DCS trend for the same mill, averaged over a full production month, sits closer to 178 tons per hour, and nobody on the floor can point to a single fault that explains the gap. That gap is not downtime, and it will never show up on an availability report, because the mill never stopped running. It is speed loss, the quietest of the three components inside OEE, and in most cement plants it is the one nobody is actually measuring, which is exactly what makes it worth reading before your next production review, and it is also the exact gap a structured demo of iFactory is built to expose.
Your Kiln, Mill, and Crusher Are Running. They Are Just Not Running at the Speed You Paid For
Rated speed is a number on a datasheet. Actual speed is what the equipment does once feed variability, wear, control logic, and operator habit all get a vote. The distance between those two numbers is speed loss, and in a typical cement plant it quietly erodes more tonnage over a year than most unplanned shutdowns combined.
Speed Loss Is the Part of OEE Nobody Puts on the Shift Report
Ask a shift supervisor about downtime and you will get a precise answer within seconds, because stoppages are visible, logged, and usually already tied to a work order. Ask the same supervisor how far the kiln, the cement mill, or the packing line ran below rated speed last week, and the answer is usually a shrug, because that number rarely gets calculated at all. Availability loss and quality loss both leave obvious fingerprints, a red block on a Gantt chart or a rejected batch on a quality log. Speed loss leaves nothing but a slightly lower tonnage total at the end of the shift, and a slightly lower tonnage total gets absorbed into a dozen other explanations before anyone traces it back to the equipment simply running slower than it was designed to.
This matters more in cement than in almost any other process industry because cement equipment is chosen and sized around a rated throughput figure that then becomes the reference point for every capacity plan, every energy-per-ton calculation, and every commitment made to a customer waiting on a delivery schedule. When actual speed consistently sits below that rated figure, the plant is not failing to hit an aspirational target, it is failing to extract the output the equipment was purchased to deliver, month after month, without a single alarm ever firing to say so.
The reason this loss survives so long uncorrected is structural. Speed loss analysis requires comparing a design or rated speed against a trended actual speed over a meaningful time window, then attributing the gap to a cause, and very few plants have that comparison built into a daily or weekly routine. Without it, speed loss simply becomes the invisible tax on every ton the plant produces, present in the numbers but absent from the conversation.
Rated Speed Is a Single Number. Actual Speed Is a Story Told by Five Different Systems
Rated speed comes from the equipment manufacturer, tested under close to ideal conditions with a defined feed specification, and it is the number stamped on the nameplate and written into every capacity study the plant has ever produced. Actual speed is what the equipment settles into once real feed variability, wear on internal components, and control system behavior all interact simultaneously, and it almost never matches the nameplate for more than short stretches at a time.
The comparison only becomes useful once it is broken down by equipment type, because a raw mill, a kiln, and a packing line lose speed for genuinely different reasons, and lumping them together into one plant-wide performance percentage hides exactly the detail a reliability team needs to act on.
A Rated vs Actual Table Only Works If You Also Capture the Reason for the Gap
A number showing actual speed running below rated speed tells a plant that a problem exists, but it does not tell anyone what to fix. The value of a proper speed loss analysis comes from pairing every recorded gap with a documented, specific cause, so that patterns become visible across weeks and months instead of being re-diagnosed from scratch every time someone finally notices the shortfall.
Plants that get real value from this exercise typically log the comparison at the same interval they already use for shift reporting, then review the accumulated pattern on a weekly basis to separate one-off events, such as a temporary feed quality issue, from a persistent limitation, such as wear that has quietly eroded design capacity over several months.
| Equipment | Rated Speed | Typical Actual Range | Most Common Cause of Gap |
|---|---|---|---|
| Raw Mill | 220 TPH | 175-195 TPH | Feed moisture and grindability variance beyond design basis |
| Cement Mill | 160 TPH | 130-150 TPH | Liner and media wear extending residence time |
| Kiln | 6,000 TPD | 5,200-5,700 TPD | Conservative feed rate to protect refractory condition |
| Packing Line | 1,800 bags/hr | 1,450-1,650 bags/hr | Accumulated micro-stoppages and manual throttling |
See Your Own Rated vs Actual Gap Before Next Month's Production Review
iFactory pulls rated speed, live trended speed, and cause codes into one dashboard, so the gap that used to surface as a vague shortfall gets a name, a number, and an owner.
Why Availability, Performance, and Quality Cannot Be Fixed With the Same Corrective Action
Overall Equipment Effectiveness is often reported as a single blended percentage, and that single number is genuinely useful for a monthly scorecard, but it is close to useless for deciding what to fix on Monday morning. OEE is built from three separate components, and each one responds to a completely different type of intervention, which means a plant chasing one blended number can easily spend a maintenance budget on the wrong problem entirely.
Speed loss sits inside the performance component specifically, distinct from the stoppages that drive availability loss and the rejects that drive quality loss, and confusing the three is the single most common reason an improvement initiative stalls despite genuine effort from the maintenance and operations teams involved.
| OEE Component | What It Measures | Typical Fix |
|---|---|---|
| Availability Loss | Time equipment was scheduled to run but was stopped, planned or unplanned | Maintenance scheduling, spares management, breakdown reduction |
| Performance (Speed) Loss | Gap between rated speed and actual speed while equipment is running | Feed control, wear management, control loop tuning, operator standard work |
| Quality Loss | Output produced that does not meet specification and must be reworked or scrapped | Process parameter control, raw material consistency, in-line quality checks |
The Real Reasons Cement Equipment Runs Below Its Rated Speed
Once a plant starts tracking the rated vs actual gap consistently, the same handful of root causes tend to explain the large majority of the shortfall across nearly every equipment type, even though the mechanical details differ. Recognizing these patterns early lets a reliability team target the specific fix rather than applying a generic maintenance response to a problem that maintenance alone cannot solve.
What Actually Changes Once Speed Loss Gets Tracked and Attributed
The plants that see a real throughput improvement from speed loss analysis are not the ones that discover a single dramatic fix. They are the ones that build the rated vs actual comparison into a routine, attribute every meaningful gap to a specific cause, and then work through that list of causes systematically, closing the gap a few percentage points at a time rather than expecting one intervention to solve the entire shortfall at once.
Common Questions From Cement Plant Reliability and Process Teams
Stop Letting Speed Loss Hide Inside a Single Blended OEE Number
iFactory separates availability, performance, and quality loss automatically, and tracks rated versus actual speed by equipment so recovered tonnage becomes a plan instead of a guess.