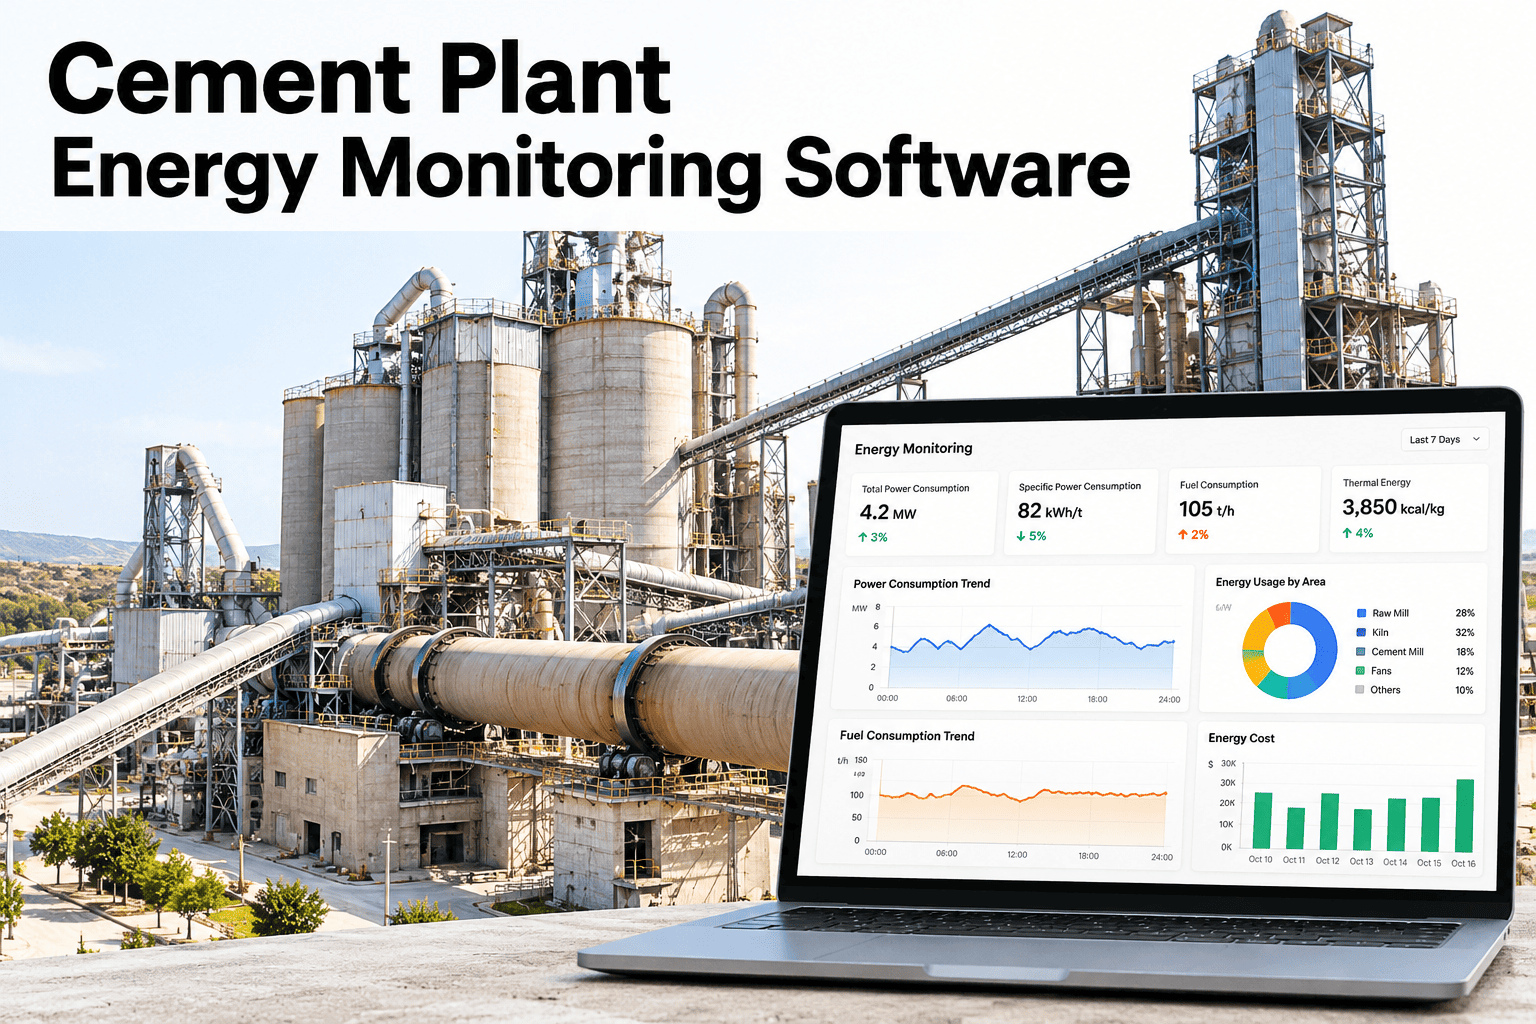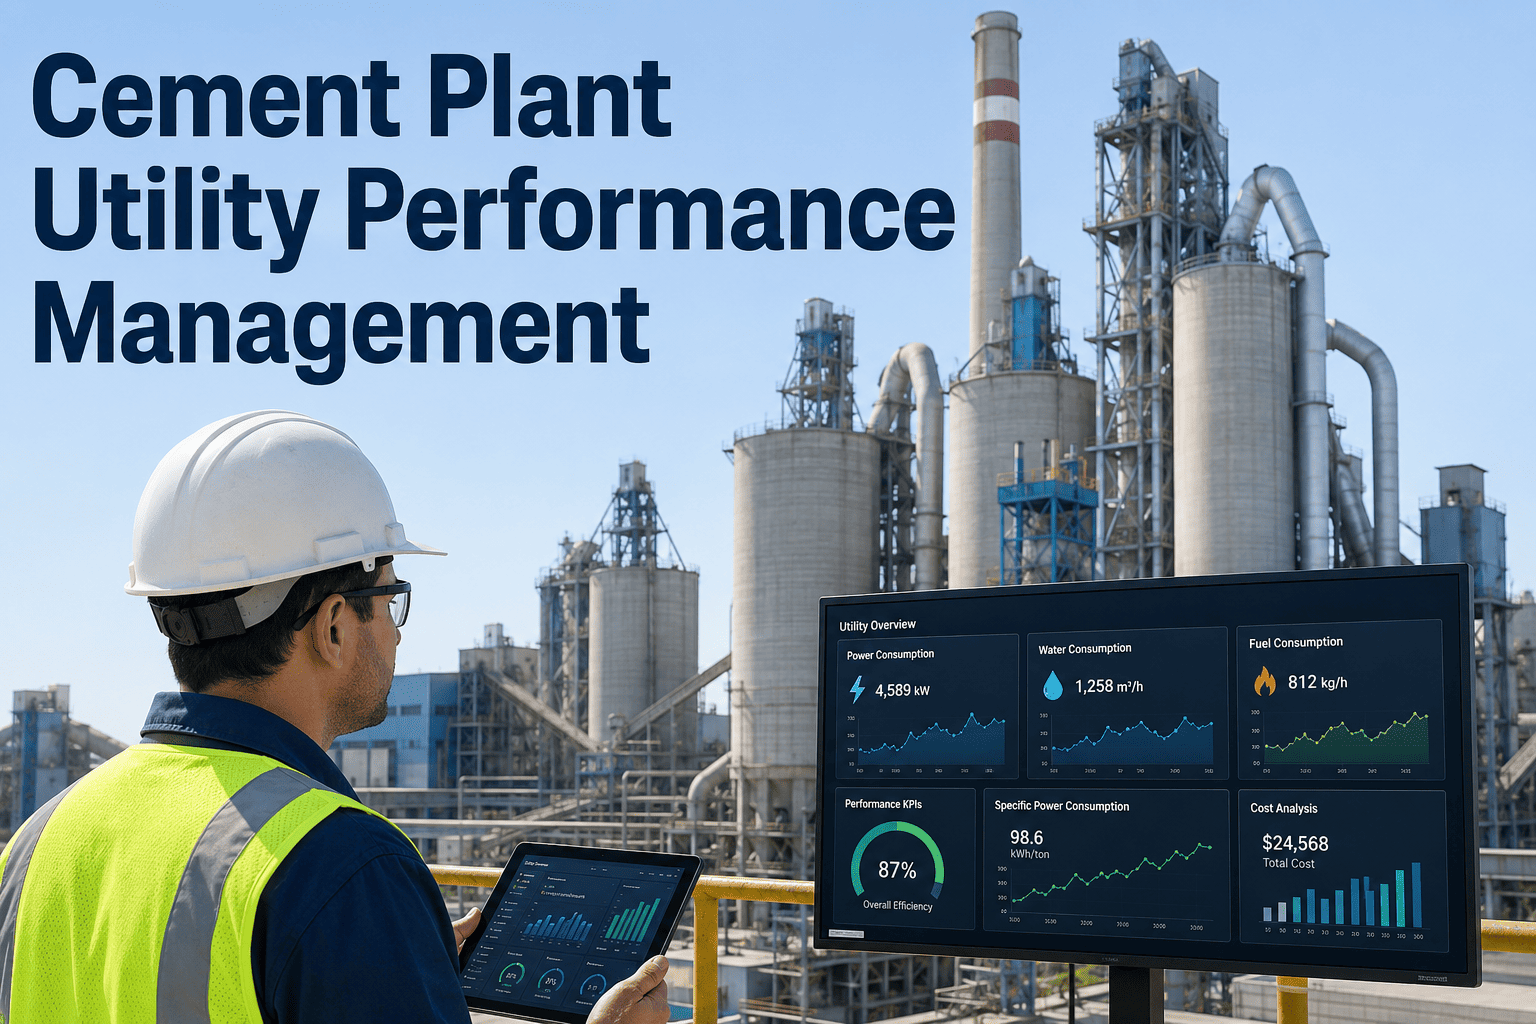
Compressed air, steam, and cooling water rarely get the same scrutiny as kiln fuel or grinding power, yet in most cement plants they quietly account for a meaningful share of the electricity bill — and most of that spend is waste that never shows up as an alarm, a stopped line, or a maintenance ticket. A 30% compressed air leak rate doesn't trip anything; it just shows up as a higher power bill that gets absorbed into the energy cost line with no one able to point to the cause. iFactory's utility performance analytics makes that invisible waste visible, in real time, across every utility system in the plant — see how at Book a Demo.
Your Fourth-Largest Cost Line Is Also Your Least Monitored One
iFactory tracks Water, Air, Gas, Electricity, and Steam — the full WAGES footprint of a cement plant — at sub-minute intervals, correlating utility consumption against production parameters to surface waste while it is still happening, not at the end of the billing cycle.
Five Utility Systems, One Consumption Model
Traditional utility tracking aggregates monthly meter reads into a single line on a cost report, which makes it almost impossible to tell whether last month's spend was normal or wasteful. iFactory instead builds a continuous, sub-minute consumption model across all five WAGES categories and correlates each one against production rate, so a spike in compressed air draw during a period of flat production output is flagged immediately instead of disappearing into an aggregate monthly total.
Each utility system behaves differently — a steam leak signature looks nothing like a compressor hunting pattern, and cooling water fouling develops on an entirely different timescale than a power factor drift. iFactory trains a separate sub-model per utility system, accounting for each one's own load curves, thermal dynamics, pressure relationships, and cost structure, rather than forcing every utility through one generic anomaly detector that treats them all the same.
This matters because a generic anomaly detector tuned for one utility system tends to produce either too many false alarms or too few genuine catches on every other system it is applied to. A threshold sensitive enough to catch a slow steam pressure drop would trigger constantly on the naturally cyclical load pattern of a compressed air header serving an intermittent pneumatic conveying line, and a threshold tuned to tolerate that compressed air cycling would miss the steam leak entirely. Separating the models by utility type is what makes it possible to run tight, high-confidence detection on every system at once instead of settling for a lowest-common-denominator alarm threshold across all five.
The Fourth Utility, And The Least Monitored One
Compressed air ranks behind electricity, fuel, and water in most cement plants' utility hierarchy, and it is consistently the least monitored of the four. A typical 5,000-tonne-per-day cement plant consumes between 2.8 and 4.2 kWh of compressed air energy per tonne of clinker produced, which across a full production year adds up to several million kWh dedicated entirely to compressing air — air that, in facilities without active leak detection, escapes the distribution network at rates of 25 to 40% before ever reaching a pneumatic actuator, instrument, or conveying line.
The reason compressed air stays invisible longer than almost any other utility is structural: a compressor drawing steady current looks completely normal to anyone watching an ammeter, even while a growing share of the air it produces is escaping through a cracked fitting or a worn quick-disconnect somewhere downstream. Electricity metering shows the compressor working exactly as expected. Production metering shows no change, because the leak has nothing to do with output. The only place the loss shows up is the utility bill, and by the time that bill draws attention, the leak has often been running for months, sometimes compounding as additional fittings degrade under the same pressure and vibration that caused the first one.
| System Pressure | Energy Penalty vs. Process Requirement | Typical Cause |
|---|---|---|
| 95 PSI (process requirement) | Baseline — no penalty | Matched to actual pneumatic demand |
| 110 PSI | +7 to 10% | Conservative margin added without re-validation |
| 120 PSI | +12 to 18% | Compressor setpoint never revisited after commissioning |
Every 10 PSI of excess system pressure above the true process requirement adds roughly 5 to 7% to compressor energy cost, and most plants running at 120 PSI have never re-validated whether 95 PSI would satisfy every downstream instrument and actuator. iFactory's leak index tracking and pressure zone analytics identify exactly how much of that margin is genuinely needed and how much is inherited habit.
Pressure margins tend to accumulate for a defensible reason at the time — a new pneumatic actuator gets added to a line, someone bumps the compressor setpoint to be safe, and the plant moves on without ever revisiting whether that margin is still necessary once conditions change again. Multiply that pattern across a decade of incremental additions and a plant can easily end up running 15 to 25 PSI above what current equipment actually needs, with no single decision responsible and no obvious moment to correct it. Continuous pressure zone monitoring gives plants the confidence to walk system pressure back down gradually, watching for any instrument or actuator that genuinely struggles at the lower setpoint before committing to the full reduction.
Find Out How Much Of Your Utility Spend Is Actually Waste.
iFactory's WAGES monitoring benchmarks your compressed air, steam, and power systems against best-practice targets and flags the top savings opportunities in your plant specifically.
The Leaks Nobody Hears Until The Bill Arrives
Steam and cooling water waste follow the same invisible pattern as compressed air: the loss doesn't stop production, doesn't trigger an alarm, and doesn't generate a work order on its own. It just quietly raises the utility cost line every month until someone finally goes looking for the cause, usually well after the loss has been running for weeks or months.
Steam Pressure Drop Signatures
A gradual, unexplained drop in delivered steam pressure at a fixed demand level is one of the earliest and most reliable indicators of a developing leak somewhere in the distribution network, well before the leak is large enough to hear or see.
Cooling Water Flow-Temperature Correlation
Rising return temperatures at a constant flow rate typically point to fouling inside a heat exchanger or condenser, while falling flow at a constant pump speed points toward a partially blocked line or a failing pump seal — two different root causes with two very different fixes.
iFactory continuously correlates these flow and pressure relationships against fixed baselines established for each system, flagging deviations the moment they appear rather than waiting for a scheduled inspection to catch them. This is the same principle behind ultrasonic leak detection surveys, applied continuously instead of once or twice a year — a compressed air network typically loses 15 to 30% of generated air through leaks that a one-time ultrasonic survey would find, and that same leak rate creeps back up within months of any manual repair campaign unless something is watching continuously in between surveys.
Cooling water deserves particular attention because its failure mode is gradual in a way that rarely produces a dramatic symptom until it becomes a process problem. A condenser losing heat transfer efficiency to scale buildup doesn't shut anything down; it simply forces the process to run slightly hotter than intended, which in cement operations can mean a mill running at a more conservative feed rate to compensate for reduced cooling capacity, quietly capping throughput in a way that never gets traced back to the cooling tower. Tracking the flow-versus-return-temperature relationship over months, rather than checking it once during an annual shutdown, catches this decline while it is still a cleaning task rather than a heat exchanger replacement.
Power Factor, Harmonics, And The Motors Running Underloaded
Large motors above 30 kW are worth surveying individually for power factor, harmonics, and operating load fraction, because a motor running well below its rated load is rarely flagged by anyone unless someone is specifically looking for it. A single oversized fan running at 45% load with no variable frequency drive can waste tens of thousands of dollars a year compared to a properly sized, VFD-controlled equivalent, and most plants have more than one fan or pump in exactly this condition.
Demand charges compound this further. Simultaneous mill starts, uncoordinated compressor staging, and overlapping high-load operations create demand peaks that trigger punitive utility charges even when total monthly consumption is unremarkable. iFactory schedules high-load operations to avoid these coincident peaks automatically, shifting non-critical loads to off-peak periods and coordinating startup sequences so the plant's demand profile stays flatter without anyone having to manually stagger equipment starts by hand.
Most demand charge structures bill on a plant's single highest 15-minute or 30-minute peak in the billing period, which means one poorly timed coincidence — a mill restart happening to land in the same window as a compressor staging event — can set the demand charge for the entire month regardless of how efficiently every other hour was managed. Because this single peak drives the charge, avoiding it is often one of the highest-leverage, lowest-effort savings available to a plant, since it requires no change to total production or total energy consumption, only better timing of when specific loads switch on.
Real-Time Signals Versus Trended Signals — Why Both Matter
Not every utility parameter needs the same monitoring frequency, and treating all of them identically wastes both data storage and attention. iFactory splits utility parameters into two tiers based on how quickly the underlying problem develops.
The temptation with any new monitoring platform is to poll everything as fast as possible, on the assumption that more frequent data is always better data. In practice this creates two problems: it generates far more alerts than any control room team can meaningfully act on, and it obscures slow-moving trends inside a flood of minute-to-minute noise that was never meaningful in the first place. Splitting parameters by how fast their underlying failure mode actually develops keeps the real-time tier focused on genuinely urgent signals, while the trended tier is free to run statistical trend analysis over weeks or months without that analysis being drowned out by transient fluctuations that resolve themselves within minutes.
| Monitoring Tier | Update Frequency | What It Catches |
|---|---|---|
| Real-Time | 1-minute or faster | Compressor hunting, sudden pressure drops, demand spikes |
| Trended | Hourly to daily | Gradual leak growth, fouling buildup, seasonal drift |
A compressor that starts cycling on and off rapidly under a load it should handle steadily is a real-time problem that needs a fast alert. A cooling tower gradually losing efficiency over three months of mineral fouling is a trended problem that would be missed entirely by a system only watching for sudden spikes. iFactory runs both tiers simultaneously across every utility system, connecting directly to power meters, flow meters, and utility sub-meters through Modbus-TCP or OPC-UA without disrupting existing plant control systems.
This two-tier approach also shapes how alerts reach the right person. A real-time compressor hunting alert goes straight to the control room shift operator who can respond within minutes, while a trended cooling tower efficiency decline is more useful as a weekly summary reaching the utilities or energy manager who plans maintenance windows rather than reacting to an in-the-moment event. Routing the right signal to the right role, at the right frequency, is as much a part of getting value from utility monitoring as the underlying sensor data itself — a perfectly accurate alert that reaches the wrong person, or reaches the right person too often to act on, delivers no more value than no alert at all.
Our compressed air bill had crept up for two years and nobody could explain why, because nothing about production had changed. iFactory's leak index flagged a night-shift anomaly on one of our compressors within the first month — a massive leak in the baghouse pulse-jet system that had been running for who knows how long during low-demand periods when no one was watching closely. We repaired it during the next scheduled break and the savings were immediate and obvious on the very next bill.
Frequently Asked Questions
Q: Do we need to install new metering hardware across every utility system?
In most plants, a meaningful portion of the required data already exists in power meters, flow meters, and compressor controllers, and iFactory connects to these through standard Modbus-TCP or OPC-UA interfaces without replacing existing metering. Some plants choose to add targeted sensors on utility branches with known blind spots, such as an unmetered compressed air zone or a cooling tower without a dedicated flow meter, but this is scoped to your specific gaps rather than assumed as a blanket requirement. The initial step in any implementation is a short audit of existing sensors, gateways, and connectivity to identify exactly where those gaps are, which means the metering conversation happens before any commitment to new hardware, not as an assumption baked into the proposal. Reach out through Support Contact to review what your current metering already supports.
Q: How quickly can we expect to see savings after implementation?
Compressed air leak sealing and other near-zero capital fixes are typically the fastest wins, often visible on the utility bill within one to two billing cycles once the leak index tracking identifies the specific source. Larger structural changes, such as VFD installation on underloaded motors or heat recovery projects, take longer to plan and implement but are backed by the same continuous consumption data, so the business case is built on measured plant-specific numbers rather than industry averages. Most plants sequence their response by starting with the fastest, lowest-capital fixes the data surfaces first — sealing an identified leak or correcting a compressor setpoint — and use the savings from those quick wins to help justify the larger capital projects that take longer to plan and approve. A Book a Demo session can walk through realistic timelines for your utility mix.
Q: How does this differ from an annual energy audit we already run?
An annual audit, including an ultrasonic leak survey, gives you an accurate snapshot on the day it is performed, but compressed air and steam leak rates begin creeping back up within months of any manual repair campaign, and an audit performed once a year cannot catch that regrowth until the next scheduled visit. iFactory's continuous monitoring watches for the same leak signatures every day rather than once a year, so a new leak gets flagged within weeks of forming instead of sitting undetected until the next audit cycle finds it. The two approaches work well together rather than replacing one another: the annual audit is still useful for a comprehensive physical walk-down and hardware condition check, while continuous monitoring fills the gap in between audits where most of the actual leak growth happens unnoticed.
Q: Can this help us avoid demand charges, not just reduce total consumption?
Yes, and for many plants this is one of the more immediately actionable findings. Demand charges are driven by peak simultaneous load rather than total monthly consumption, and coincident peaks from overlapping mill starts, compressor staging, and other high-load operations are often avoidable through better scheduling alone. iFactory identifies which combinations of equipment starts are creating your demand peaks and can coordinate startup sequencing to flatten the demand profile without changing total production output. Because demand charges are billed on your single worst 15 or 30-minute window each month, this is often one of the fastest paybacks available in the entire utility program, since it addresses a scheduling pattern rather than requiring any new equipment or capital approval at all.
Q: Does utility monitoring interfere with our existing control system or DCS?
No. iFactory's utility monitoring operates as a read-only data layer connected through standard industrial protocols, capturing meter and sensor data without ever writing setpoints or commands back into your DCS, SCADA, or compressor control logic. Your existing control systems and control room interfaces continue operating exactly as they do today, with utility analytics running alongside them as an additional visibility layer. Contact Support Contact for details on integration with your specific control system.
Utility Waste Doesn't Show Up As An Alarm. It Shows Up As A Bill.
iFactory makes compressed air, steam, and power waste visible in real time, before it accumulates into a cost line nobody can explain.