Most cement plants already know their monthly kWh per tonne figure, because it feeds directly into cost reporting and nobody can skip that number. What far fewer plants have is a clear view of where that energy actually goes, mill by mill, shift by shift, before the month-end report gets written. By the time a plant-wide average is reviewed, the specific equipment or shift pattern driving a bad month has usually been forgotten entirely. Energy monitoring software that tracks consumption at the equipment level, not just the plant average, is what turns a monthly number into something a team can actually act on, and if you want to see that level of detail applied to your own plant's energy data, our team can walk you through it.
See Where Energy Actually Goes Across Your Cement Plant
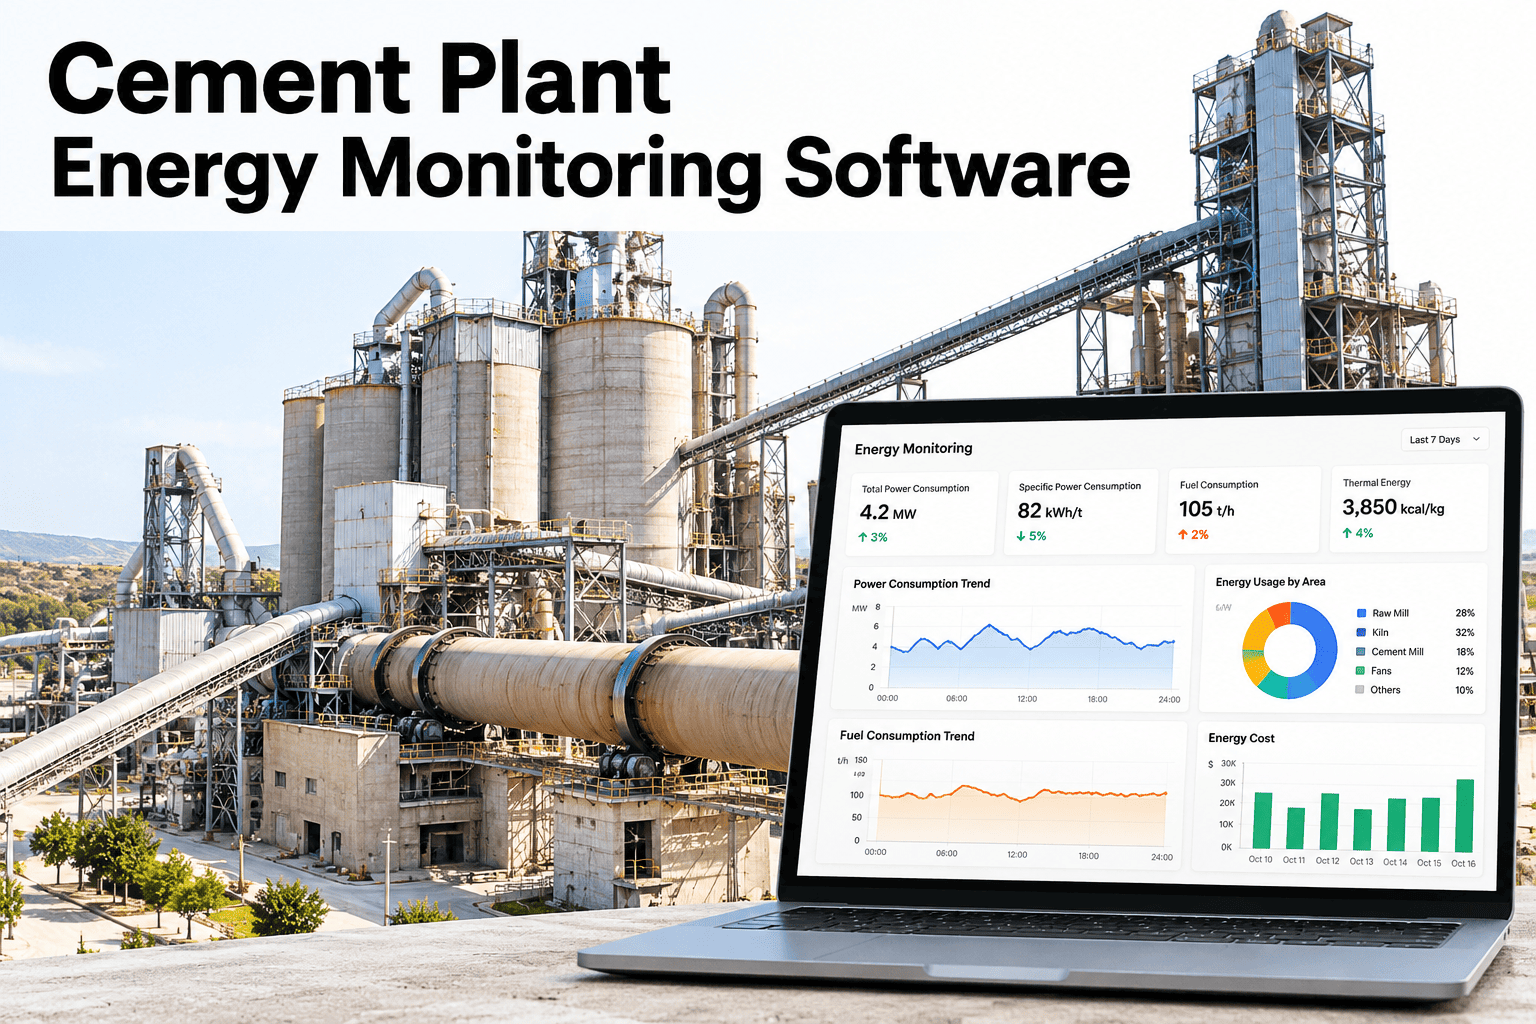
Equipment-level energy monitoring that tracks kWh per tonne by mill, kiln, and shift, with exceptions flagged automatically instead of surfacing only in the monthly report.
The Energy Data Sources Behind a Complete Picture
A trustworthy energy dashboard pulls from several sources at once, since no single meter or system captures the full picture of where energy is actually consumed.
Why kWh per Tonne Only Tells Half the Story Alone
The formula itself is simple, but the figure becomes genuinely useful only once it is calculated at more than one level.
Calculated plant-wide, this figure hides whether a bad month came from the kiln, the raw mill, or an idle period during a slow production run, which is exactly why equipment-level breakdowns matter as much as the headline number.
What Equipment-Level Metering Actually Reveals
Breaking the plant-wide figure down by equipment turns a single average into a list of specific places worth investigating.
| Equipment group | Typical share of plant energy | Common deviation cause |
|---|---|---|
| Raw mill | 20 to 25% | Feed material hardness variation |
| Kiln and preheater | 30 to 35% | Fuel mix and kiln operating temperature |
| Cement mill | 25 to 30% | Grinding fineness setpoint changes |
| Fans and auxiliary motors | 10 to 15% | Idle running during low-output periods |
These shares are general planning references, not a benchmark for your specific plant, which is exactly why ongoing equipment-level tracking matters more than a single industry figure.
See Your Own Equipment Breakdown
Share a recent month of meter data and we will show your plant's own energy split by section and shift.
What Shift Comparisons Add That a Monthly Average Hides
Energy use is rarely uniform across shifts, and the gap between the best and worst shift is often where the easiest savings are found.
A night shift running noticeably higher kWh per tonne than the other two is a common pattern, often tied to startup sequencing or lower output volumes rather than a genuine equipment fault.
How Exceptions and Alerts Keep Issues From Reaching the Monthly Report
Instead of waiting for month-end to notice a bad trend, exception-based alerts flag deviations the same day they happen.
What iFactory Cement and Energy Specialists See Across Plants
iFactory cement and energy specialists who review plant energy data consistently find that kiln and raw mill sections carry the widest variation month to month, largely tied to fuel mix and feed material changes rather than equipment degradation.
Their general guidance is that plants gain the most from equipment-level monitoring once they stop treating the plant-wide kWh per tonne figure as the primary metric and start treating it as a summary of several section-level figures worth tracking individually.
What Energy Managers Ask Before Adopting This Software
Bring Equipment-Level Energy Monitoring to Your Plant
Book a session with iFactory AI to see kWh per tonne broken down by equipment and shift on your own plant data.