At a typical 5,000 tonnes-per-day cement plant, a production manager reviewing yesterday's shift report at 8 AM is looking at numbers that describe what happened 8 to 16 hours ago. The crusher that caused a 45-minute raw mill starvation event at 2 AM. The kiln temperature drift that consumed 12% excess fuel between 4 AM and 6 AM. The separator overload that pushed Blaine fineness out of specification for three hours of the night shift. None of these events were flagged in real time. All of them could have been corrected within minutes if the right data had reached the right person at the right time. Together, they cost the plant an estimated $18,000 in wasted energy, off-specification product, and reduced throughput — in a single night shift. Real-time production monitoring in cement manufacturing is not a dashboard feature. It is the operational infrastructure that transforms a cement plant from a system managed by shift reports into a system managed by live intelligence. This guide covers what genuine real-time monitoring requires for cement operations, how iFactory AI's platform delivers it across every production stage, and what the documented ROI looks like for plants that have made the transition from reactive shift reporting to proactive live intelligence.
Why Traditional Cement Monitoring Fails — and What It Costs
The cement industry's production monitoring problem is not a lack of sensors. Most integrated cement plants have hundreds of sensors already installed — thermocouples in every cyclone stage, pressure transmitters on every duct, flow meters on every fuel line, and vibration sensors on most rotating equipment. The problem is that this data exists in isolated pools: SCADA historian data that only process engineers can query, DCS alarms that operators must manually interpret across 12 different screens, laboratory LIMS results that arrive hours after the sample was collected, and shift logs that record what was done but rarely why it was done or what it cost. The data exists. The intelligence does not.
iFactory's cement production intelligence platform connects every data source — DCS, SCADA historian, PI, lab LIMS, power meters, weighbridges, fuel analyzers, and IoT sensors — into a single, normalized real-time data layer from which unified dashboards, AI analytics, and automated alerts are generated. The result is a single-screen view of your entire cement plant's production state, updated every 60 seconds, accessible on control room displays, management workstations, and mobile devices simultaneously.
The Cost of Monitoring Lag
A typical cement plant loses $200,000 or more per month to production deviations that could be corrected within minutes of onset but instead run for hours before shift-report detection. Energy drifts, throughput constraints, and quality excursions that are invisible in real time become visible only in retrospect — when the opportunity for low-cost correction has passed.
The Shift Report Problem
Over 54% of cement plants worldwide still use a combination of paper logs and spreadsheets as their primary production execution system. Shift supervisors make decisions on gut feel and experience rather than live data. Shift handovers lose institutional memory. Recurring micro-stoppages go uncategorized and uncorrected because no system captures them systematically.
The Data Silo Problem
A cement plant producing kiln data in SCADA, quality data in LIMS, energy data in power meters, and maintenance data in CMMS has four separate operational realities with no mechanism to correlate them. The correlation between a raw mill feed surge and a free lime excursion three hours later requires a human analyst with access to four systems. iFactory makes that correlation automatic, continuous, and available to everyone.
The Mobile Blind Spot
Production managers and plant directors are not always in the control room. When a quality excursion or throughput constraint starts at 3 AM, the person who needs to know immediately — and who has the authority to mobilize resources — is almost certainly not watching a SCADA screen. iFactory delivers real-time production alerts, OEE summaries, and exception reports to mobile devices, ensuring decision-makers are informed regardless of location or shift.
What iFactory Monitors in Real Time: The Complete Cement Production Stack
Genuine real-time production monitoring for a cement plant must cover every production stage from quarry feed to dispatch — not just the kiln or the finish mill. iFactory's platform is pre-configured with 40+ cement-specific KPIs across the complete production chain, with industry-standard benchmarks loaded at deployment so plants can compare their performance against best-achieved targets immediately, without months of custom configuration. The following production stages are monitored continuously, with the specific metrics and AI intelligence applied at each stage.
Live crusher throughput (tph), feed rate stability, crusher motor load and power draw, conveyor belt loading, crusher gap setting vs. target product size, and quarry blast schedule vs. actual delivery. iFactory's AI identifies when crusher throughput is constraining raw mill feed — the most common upstream bottleneck in cement production — and triggers an alert with the specific crusher performance degradation causing the constraint, typically 40 to 80 minutes before raw mill starvation becomes visible to operators.
Raw mill feed rate, mill differential pressure, separator speed and efficiency, 90μm residue (from online or near-line measurement), raw mix LSF and SM from cross-belt or XRF analyzer, mill outlet temperature, specific energy consumption (kWh/t raw meal), and raw meal silo inventory. iFactory's AI detects when mill feed rate is declining relative to silo inventory drawdown — indicating a constraint upstream — and when separator efficiency is degrading, pushing residue above specification and increasing free lime risk in the kiln.
Kiln feed rate (tph), preheater cyclone temperatures at all stages, calciner outlet temperature, burning zone temperature (pyrometer), kiln shell temperatures (full scanner profile), kiln drive torque and speed, O₂ and CO from gas analyzers, NOx as combustion proxy, specific heat consumption (kcal/kg clinker), free lime soft sensor prediction, kiln refractory hotspot status, and preheater blockage detection. iFactory updates all kiln KPIs every 60 seconds and maintains a 24-hour trend view with shift-to-shift comparison. Schedule a kiln monitoring demo.
Cooler grate speed, fan airflow rates and pressures at each fan zone, undergrate pressure distribution, clinker outlet temperature, secondary and tertiary air temperature (heat recovery efficiency), clinker discharge rate, and cooler specific power consumption. iFactory detects "red river" formation — clinker breakthrough between grate plates — through thermal profile analysis before it causes visible heat damage, and tracks cooler heat recovery efficiency against best-achieved benchmark in real time.
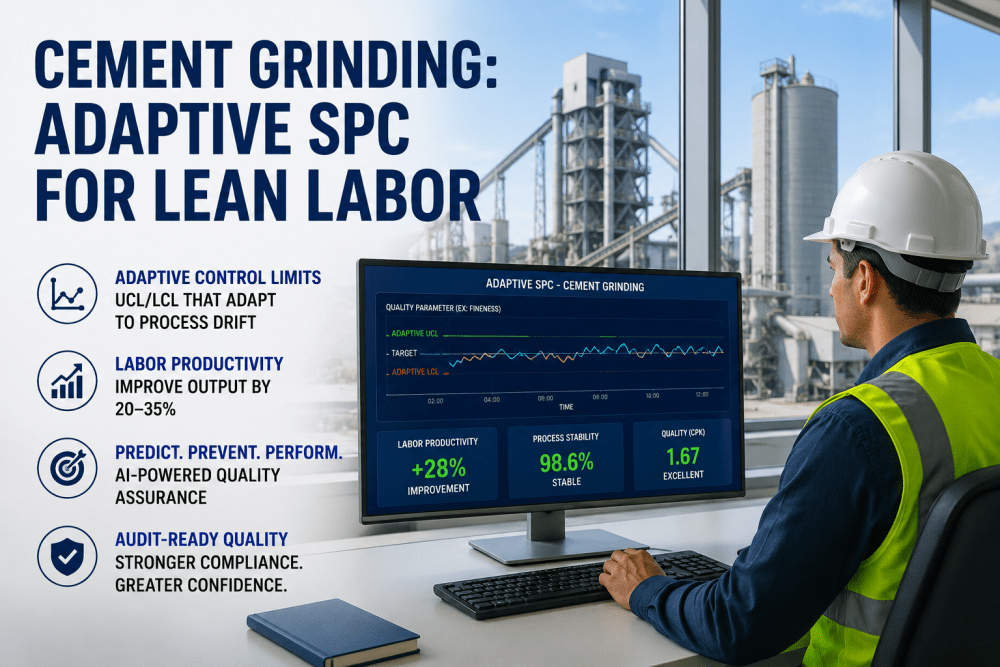
Mill feed rate and clinker factor, separator speed and efficiency, Blaine fineness (from near-line measurement or AI soft sensor), particle size distribution (PSD), cement mill specific energy consumption (kWh/t cement), gypsum and additive dosing rates vs. targets, setting time prediction (C₃A/SO₃ balance), and 1-day to 28-day compressive strength prediction from AI regression model. iFactory detects Blaine drift 30 minutes before lab confirmation using mill acoustic and vibration signatures correlated with separator performance data.
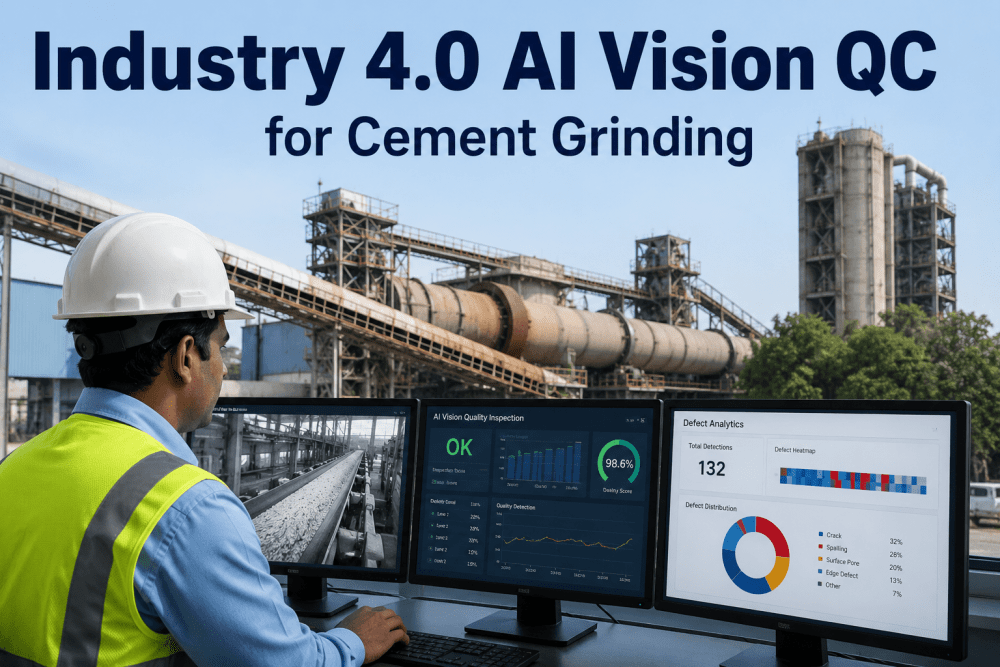
Packer throughput rate, bag weight variance and rejection rate, bulk loading throughput, truck and wagon dispatch schedule compliance, silo inventory levels by grade, and dispatch vs. production plan adherence. iFactory's AI tracks packer performance against certified throughput targets and alerts when bag weight variance exceeds quality thresholds — catching issues that lose 2 to 5% of finished product per shift in poorly monitored plants.
iFactory's OEE Dashboard: Cement-Specific Production Visibility
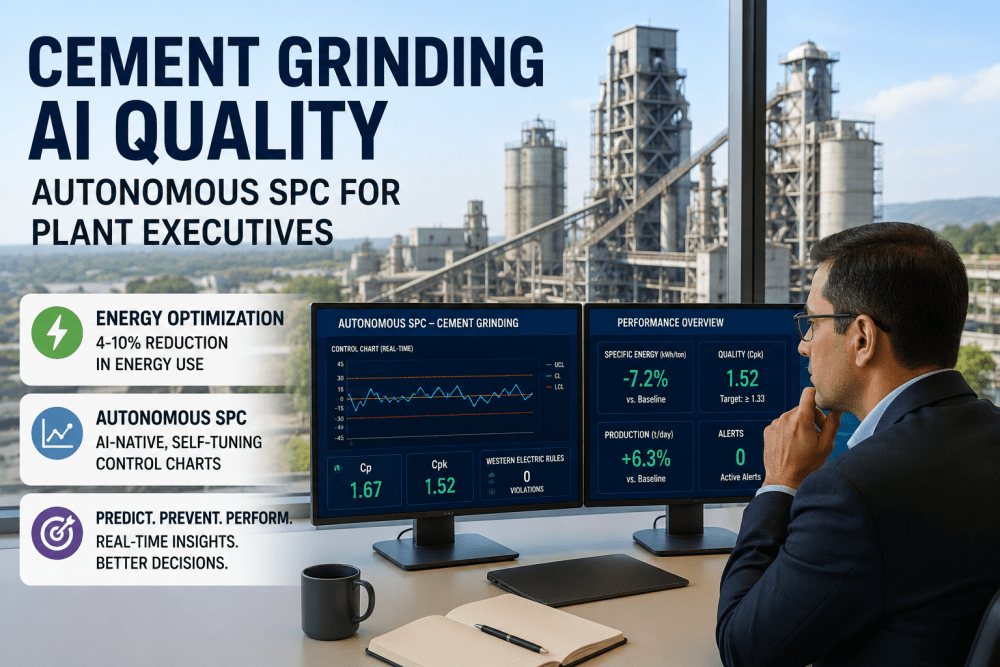
Overall Equipment Effectiveness (OEE) — Availability × Performance × Quality — is the standard metric for manufacturing productivity. In cement, OEE has a specific meaning: it tells you what fraction of your theoretical maximum clinker production capacity was actually delivered as saleable cement, in the correct specification, without waste. World-class cement operations target 85%+ OEE for their kiln system. Most plants operating without real-time monitoring run between 70% and 78% OEE — with the gap representing millions of dollars in unrealized production capacity. iFactory's cement-specific OEE dashboard makes this gap visible, measurable, and correctable — in real time, per asset, per shift.
Unlike generic OEE tools that require months of custom configuration, iFactory's cement OEE dashboard arrives pre-configured with cement-specific definitions of planned vs. unplanned downtime for kilns, raw mills, cement mills, crushers, and packers. Industry benchmark targets — based on world-class performance data across iFactory's 500+ facility deployment base — are loaded at go-live, so plants can immediately see how their current performance compares to best-achieved targets without waiting for a baseline study. Request a live OEE dashboard demonstration for your plant configuration.
IoT Integration: How iFactory Connects to Every Data Source in Your Plant
A real-time monitoring platform is only as good as the data it receives. For cement plants, data exists in a complex, heterogeneous landscape of legacy and modern systems that were never designed to communicate with each other. iFactory's integration layer is designed specifically for this landscape — connecting 50+ data sources without requiring replacement of any existing system, through the industrial communication protocols already native to cement plant environments.
Real-Time Alerts and Escalation: The Notification Architecture
A dashboard that nobody is watching produces no value. In cement plants, where the most critical events — kiln thermal runaway, raw mill starvation, free lime spike, preheater blockage — can develop and escalate in 20 to 40 minutes, the alert system is not a supplementary feature. It is the primary safety net that makes real-time monitoring operationally effective. iFactory's alert architecture is designed around the cement plant's operational reality: multiple shifts, multiple departments, multiple decision-making levels, and events that require different response speeds from different people.
A Customer's Perspective
Before iFactory, I was managing our plant from yesterday's numbers. The morning production meeting was always a post-mortem — what went wrong in the night shift, why didn't we hit our kiln target, what caused the Blaine excursion in the 3 AM sample. With iFactory's real-time dashboard, that meeting changed completely. I can see what is happening right now on every section of the plant, from my phone, before I even arrive at the plant. Night shift supervisors are making better decisions because the AI is telling them exactly what is drifting and what to do about it — not just sounding a SCADA alarm and leaving them to figure out the cause. Our shift-to-shift throughput variance dropped from 12% to under 4% in the first month. That alone recovered $380,000 in annual production that was previously invisible as shift variance.
ROI of Real-Time Production Monitoring: Documented Outcomes
The financial case for real-time cement production monitoring is built on four distinct value streams that compound as the platform matures. iFactory's documented customer outcomes across 500+ facility deployments provide the following benchmark ranges for cement plant implementations specifically.
Frequently Asked Questions: Real-Time Cement Production Monitoring
How quickly can iFactory go live with real-time dashboards in our cement plant?
iFactory's standard cement plant deployment follows a 42-day go-live timeline from contract to live dashboard. This includes: DCS and SCADA connectivity validation and integration (Weeks 1–2), data normalization and KPI configuration (Weeks 2–4), dashboard and alert configuration with plant team input (Weeks 3–5), and go-live training and first-week monitoring support (Weeks 5–6). Plants with well-maintained SCADA historian systems and readily available DCS connectivity credentials typically achieve live dashboards within 30 days. The first meaningful efficiency gains — from operators seeing and responding to deviations in real time — are typically visible within the first week of live operation.
Does iFactory require replacing our existing DCS or SCADA systems?
No. iFactory is designed explicitly as a non-invasive overlay on existing plant infrastructure. The platform connects to your DCS via OPC-UA (the industry-standard read protocol supported by all major DCS vendors) without modifying any DCS logic, control structure, or safety interlocks. Your existing SCADA screens, DCS control stations, and operator workflows remain completely unchanged. iFactory adds a new intelligence layer above the existing control layer — not a replacement for it. The platform works with Siemens PCS7, ABB 800xA, Honeywell Experion, Yokogawa CENTUM, Rockwell PlantPAx, and all other major cement DCS platforms. Most DCS integrations are completed in 1 to 2 weeks.
Can iFactory's dashboards be accessed on mobile devices by plant managers away from site?
Yes. iFactory's production dashboards are fully responsive and accessible via iOS, Android, and web browser on any device with network connectivity. Plant managers and directors can see real-time OEE, throughput, quality KPIs, and active alerts on their mobile devices anywhere in the world. Notification delivery to mobile devices is configurable by role and priority level — a plant director might receive only Priority 1 critical alerts on mobile, while a shift supervisor receives all Priority 1 and 2 alerts in real time. The mobile interface is designed for rapid decision-making on small screens, with the most critical information — current OEE, active alerts, and shift-to-target variance — visible without scrolling.
How does iFactory handle plants with poor sensor coverage or legacy equipment without digital outputs?
For assets without digital connectivity — older crushers without PLC outputs, legacy conveyors with only hardwired limit switches, or areas where SCADA coverage has gaps — iFactory provides two complementary solutions. First, iFactory's retrofit IoT sensor kits (wireless vibration, current, thermal, and proximity sensors) can be installed on virtually any mechanical asset without shutting it down, providing indirect condition monitoring even without PLC connectivity. Second, for manual operations without any automation, iFactory provides operator input tablets where field observations can be entered digitally and integrated with the automated data streams. Both solutions are typically deployed simultaneously to achieve comprehensive coverage across a mixed-vintage cement plant.
What specific cement KPIs does iFactory track out-of-the-box without custom configuration?
iFactory's cement plant deployment package includes 40+ pre-configured cement-specific KPIs including: specific heat consumption (kcal/kg clinker), specific power consumption by subsystem (kWh/t cement), OEE for kiln, raw mill, and cement mill, clinker factor, raw mill 90μm residue, free lime (from lab LIMS and soft sensor), LSF and SM (from online analyzer or lab), Blaine fineness, preheater exit gas temperature per cyclone stage, calciner outlet temperature, burning zone pyrometer temperature, kiln drive torque, clinker cooler outlet temperature and heat recovery efficiency, packer throughput and weight variance, and dispatch rate vs. plan. All KPIs come with industry benchmark targets based on world-class cement plant performance data — no custom configuration required to start comparing your plant against best-achieved benchmarks on day one.
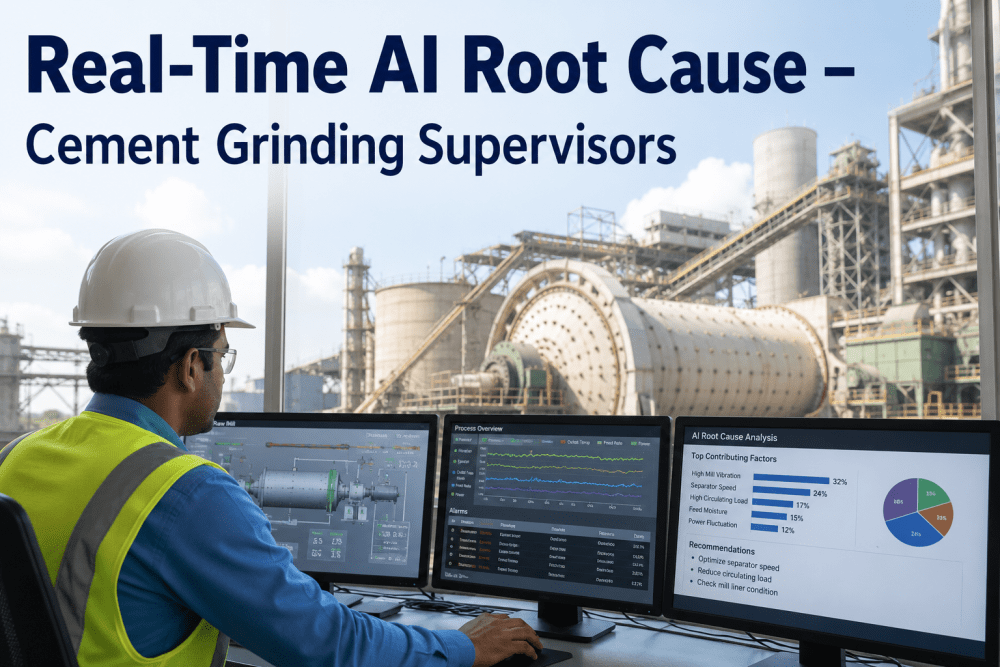
How does iFactory's AI differ from standard SCADA alarm management?
SCADA alarm systems are threshold-based: they trigger when a measured value crosses a pre-set limit. They respond to conditions that have already occurred — often when the condition is already severe enough to have produced real damage. iFactory's AI is pattern-based and predictive: it identifies deviation trajectories before they breach thresholds, correlates multiple process variables to identify the root cause of an emerging deviation, and prioritizes alerts based on their likely production, quality, or safety impact. For example: a SCADA alarm alerts when kiln torque exceeds 120% of rated — which typically indicates a coating ring event that is already constraining production. iFactory's AI alerts when torque is trending upward at an abnormal rate correlating with decreased preheater draft — identifying the early stages of ring formation 2 to 4 hours before the SCADA alarm would fire, when intervention is still low-cost and low-risk. See the difference in a live demo.
Can iFactory generate automated shift reports to replace manual log books?
Yes. iFactory's automated shift report module generates structured digital shift reports at the end of each shift — compiling OEE, throughput, quality KPI summary, energy consumption, alert event log, downtime categories, and corrective actions taken — without requiring any manual input from shift operators. Shift supervisors can add contextual notes through the mobile interface, but the core production data is captured automatically from the integrated data streams. Reports are delivered by email to configured recipients at shift end and are stored in the platform's searchable history. This eliminates the paper logbook entirely, ensures consistent shift reporting quality regardless of which shift is operating, and creates a searchable production event archive that management and process engineers can query for trend analysis and root cause investigation.
Is iFactory's platform secure for cement plant OT networks?
Yes. iFactory's integration architecture follows ISA/IEC 62443 cybersecurity standards for industrial automation systems. DCS and SCADA connectivity is read-only — iFactory extracts data from control systems but cannot write commands or modify setpoints unless explicitly configured for advisory or automatic setpoint mode by the plant. Network segmentation between OT (operational technology) and iFactory's data layer follows NIST Cybersecurity Framework guidelines. For cement plants with proprietary process recipes and production intelligence that cannot leave the facility, iFactory offers a fully on-premise deployment option on NVIDIA-powered edge servers inside the plant's air-gapped network — all AI inference, vision processing, and analytics run locally with sub-10ms latency and zero cloud dependency. Contact our security team for a specific OT network security review.