A 1.5-million-ton-per-year cement plant in Madhya Pradesh was bleeding $4.2 million annually in excess energy costs — and nobody could see it. The data existed. Kiln shell temperatures were logged in the DCS. Power consumption sat in the electrical SCADA. Lab results lived in LIMS spreadsheets. Shift reports were handwritten. But none of it was connected. The plant manager received a 47-page monthly report that was already three weeks stale by the time it landed on his desk. When specific energy consumption drifted 12% above benchmark over six months, no alarm fired — because no system was watching the trend. When they finally deployed AI-powered KPI dashboards, the platform connected DCS, SCADA, lab data, and power metering into a single real-time view. Within 30 days, it identified that raw mill specific power had crept to 19.2 kWh/ton against a 14.5 kWh/ton benchmark — a worn classifier seal was recirculating 40% of already-ground material. A $3,200 seal replacement saved $680,000 in annual electricity costs. That was just the first of 23 inefficiencies the dashboard surfaced in 90 days. Total first-year savings: $3.1 million. Same plant. Same equipment. Same operators. The only thing that changed was visibility.
AI-Powered Cement Plant Intelligence
You Can't Fix What You Can't See.
Start Seeing Everything.
Energy costs account for 30-40% of total cement production expenses. A 10% reduction in energy consumption increases profit margins by 1.5-2 percentage points. Yet most cement plants operate with siloed data, stale reports, and zero real-time visibility into the KPIs that drive profitability. AI-powered dashboards change that — from day one.
30-40%
Of cement production cost is energy
$250K/day
Cost of unplanned kiln downtime
12-23%
Electricity savings potential vs. best practice
68% to 84%
OEE improvement with AI KPI tracking
Sources: ENERGY STAR · OxMaint Cement Analytics 2025 · ScienceDirect 2024 · Industry Benchmarking Data
The KPIs That Make or Break a Cement Plant
Cement manufacturing is a chain of energy-intensive processes — crushing, grinding, pyroprocessing, cooling, and finish grinding — each with its own critical KPIs. The problem isn't that plant managers don't know which KPIs matter. It's that they can't see them in real time, can't correlate them across departments, and can't act fast enough when something drifts. By the time the monthly report arrives, $200,000 in waste has already happened.
Raw Mill SEC
Benchmark: 14-17 kWh/ton
Grinding consumes 30% of total plant electricity. Worn media, classifier inefficiency, or feed moisture spikes push SEC above benchmark within days.
Crusher Availability
Target: >92%
Every hour of crusher downtime starves the raw mill and creates a production bottleneck that cascades through the entire plant for 8-12 hours.
Blaine Fineness
Target: 280-320 m²/kg
Too coarse: incomplete calcination in the kiln. Too fine: excess grinding energy wasted. AI maintains the sweet spot automatically.
Specific Heat Consumption
Benchmark: 700-750 kcal/kg clinker
The single largest energy cost in the entire plant. Every 10 kcal/kg above benchmark burns thousands of dollars per day in excess fuel.
Kiln Utilization Rate
Target: >90%
Running below capacity means massive fixed costs aren't absorbed. Each percentage point below 90% costs approximately $180K-$250K/month.
Cooler Efficiency
Target: >72% heat recovery
Recovered heat preheats combustion air. Poor cooler performance means extra fuel burn to compensate — a hidden cost most plants don't track in real time.
Cement Mill SEC
Benchmark: 28-35 kWh/ton
Finish grinding can consume 40% of total electricity. Ball mill vs. VRM technology creates a 30-40% SEC gap — AI optimizes within your installed technology.
Clinker-to-Cement Ratio
Target: 0.65-0.75
Every 1% reduction in clinker factor saves 1% in thermal energy plus reduces CO2 emissions. AI optimizes additive blending to minimize clinker while maintaining strength.
Packing Efficiency
Target: >96%
Bag breakage, weight variance, and packer downtime waste 2-5% of finished product at poorly monitored plants. Real-time tracking catches deviations per shift.
Why Monthly Reports Are Killing Your Margins
The cement industry's biggest operational problem isn't equipment — it's timing. Most plants rely on monthly performance reports compiled from disconnected systems. By the time data is collected, consolidated, and presented, the window for corrective action has closed. AI-powered dashboards eliminate this gap entirely.
Day 1-30
Problem occurs and persists undetected
Day 30-35
Data collected from SCADA, lab, and logs
Day 35-45
Report compiled and reviewed by management
Day 45-60
Root cause investigated and fix implemented
60 days of waste before correction. At $5,000/day for a single SEC deviation: $300,000 lost.
Minute 0
Deviation detected by AI in real-time data stream
Minute 1-5
Alert pushed to shift supervisor with root cause analysis
Hour 1-4
Corrective action executed on shift
Hour 4+
AI confirms recovery and updates benchmark
4 hours from detection to correction. Cost saved: $299,200 vs. traditional approach.
Your Data Is Already There. The Visibility Isn't.
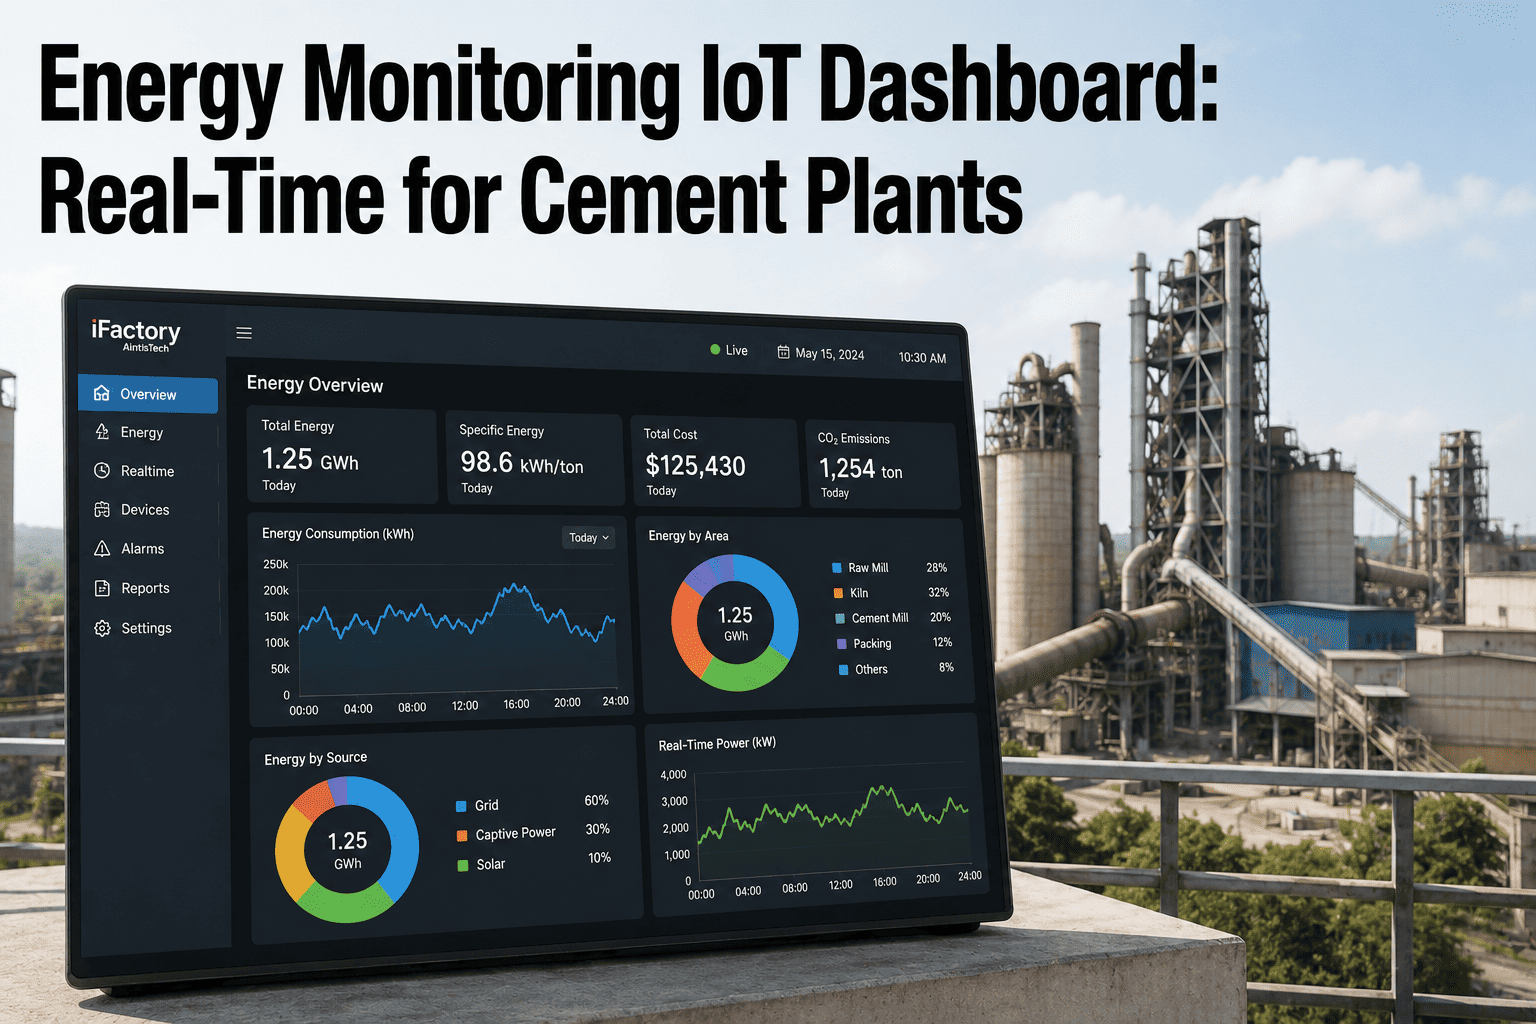
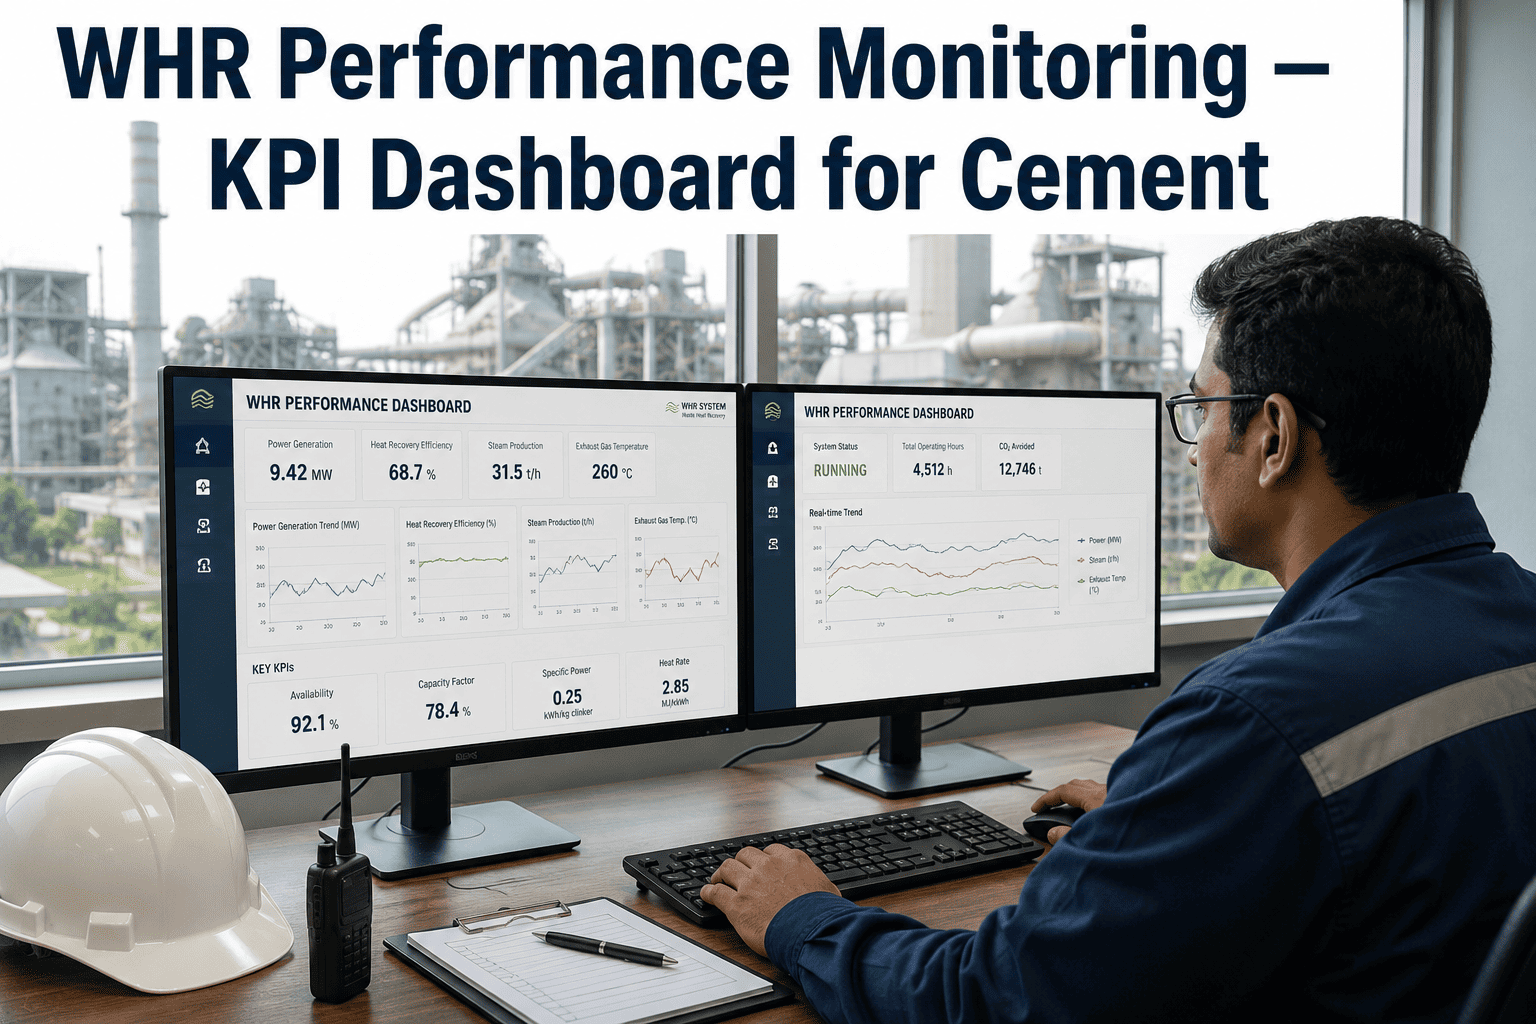
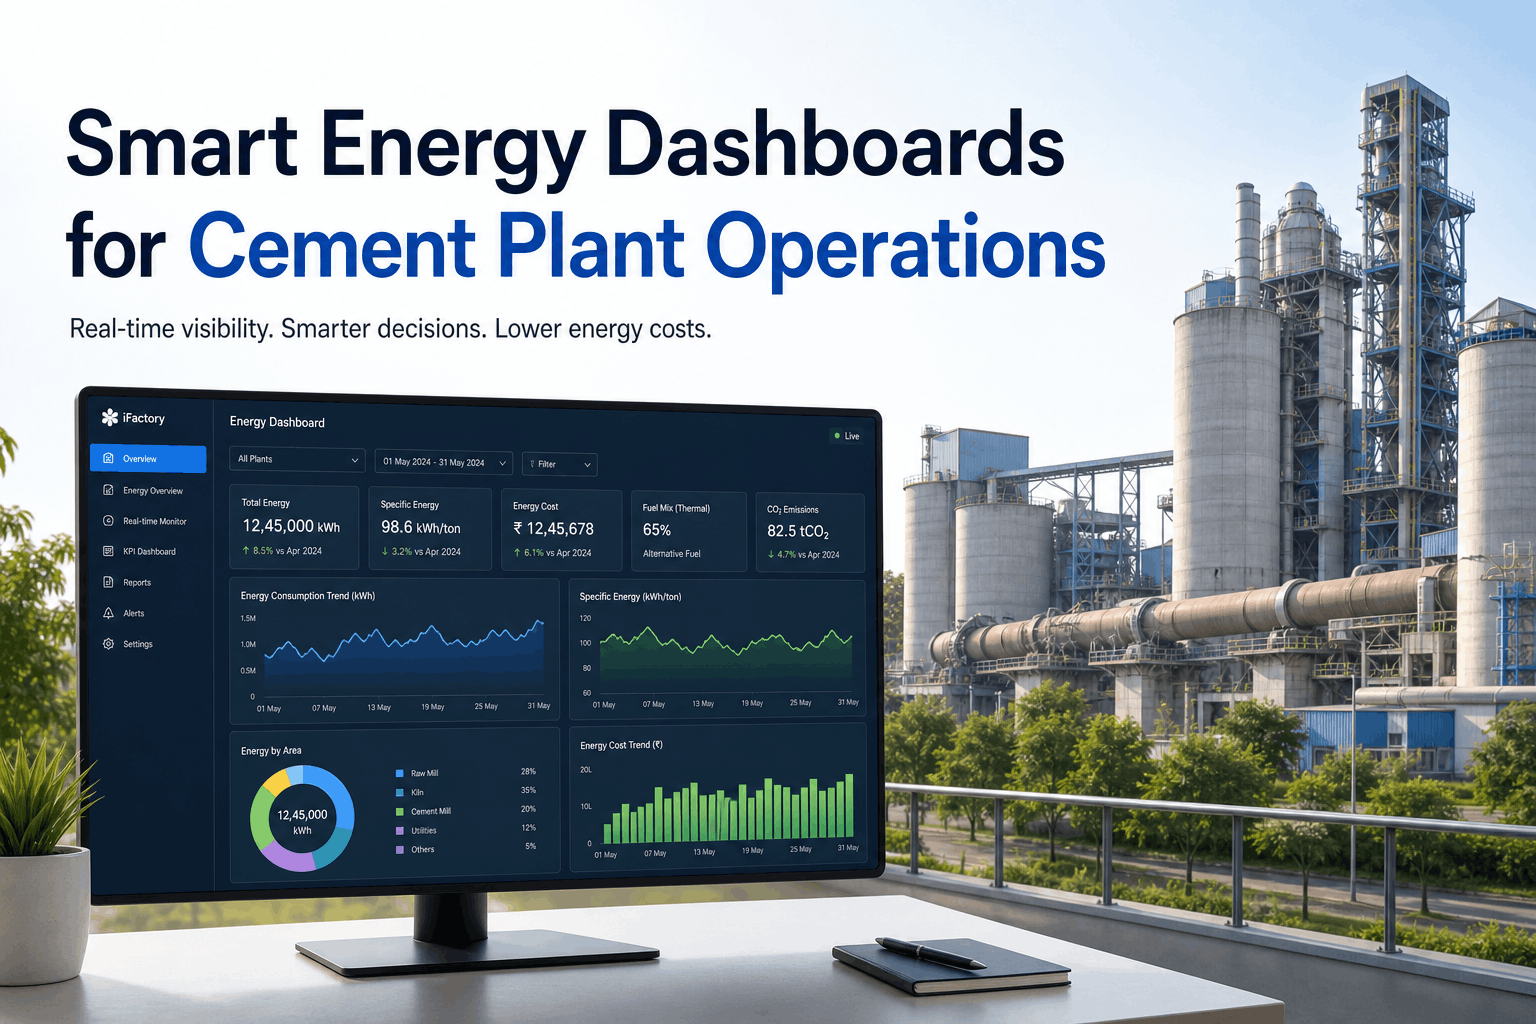
iFactory connects your DCS, SCADA, lab LIMS, and power metering into a single real-time KPI dashboard — purpose-built for cement operations. See every inefficiency the moment it starts. Act before it costs you.
The iFactory Cement Dashboard: What You See
Plant Manager View
Single-screen plant health: OEE, total SEC, production rate, clinker factor, quality compliance, and cost-per-ton — all updated every 60 seconds. Red/amber/green status for every department. Drill down from plant-level to section-level to individual equipment in three clicks.
Energy Manager View
Live kWh/ton and kcal/kg for every subsystem — raw mill, coal mill, kiln, cooler, cement mill — benchmarked against best-achieved and industry targets. Peak demand tracking, power factor monitoring, and load curve optimization with demand-side management recommendations.
Shift Supervisor View
Real-time production targets vs. actuals for the current shift. AI-generated alerts for parameter deviations with recommended corrective actions. Automated shift handover reports — no more handwritten logs. Every decision documented with timestamps.
Maintenance View
Equipment health scores driven by vibration, temperature, current draw, and performance trends. Predictive maintenance alerts 24-72 hours before failure. Auto-generated work orders linked to CMMS when AI detects anomalies. Downtime-to-root-cause analysis in seconds, not days.
Quality Manager View
Live feed from lab LIMS: free lime, LSF, SM, AM ratios, Blaine fineness, and 28-day strength predictions from 1-day results using AI regression models. Quality-to-process correlation maps that show which kiln parameters drive which quality outcomes.
The ROI of Real-Time KPI Visibility
Energy Cost Reduction
$1-4M/yr
8-15% reduction in specific energy consumption through real-time benchmarking and AI-driven optimization. For a 1.5M ton/year plant, reaching domestic best practice saves approximately $1.6M annually in electricity alone.
OEE Improvement
10-16%
Translates to $2-6M in additional annual production value. Plants go from 68% to 84% OEE by eliminating the data gaps that hide availability, performance, and quality losses.
Unplanned Downtime
-50 to 60%
Each unplanned kiln stop costs $50,000-$200,000. AI monitors hundreds of parameters and identifies subtle failure patterns 24-72 hours before breakdown — converting emergency stops to planned interventions.
Clinker Factor Reduction
5-10%
Both a cost saving and an emissions reduction. Every 1% reduction in clinker factor saves approximately 1% in thermal energy. AI optimizes additive blending in real time to minimize clinker while maintaining strength specifications.
Quality Consistency
+40%
Shift-to-shift production variance drops from 12% to under 5% with real-time process monitoring. AI-predicted 28-day strength from 1-day results enables proactive quality corrections instead of reactive rework.
Dashboard Payback
5-8 Months
Most plants recover the full platform cost within the first two quarters. The fastest ROI comes from quick wins — SEC deviations, classifier problems, and cooler efficiency losses that the dashboard surfaces in its first 30 days.
Why iFactory for Cement Plant Analytics
01
Built for Cement, Not Adapted From Generic Software
iFactory's dashboards come pre-configured with cement-specific KPIs — SEC per subsystem, clinker factor, Blaine fineness, kiln thermal efficiency, cooler recovery rate, and 40+ cement industry metrics. Out-of-the-box benchmarks based on industry best practices. No months of custom configuration. Your plant speaks cement. So does iFactory.
02
Connects Every Data Silo in Your Plant
DCS, SCADA, PI Historian, lab LIMS, power meters, weighbridges, fuel analysis — iFactory integrates them all via OPC-UA, Modbus, MQTT, and REST APIs. The platform normalizes data from any vendor into a unified model. No more toggling between 7 screens to understand what's happening in your plant right now.
03
AI That Explains Why, Not Just What
When SEC spikes, iFactory doesn't just show a red number. It correlates the deviation with feed moisture change, classifier recirculation ratio, grinding media wear index, and ambient temperature — and tells you which factor is responsible. Root cause in seconds, not days of investigation. Recommendations with expected impact quantified in dollars.
04
Multi-Plant Benchmarking From One Screen
Operating multiple cement plants? iFactory normalizes KPIs across your entire portfolio — comparing SEC, OEE, clinker factor, and quality metrics at equivalent production rates and raw material conditions. Identify which plants have the most improvement headroom. Replicate best practices with data-backed evidence.
Every Shift Without Real-Time KPIs Is a Shift Flying Blind
iFactory transforms your cement plant from disconnected data silos into a single, AI-powered intelligence platform. See every KPI in real time, catch every deviation the moment it starts, and make every operational decision with perfect information.
Frequently Asked Questions
What specific KPIs does iFactory track for cement plants?
iFactory tracks 40+ cement-specific KPIs out of the box including: specific heat consumption (kcal/kg clinker), specific power consumption per subsystem (kWh/ton), kiln thermal efficiency, cooler heat recovery rate, clinker-to-cement ratio, OEE per section, Blaine fineness, free lime, LSF/SM/AM ratios, crusher and mill availability, packing efficiency, and overall plant SEC. Custom KPIs can be configured for any parameter your plant measures.
How long does it take to deploy the dashboard at our plant?
A typical deployment follows three phases: Phase 1 (Weeks 1-4) connects your DCS, SCADA, and lab systems. Phase 2 (Weeks 5-8) deploys live dashboards with role-based views and alert configuration. Phase 3 (Weeks 9-16) activates AI models for predictive analytics. Most plants see measurable OEE and SEC improvements within the first 60 days of dashboard deployment, with full ROI typically achieved in 5-8 months.
Does iFactory work with our existing DCS and SCADA systems?
Yes. iFactory integrates with all major cement industry DCS and SCADA platforms — FLSmidth ECS, ABB 800xA, Siemens PCS 7, Honeywell Experion, Yokogawa CENTUM, and Schneider Electric. It also connects to PI Historian, OSIsoft, Wonderware, and any OPC-UA or Modbus-enabled system. Your existing control infrastructure remains untouched — iFactory reads data; it never writes to your DCS.
Can we see the dashboard on mobile devices?
Yes. iFactory provides web-based dashboards accessible from any device — desktop, tablet, or smartphone. Plant managers can check real-time KPIs from their phone during site visits or travel. Push notifications for critical alerts are delivered via mobile app, SMS, or email. Role-based access ensures each user sees only the views relevant to their responsibility.
What's the difference between iFactory and our existing historian trending software?
Historian software stores and trends raw sensor data. iFactory transforms that data into actionable intelligence — calculating KPIs in real time, benchmarking against industry targets, correlating parameters across subsystems, detecting anomalies with AI, predicting equipment failures, and delivering specific recommendations with dollar values. It's the difference between having data and having answers.