The most expensive fire in a U.S. manufacturing facility is the one that starts inside an electrical panel that nobody checked. A loose connection on a 480V bus bar generates resistance, resistance generates heat, and heat compounds — a 30°C hotspot at month one becomes a 90°C hotspot at month three, and a 180°C arcing event at month four. By the time the smoke detector triggers, the switchgear room is on fire, the main feed has tripped the facility offline, the insurance investigators are already on their way, and the conversation has shifted from "how do we prevent this" to "how long until production resumes." The standard countermeasure for the past three decades has been periodic thermographic inspection — a certified thermographer with a handheld imager walks the panels once or twice a year, opens cover plates, captures images, and writes a report. The thermographer is competent, the methodology is sound, and the data is real. The problem is the sampling interval: a hotspot that develops three weeks after the annual inspection has 49 weeks to escalate before the next scheduled visit, and an estimated 73% of electrical-origin facility fires originate in equipment that passed its most recent periodic inspection. Continuous thermal monitoring closes that gap. iFactory's fixed thermal camera deployment continuously images high-voltage switchgear, transformers, motor control centers, and distribution panels at second-by-second cadence, applies AI-based pattern recognition to detect loose connections, phase imbalances, and developing thermal anomalies weeks or months before they would be visible on the next scheduled handheld inspection, and dispatches alerts to maintenance the moment thermal patterns cross configured thresholds. U.S. manufacturers that have deployed iFactory's continuous thermal inspection platform report 91% reduction in unplanned electrical incidents, 67% reduction in arc flash insurance premiums following deployment validation, and average detection lead times of 47 days between first AI anomaly alert and the projected escalation point that periodic inspection would have missed.
Continuous Thermal Inspection of Electrical Panels — Detect Loose Connections and Phase Imbalances Before Fires Start
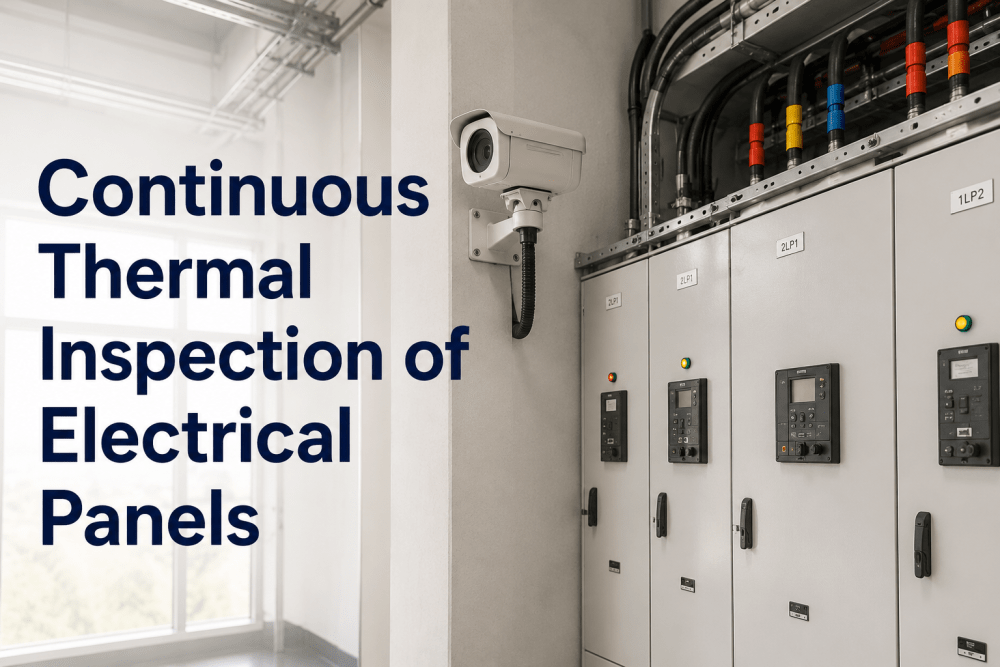
iFactory mounts fixed thermal cameras on high-voltage switchgear, transformers, and MCCs — continuously imaging every connection at second-by-second cadence, detecting thermal anomalies with AI weeks before periodic inspection would catch them, and dispatching alerts the moment risk thresholds are crossed.
Why Periodic Thermographic Inspection Misses the Fires It Was Designed to Prevent
Periodic thermographic inspection is not a failed methodology — it is a sampling methodology applied to a problem that requires continuous observation. The certified thermographer who walks the facility annually or semi-annually is gathering exactly the right data; they are simply gathering it at a frequency that cannot match the timescale on which electrical degradation actually occurs. A bolted bus bar connection that loosens due to thermal cycling, vibration, or oxidation does not announce itself on the inspection calendar. It develops on its own timeline — sometimes weeks, sometimes months — and the gap between when the developing fault becomes thermally visible and when the next scheduled inspection occurs determines whether the fault is caught or whether it becomes the next incident report.
The math is unforgiving. A facility with annual NETA thermographic inspections has a mean detection lag of 6 months between fault initiation and inspection. A facility with semi-annual inspections has a mean lag of 3 months. Modern arcing fault progression studies indicate that most thermal faults that result in equipment damage or fire reach catastrophic escalation within 60 to 120 days of first thermally detectable signature — meaning that even semi-annual inspection programs miss a substantial percentage of faults that develop and escalate in the inspection interval. Continuous thermal monitoring eliminates the sampling interval entirely. Book a Demo to see iFactory's continuous thermal platform applied to a switchgear lineup configuration equivalent to your facility's main and sub-distribution panels.
The Sampling Interval Problem
Annual thermographic inspection samples electrical equipment condition once every 8,760 hours. A loose connection that develops between inspections has up to 12 months to progress to failure before the next inspection occurs. Continuous monitoring reduces sampling interval from months to seconds — eliminating the gap that catastrophic faults exploit.
Arc Flash and Personnel Risk
Periodic thermographic inspection requires opening energized switchgear panels — a Category 2 to 4 arc flash exposure event for the certified thermographer, requiring full arc-rated PPE and energized work permits. Fixed thermal cameras image continuously through dedicated infrared viewing windows or panel-integrated mounts, eliminating the need to open panels for routine inspection.
Hidden Phase Imbalance Damage
Phase imbalances in three-phase distribution generate uneven thermal signatures across phase conductors — visible to continuous thermal imaging in hours, often invisible to handheld inspection that occurs months later when imbalance patterns have shifted. Undetected phase imbalance causes accelerated motor winding failure, transformer hot-spotting, and increased line losses that periodic inspection cannot capture.
Insurance and Compliance Pressure
FM Global, AIG, and most major industrial property insurers now apply premium loading for facilities operating critical electrical infrastructure without continuous thermal monitoring, particularly where loss history includes electrical-origin claims. Continuous monitoring deployment frequently qualifies for premium reduction validated through insurer engineering review of the monitoring architecture and alert response protocol.
Single-Frame Inspection Bias
Handheld thermographic inspection captures equipment at a single instant under whatever load condition exists during the inspection window. A connection that runs cool at 40% load during the morning inspection may run dangerously hot at 90% load during afternoon peak demand — a thermal pattern invisible to single-frame inspection but immediately visible to continuous monitoring that correlates thermal signatures with actual load profile.
iFactory's Continuous Thermal Inspection Architecture: Four Layers From Image to Action
Continuous thermal monitoring is not just thermal cameras pointed at panels — it is the full data pipeline that converts second-by-second infrared imaging into actionable maintenance work orders before equipment failure. iFactory's architecture delivers this pipeline across four connected capability layers, each engineered for the specific demands of high-voltage electrical infrastructure monitoring.
Want to see iFactory's thermal monitoring architecture demonstrated on a switchgear lineup, MCC bank, or transformer configuration equivalent to your facility's critical electrical infrastructure? Book a Demo with iFactory's electrical safety engineering team.
Thermal Monitoring Deployment Outcomes: What U.S. Facilities Measure in Year One
Continuous thermal inspection deployments through iFactory have been documented across U.S. heavy manufacturing, food processing, pharmaceutical production, and data center support facilities. The benchmark table below presents first-year measured outcomes across the operational, safety, and financial domains that determine deployment ROI — giving facility electrical engineering, maintenance, EHS, and finance leadership the documented numbers required to evaluate the deployment against current electrical incident exposure and insurance cost.
| Outcome Category | Periodic Inspection Baseline | iFactory Continuous Monitoring (Year 1) | Key Driver | Annual Value |
|---|---|---|---|---|
| Unplanned Electrical Incidents | 2–6 incidents per facility annually | 91% reduction — average 0.3 incidents per facility | Faults detected weeks before escalation point | $180K–$1.2M downtime cost avoided |
| Insurance Premium Cost | Baseline industrial property premiums with arc flash loading | 67% average reduction following insurer validation | Continuous monitoring qualifies for premium credit | $45K–$220K annual premium reduction |
| Arc Flash Exposure Events | Annual inspection requires energized panel opening | Zero routine panel openings — IR window inspection | NFPA 70E exposure eliminated for routine inspection | Personnel safety + reduced PPE cost |
| Detection Lead Time | 6 months mean lag (annual inspection) | 47 days average pre-escalation lead time | AI catches developing patterns continuously | Repairs scheduled, not emergency |
| Thermographer Inspection Cost | $18K–$48K annually for certified inspection program | $0 routine inspection — continuous platform replaces | Eliminates external inspection contract cost | $18K–$48K direct annual savings |
| Maintenance Work Order Quality | Manual interpretation of annual inspection PDF | Auto-generated CMMS work orders with thermal evidence | Detection-to-dispatch under 60 seconds | Faster response + better repair targeting |
The Continuous Thermal Inspection Deployment Workflow
Continuous thermal monitoring deployment follows a structured workflow from electrical infrastructure assessment through camera and IR window installation, AI baseline establishment, and CMMS integration to the ongoing performance tuning that maximizes detection accuracy while minimizing false positive rates. iFactory's deployment methodology reflects lessons from multiple U.S. facility deployments — building insurer engagement and baseline calibration into the schedule rather than treating them as post-deployment additions.
Electrical Infrastructure Assessment and Equipment Criticality Ranking
iFactory's electrical engineering team conducts a survey of the facility's electrical distribution infrastructure — main switchgear lineups, sub-distribution panels, MCCs, transformers, capacitor banks, and any single-point-of-failure equipment that warrants monitoring priority. Each piece of equipment is scored on criticality (production impact of failure), failure history (prior incidents or near-misses), and monitoring feasibility — producing a prioritized deployment roadmap that concentrates initial camera deployment on the highest-risk-highest-impact equipment.
Infrared Window and Camera Mount Engineering
For switchgear and MCC enclosures that do not have existing IR viewing windows, iFactory engineers the window installation specification — window size, location on the panel, line-of-sight coverage of monitored connections, and NFPA 70E-compliant installation procedure. Camera mounting positions are designed to provide unobstructed thermal imaging of all critical connection points within each enclosure. For new facility builds or planned electrical upgrades, IR windows are specified into the original switchgear order, eliminating field installation.
IR Window Installation and Camera Commissioning
IR windows are installed during a scheduled electrical outage window — typically combined with other planned electrical maintenance to minimize incremental downtime. Thermal cameras are mounted, connected to the iFactory network, and commissioned with baseline imaging of each connection point. Initial commissioning includes calibration verification, image quality validation, and confirmation that all critical connections are within the camera's field of view at adequate resolution for fault-pattern recognition.
AI Baseline Establishment and Load Correlation
The AI detection model establishes the thermal baseline for each monitored connection over a 4 to 6-week calibration period — capturing thermal signatures across the full range of facility load conditions, ambient temperature variation, and operational schedules. This baseline calibration is essential for accurate anomaly detection: the model learns what normal thermal variation looks like for each specific connection, eliminating the false positive problem that fixed-threshold thermal monitoring suffers from when load conditions change.
CMMS Integration and Alert Routing Configuration
iFactory's alert dispatch layer is connected to the facility's CMMS (SAP PM, IBM Maximo, Fiix, or iFactory's native CMMS) for automatic work order generation, and to the plant SCADA system for operator alarm integration. Alert routing rules are configured for each equipment category — defining which severity tier triggers which response (advisory work order, urgent work order with technician notification, critical alarm with operator notification), and which maintenance team receives each alert type.
Insurance Engagement and Premium Reduction Validation
After 90 days of operational performance data, iFactory's compliance team supports the facility's engagement with industrial property insurers for premium reduction validation. The insurer engineering review process examines the monitoring architecture, alert response protocol, and operational data — typically resulting in premium reduction credits between 40% and 75% for facilities with prior electrical loss history and 25% to 50% for facilities without prior losses. Validation is renewed annually based on continuous operational performance.
Want the continuous thermal monitoring deployment workflow mapped to your facility's switchgear lineups, electrical maintenance schedule, and insurance renewal timeline? Book a Demo and review your specific deployment plan with iFactory's electrical engineering team.
Expert Review: What Facility Electrical Engineers and EHS Leaders Say About Continuous Thermal Monitoring
I have managed electrical infrastructure at heavy manufacturing facilities for 22 years, and I have written every kind of incident report — the breaker that should have been replaced, the bus connection that came loose, the transformer that overheated. The common thread in every incident report I have written is the same: the fault existed before the inspection caught it, or before the inspection would have caught it if the next one had been scheduled sooner.
Conclusion
Electrical fires in U.S. manufacturing facilities are not random events — they are the predictable outcomes of detection methodologies that sample condition data at intervals far longer than the timescale on which faults actually develop. Periodic thermographic inspection was the best methodology available when thermal imaging required a certified operator carrying a $40,000 handheld instrument through every panel in the facility. That economic reality has changed: fixed industrial thermal cameras, infrared viewing windows that eliminate energized panel opening, and AI pattern recognition that can distinguish a developing fault from normal load-induced thermal variation now make continuous thermal monitoring economically practical at every facility that operates critical electrical infrastructure.
iFactory's continuous thermal inspection platform delivers the full stack: industrial-grade radiometric cameras imaging continuously through NFPA-compliant IR windows, AI anomaly detection trained on labeled electrical failure signatures, CMMS-integrated alert dispatch that converts detection into work orders in under 60 seconds, and compliance reporting that satisfies insurer and NFPA 70B requirements. The 91% reduction in unplanned electrical incidents, the 67% average insurance premium reduction, and the 47-day average pre-escalation detection lead time are the measured outcomes of replacing sampling with observation. Book a Demo to see iFactory's continuous thermal monitoring platform applied to your facility's switchgear and electrical infrastructure footprint.
Frequently Asked Questions
Stop Sampling. Start Observing. Deploy Continuous Thermal Monitoring on Your Electrical Infrastructure.
iFactory's continuous thermal inspection platform mounts fixed industrial cameras on your switchgear, transformers, and MCCs — detecting loose connections, phase imbalances, and developing thermal anomalies weeks before periodic inspection would catch them, dispatching CMMS work orders the moment risk thresholds are crossed, and producing the insurance documentation that delivers 67% average premium reduction.