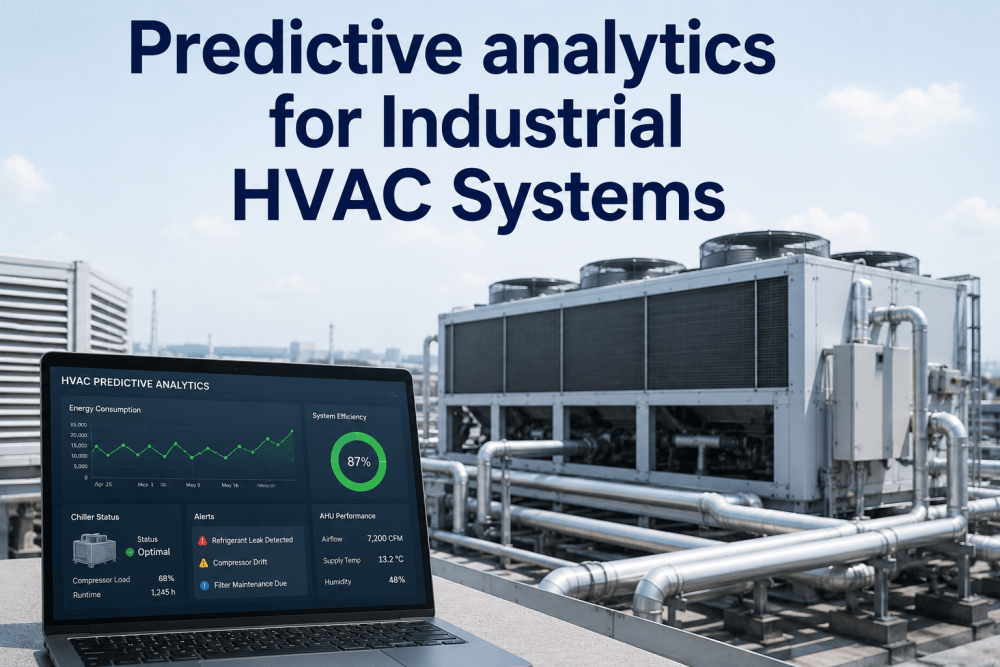
Industrial HVAC systems in U.S. manufacturing facilities operate at a scale and continuity that no commercial building HVAC encounters — multi-megawatt chiller plants running 8,760 hours per year, air handling units conditioning controlled-environment manufacturing spaces to ±0.5°C tolerances, and refrigeration loops carrying tens of thousands of pounds of refrigerant through equipment installed two or three decades ago. The energy cost of running this infrastructure is typically 18 to 32% of total facility utility spend, the temperature stability of this infrastructure determines whether pharmaceutical batches pass release testing and whether semiconductor fab tools hold dimensional spec, and the failure mode of this infrastructure is rarely a sudden breakdown — it is a slow drift. A chiller compressor that should consume 0.58 kW per ton of cooling starts drifting upward to 0.64, then 0.71, then 0.83 — burning an extra $40,000 to $180,000 in annual electricity while still appearing to function normally to the BMS. A refrigerant charge that should hold for five years between top-ups starts leaking at 8 ounces per week — invisible to operators until the chiller short-cycles on a hot day and the facility temperature setpoint can no longer be maintained. An AHU fan motor running with developing bearing wear pulls 12% more current than the baseline — invisible to the maintenance team because nothing has alarmed, and only visible to predictive analytics that knows what the baseline was supposed to be. iFactory's industrial HVAC predictive analytics platform makes these drift signatures visible at the speed they actually develop. By baselining chiller, AHU, and refrigeration system energy consumption against load conditions, ambient temperature, and seasonal patterns, then continuously comparing live operation against the calibrated baseline, the platform detects refrigerant leaks, compressor inefficiency drift, AHU coil fouling, and motor bearing wear weeks or months before they trigger a BMS alarm or compromise facility temperature control. U.S. manufacturers that have deployed iFactory's HVAC analytics platform report 19% reduction in annual HVAC energy consumption, 73% earlier detection of refrigerant leaks compared to BMS-only monitoring, and 84% reduction in facility-temperature-related production deviations across pharmaceutical, semiconductor, food processing, and controlled-environment manufacturing operations.
19%
Average reduction in annual HVAC energy consumption from baseline drift detection and optimization
73%
Earlier refrigerant leak detection vs BMS-only monitoring — average 47 days lead time before alarm
84%
Reduction in facility-temperature-related production deviations in controlled-environment manufacturing
8,760 hr
Continuous monitoring coverage — every hour of HVAC operation analyzed against calibrated baseline
Why BMS Alarms Miss the Drift That Costs Real Money in Industrial HVAC
The Building Management System running your industrial HVAC is doing exactly what it was designed to do — monitoring discrete sensor values against fixed alarm thresholds and notifying operators when a value crosses a setpoint. The problem is that the value-crossing-a-threshold model of monitoring is fundamentally mismatched with how industrial HVAC systems actually degrade. A chiller does not announce its declining efficiency by tripping a high-discharge-pressure alarm; it simply consumes 14% more electricity to deliver the same cooling capacity, with every individual sensor reading remaining inside its alarm band. A 50-ton AHU with a fouling cooling coil does not generate a BMS alarm; it just requires the chilled water valve to open further and the supply fan to push harder, consuming more energy while still maintaining setpoint — until the day the fouling is severe enough that setpoint can no longer be held during peak load and a production deviation occurs.
Refrigerant leak detection is the most expensive example of this mismatch. A typical BMS triggers a refrigerant alarm when low-side pressure drops below a fixed threshold — which, on a properly sized system, only happens after the leak has progressed to the point where the chiller can no longer maintain stable operation. By that point, the leak has been ongoing for weeks or months, hundreds of pounds of refrigerant have already been released to atmosphere (a significant EPA compliance issue under the AIM Act for HFC refrigerants), and the production temperature stability that depends on the chiller has already been compromised. iFactory's predictive analytics detects the same leak from the energy consumption signature 6 to 10 weeks earlier — when the refrigerant charge deficit first begins reducing system efficiency, long before pressure drops below alarm threshold. Book a Demo to see iFactory's HVAC analytics platform applied to a chiller plant and AHU configuration equivalent to your facility.
Chiller Efficiency Drift That No Alarm Catches
A chiller's kW-per-ton efficiency degrades gradually from compressor wear, fouling, refrigerant charge variance, and condenser water quality issues — typically 8 to 22% drift between annual service intervals. None of this drift crosses a fixed BMS threshold; it accumulates silently as electricity overconsumption, often costing $40,000 to $180,000 annually per large chiller before the next planned service captures it.
Refrigerant Leaks Visible in Energy Before Pressure
A refrigerant leak shows up in chiller energy consumption 6 to 10 weeks before low-pressure switches trigger an alarm — the reduced charge forces the compressor to work harder per ton of cooling, and the efficiency signature changes long before pressure drops to alarm threshold. EPA AIM Act enforcement makes early detection both a compliance and financial priority.
AHU Coil Fouling and Filter Loading Energy Cost
An AHU cooling coil with biological fouling, or a filter bank approaching dirty differential pressure, increases fan energy and chilled water flow demand by 6 to 14% without triggering any alarm — the system still maintains setpoint by working harder. Predictive analytics detects the energy signature change and dispatches cleaning before the AHU loses setpoint capability under peak load conditions.
Setpoint Tolerance Risk in Controlled-Environment Manufacturing
Pharmaceutical cleanrooms, semiconductor fabs, food cold storage, and battery manufacturing operations require facility temperature held within tight tolerance windows — typically ±0.5°C to ±2°C. Production deviations from temperature excursions cost $14,000 to $280,000 per event in batch quality holds, regulatory documentation, and re-qualification work. Predictive HVAC analytics keeps the system inside tolerance by detecting degradation before it compromises setpoint capability.
The iFactory HVAC Predictive Analytics Architecture: Six Capabilities That Convert HVAC Data Into Action
iFactory's HVAC analytics platform integrates with existing BMS, BACnet, Modbus, and OPC-UA data sources to ingest the full operational telemetry from chillers, AHUs, cooling towers, pumps, and refrigeration systems — then applies physics-informed machine learning models that understand the thermodynamic relationships between load, ambient conditions, and equipment performance to identify drift signatures that fixed-threshold monitoring cannot detect. Book a Demo to see the platform connected to data streams from your specific BMS and HVAC equipment configuration.
Cap 01
Energy Consumption Baselining and Load Normalization
iFactory establishes a calibrated energy baseline for each chiller, AHU, cooling tower, and major pump over a 6 to 12-week initial monitoring period — capturing the relationship between equipment energy consumption, cooling load delivered, ambient conditions, and seasonal patterns. Live operation is continuously compared against this load-normalized baseline, so drift detection accounts for normal variation in load and weather rather than triggering false alarms when conditions change.
Per-equipment efficiency baselines
Load-normalized comparisons
Seasonal pattern recognition
Cap 02
Refrigerant Leak Detection via Efficiency Signature
The platform detects refrigerant leaks through the efficiency signature they create — declining COP, increased compressor work per ton of cooling, and shifting superheat patterns — typically 6 to 10 weeks before low-pressure thresholds would trigger a BMS alarm. Early detection supports EPA AIM Act compliance for HFC refrigerant management, prevents the production deviations that develop when charge deficits compromise temperature stability, and avoids the emergency refrigerant top-up cost premium.
Efficiency-based leak detection
EPA AIM Act documentation
Charge deficit early warning
Cap 03
Compressor Drift and Mechanical Wear Detection
Compressor degradation — bearing wear, valve seat erosion, internal leakage, or motor winding deterioration — generates distinctive energy and vibration signatures detectable in BMS telemetry before mechanical failure occurs. iFactory's models identify these signatures against equipment-specific baselines and project remaining useful life, enabling planned compressor service or replacement before the chiller fails on a peak-load day.
Compressor health trending
Remaining useful life projection
Mechanical wear early warning
Cap 04
AHU Coil Fouling and Filter Loading Analytics
Air handling unit performance degradation from coil fouling, filter loading, or damper drift shows up as increased fan power, increased chilled water flow demand, or shifted supply temperature differentials — all detectable from BMS telemetry against the AHU's load-normalized baseline. The platform dispatches predictive cleaning and filter change work orders based on actual performance degradation rather than calendar-based schedules, optimizing both energy consumption and labor cost.
Coil fouling detection
Filter loading prediction
Performance-based service dispatch
Cap 05
Cooling Tower and Condenser Water System Optimization
Cooling tower fan staging, condenser water temperature setpoint, and water treatment effectiveness all impact chiller plant efficiency in ways that fixed BMS control logic cannot optimize dynamically. iFactory's analytics identifies the optimal condenser water temperature for current ambient and load conditions, detects scale and biological fouling on condenser tubes through the heat transfer signature, and produces the optimization recommendations that typically capture an additional 4 to 9% chiller plant efficiency improvement.
Dynamic CWS optimization
Condenser fouling detection
Tower fan staging analytics
Cap 06
CMMS Integration and Predictive Work Order Dispatch
Every drift signature detected by the analytics platform — refrigerant leak, compressor wear, coil fouling, motor bearing development — generates a CMMS work order automatically, with the specific equipment ID, fault classification, severity tier, supporting telemetry trends, and recommended response action. The work order routes to the appropriate HVAC maintenance team based on severity, eliminating the gap between detection and dispatched response that consumes the value of monitoring systems without workflow integration.
Auto-generated CMMS work orders
Severity-based routing
Telemetry evidence attachment
Want to see iFactory's six-capability HVAC analytics platform demonstrated on a configuration equivalent to your chiller plant, AHU bank, and refrigeration loop layout? Book a 30-minute HVAC analytics demonstration with iFactory's industrial energy engineering team.
HVAC Analytics Performance Benchmarks: What U.S. Manufacturers Measure in Year One
Industrial HVAC predictive analytics deployments through iFactory have been documented across pharmaceutical manufacturing, semiconductor fabrication, food and beverage processing, and controlled-environment battery manufacturing facilities. The benchmark table below presents first-year measured outcomes across the energy, reliability, compliance, and production stability domains — giving facility engineering, EHS, and finance leadership the documented numbers required to evaluate the deployment investment against current HVAC operating cost and production deviation exposure.
See iFactory's HVAC Analytics Demonstrated on Your Chiller Plant, AHU Bank, and Refrigeration Loop Configuration
iFactory's industrial energy engineering team demonstrates the energy baselining, refrigerant leak detection, and compressor drift analytics on a simulation built to match your facility's specific HVAC equipment, BMS architecture, and production temperature stability requirements — before any deployment commitment.
Building the HVAC Analytics Business Case: From Energy Drift to ROI
The investment case for HVAC predictive analytics is built on four simultaneous value streams — energy cost reduction from drift elimination, production stability protection from earlier degradation detection, compliance cost reduction from automated EPA documentation, and HVAC maintenance optimization from performance-based service dispatch. iFactory's ROI framework documents each stream with facility-specific data, producing the business case required for capital authorization.
A
Energy Cost Reduction From Drift Detection
The 19% average HVAC energy consumption reduction translates into the largest single ROI component for most facilities. At industrial electricity rates of $0.08 to $0.16 per kWh and HVAC representing 18 to 32% of total facility electricity consumption, the annual savings range from $180,000 at smaller facilities to $1.4 million at large multi-building campuses. The savings are recurring and compound — drift detected and corrected today does not return next year unless equipment degradation reaches the same point again, in which case the platform detects it again.
B
Production Stability and Batch Quality Protection
For controlled-environment manufacturing — pharma, semiconductor, food, battery — the production cost of a facility temperature deviation can dwarf the energy savings value. A single pharmaceutical batch quality hold costs $50,000 to $280,000; a semiconductor fab dimensional excursion event can cost $400,000 to $1.8 million; a battery cell production temperature deviation triggers a multi-day requalification cycle. Earlier degradation detection prevents these events — and the value of one prevented event often exceeds a full year of energy savings.
C
EPA AIM Act and Refrigerant Compliance Value
The EPA AIM Act phases down high-GWP HFC refrigerants on an accelerating schedule, with enforcement provisions that include leak rate reporting requirements and refrigerant management documentation. Predictive leak detection both reduces the compliance reporting burden by automating leak rate documentation and reduces the financial cost of refrigerant loss — at current HFC market prices, a single 300-pound leak event represents $8,000 to $24,000 in refrigerant replacement cost alone, before counting the energy waste during the leak period.
D
HVAC Maintenance Optimization
Performance-based service dispatch — cleaning coils when fouling is detected, changing filters when loading is detected, scheduling compressor service when drift is detected — replaces calendar-based maintenance that simultaneously over-services healthy equipment and under-services degrading equipment. The labor optimization typically recovers 25 to 35% of HVAC maintenance labor hours for redeployment to higher-value work, without compromising equipment reliability.
Want to see the four-stream ROI model built for your specific HVAC equipment footprint and production temperature requirements? Book a demonstration and get a facility-specific ROI projection.
Expert Perspective: What Facility Engineers and Energy Managers Say About HVAC Predictive Analytics
"I have managed industrial HVAC infrastructure at three U.S. manufacturing facilities over 19 years — a pharmaceutical fill-finish operation, a semiconductor packaging plant, and a food processing facility with extensive cold storage. The common pattern across all three is that the BMS told us when something was broken, but never when something was getting worse. We learned about chiller efficiency drift at the annual service when the tech showed us the kW-per-ton readings and asked when we last cleaned the condenser. We learned about refrigerant leaks when the chiller couldn't hold setpoint on the first 95°F day of summer. We learned about AHU coil fouling when production complained that the cleanroom couldn't hold humidity. Every single one of these problems had been developing for weeks or months, and every single one was visible in the BMS data if anyone had been looking for the drift pattern — but no one was, because the BMS itself only looks for threshold crossings. When we deployed iFactory's analytics platform on the chiller plant, the first thing that surprised me was how much drift we already had. The platform identified two compressors running 16% and 23% above baseline efficiency — both had passed their annual service three months earlier, and neither had triggered any BMS alarm. We addressed the drift through targeted condenser cleaning and one refrigerant recharge, and dropped 14% off the plant's monthly kWh consumption in the first quarter. The second thing was the refrigerant leak detection. The platform flagged a chiller as showing charge deficit signature 41 days before the low-pressure alarm would have triggered. We found a slow leak at a service valve, repaired it during a planned maintenance window, and avoided what would have been a production-impacting unplanned outage during peak cooling season. After three years of operation, our annual HVAC electricity spend is down 21% from baseline, our refrigerant emergency events are essentially zero, and our facility temperature stability is the best it has ever been. That is the ROI of replacing alarm-based monitoring with continuous baseline analytics."
— Director of Facility Engineering and Energy Management, U.S. Pharmaceutical Manufacturing Operations — 19 Years in Industrial HVAC and Energy — iFactory HVAC Analytics Reference 2026
21%
HVAC electricity spend reduction after 3 years of operation
41 days
refrigerant leak lead time before BMS alarm would have triggered
Zero
refrigerant emergency events since deployment
Conclusion
Industrial HVAC systems are simultaneously the largest single energy consumer in most manufacturing facilities and the most critical infrastructure dependency for production temperature stability — yet they are monitored with the same alarm-threshold logic that controls a residential thermostat. The result is a class of degradation patterns — chiller efficiency drift, refrigerant charge loss, AHU coil fouling, compressor mechanical wear — that develop invisibly in the gap between BMS threshold settings, consuming hundreds of thousands of dollars in unnecessary electricity and eventually compromising the production stability that the HVAC system exists to protect.
iFactory's HVAC predictive analytics platform replaces threshold-based monitoring with continuous baseline comparison — load-normalized energy consumption baselines for every chiller, AHU, and refrigeration loop, physics-informed models that detect drift signatures weeks before they trigger alarms, and CMMS integration that converts detection into dispatched work orders automatically. The 19% energy consumption reduction, 73% earlier refrigerant leak detection, and 84% production temperature deviation reduction at comparable U.S. facilities are the documented outcomes of treating HVAC degradation as a continuous process to be monitored, not a binary event to be alarmed. Book a Demo to see the HVAC analytics platform applied to your facility's chiller plant, AHU bank, and refrigeration system configuration.
Frequently Asked Questions
Does iFactory's HVAC analytics platform replace the existing BMS or run alongside it?
It runs alongside the BMS, ingesting telemetry via BACnet, Modbus, or OPC-UA without disrupting existing control logic. The BMS continues to handle setpoint control and alarming; iFactory adds the predictive analytics layer above it.
Book a Demo to review BMS compatibility.
How long does the energy baseline calibration period take before the platform delivers actionable insights?
Initial baseline calibration runs 6 to 12 weeks, capturing equipment behavior across load variations and ambient conditions. Refrigerant leak detection and major drift signatures become reliable after week 4. Full multi-seasonal baselines mature over the first year of operation.
Which chiller, AHU, and refrigeration equipment brands does the platform support?
Any equipment with BACnet, Modbus, or OPC-UA telemetry — covering Trane, Carrier, York/Johnson Controls, Daikin, McQuay, and most industrial refrigeration controllers. No proprietary protocol integration required for vendors using open building automation standards.
Does the platform support EPA AIM Act refrigerant leak rate reporting and compliance documentation?
Yes. The platform generates auto-populated leak rate reports with timestamp-stamped detection evidence, refrigerant charge tracking, and the documentation format required for EPA Section 608 compliance. This eliminates the manual record-keeping burden that AIM Act enforcement has intensified.
What is the deployment investment and payback timeline for the HVAC analytics platform?
For a facility with 2 to 8 chillers and 10 to 40 AHUs, deployment runs $75,000 to $185,000 over 4 to 8 weeks covering BMS integration, baseline calibration, and CMMS workflow setup. Against $180K to $1.4M annual energy savings alone, payback typically occurs within 3 to 8 months.
Book a Demo for a site-specific projection.
Eliminate HVAC Energy Drift, Catch Refrigerant Leaks Weeks Earlier, and Protect Production Temperature Stability.
iFactory's industrial HVAC predictive analytics platform baselines your chillers and AHUs against load conditions, detects refrigerant leaks and compressor drift before they trigger BMS alarms, and dispatches CMMS work orders the moment drift signatures cross severity thresholds — delivering 19% energy reduction, 73% earlier leak detection, and 84% fewer production temperature deviations.