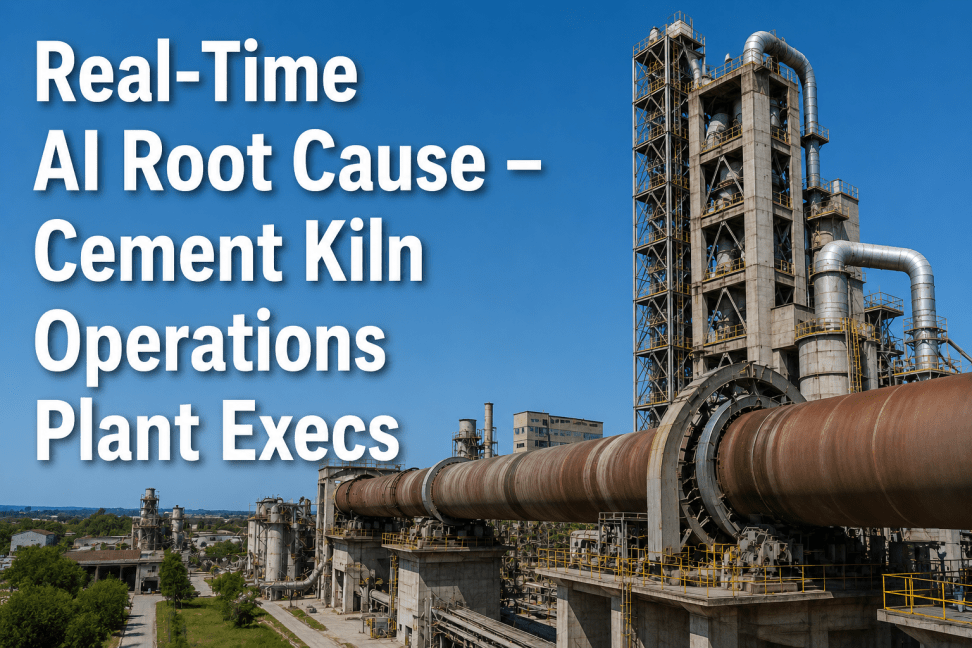
Cement kiln operators manage one of the most complex multivariate processes in industrial manufacturing, where the interaction of more than 100 process variables — burning zone temperature, preheater exit gas composition, ID fan speed, kiln drive torque, liter weight, free lime, and raw mill feed chemistry — determines both energy consumption per ton and final clinker quality. When specific energy consumption drifts above target or a quality deviation occurs, the operator's most time-consuming task is identifying which variable or combination of variables caused the deviation. Traditional root cause analysis relies on manual data review, operator experience and trial-and-error adjustments that consume 30 to 60 minutes of investigation time per event — during which the kiln continues operating at elevated energy intensity. AI-driven root cause detection changes this by applying multivariate machine learning models that analyze the relationships between all process variables simultaneously, identifying the root cause of any deviation within seconds and recommending the corrective adjustment with the highest probability of restoring target conditions. iFactory's AI Root Cause Detection module — part of the iFactory Manufacturing Execution System — brings this capability to kiln control rooms with an on-premise AI appliance that integrates directly with existing DCS and process historian systems. Book a Live SPC Walkthrough to see the platform configured for your kiln line, energy targets, and process configuration.
Pinpoint Root Causes of Energy Drift in Seconds Instead of Hours
iFactory's AI Root Cause Detection identifies the process variable or combination of variables driving energy consumption above target — delivering actionable answers within seconds of a deviation event rather than the 30-60 minutes required for manual investigation. On-premise deployment integrates with existing DCS and historian systems.
Why Energy Consumption Is the Most Actionable Metric for Kiln Root Cause Analysis
Specific energy consumption in cement kiln operations — measured in megajoules per ton of clinker (MJ/t) or kilowatt-hours per ton (kWh/t) — is the integrated result of every process decision made in the kiln line, from raw material blending through clinker cooling. Unlike throughput or quality metrics that are measured periodically through lab samples, energy consumption is measured continuously through fuel flow meters and power meters, providing a real-time signal that reflects the combined effect of dozens of process variables. When specific energy consumption increases by 5 percent on a 5,000 TPD kiln line, the incremental fuel and power cost reaches $350,000 to $600,000 per year — and the root cause could be any combination of raw material hardness changes, burner pipe positioning drift, preheater cyclone efficiency degradation, ID fan speed misalignment, or coating ring formation. The four metrics below frame the energy optimization opportunity that AI-driven root cause detection addresses for cement kiln operations.
The AI Root Cause Detection Pipeline — From Process Data to Root Cause Identification
iFactory's AI Root Cause Detection platform processes kiln operating data through a four-stage pipeline that transforms raw process data into ranked root cause hypotheses with recommended corrective actions. The pipeline operates continuously on streaming DCS data, delivering root cause identification within 30 seconds of a deviation event without requiring operator initiation.
Reduce Investigation Time from 45 Minutes to 30 Seconds
iFactory's AI Root Cause Detection identifies the process variables driving energy consumption above target and recommends corrective actions — all within 30 seconds of a deviation event. See the platform demonstrated on your kiln line's DCS historian data in a live walkthrough session.
Energy Drift Root Causes — Detection and Correction with Multivariate AI
AI-driven root cause detection targets six primary categories of energy drift that account for more than 90 percent of specific energy consumption increases in cement kiln operations. The table below maps each root cause category to the detectable variable patterns that precede energy drift, the AI detection approach, and the typical energy savings opportunity when the root cause is corrected.
| Root Cause Category | Detectable Variable Patterns | AI Detection Method | Energy Savings Potential |
|---|---|---|---|
| Burning Zone Temperature Drift | Gradual burning zone temperature decline with increasing CO and decreasing NOx — indicating incomplete combustion requiring additional fuel to maintain clinker formation temperature | Time-series trend analysis with mode-specific baseline comparison — detects 5-degree temperature drift before it produces measurable energy impact | 2-4% specific energy reduction |
| Preheater Cyclone Efficiency Degradation | Preheater exit temperature rising while ID fan current increases and O2 drops — indicating cyclone blockage or buildup reducing gas-solid heat exchange efficiency | Multivariate anomaly detection correlating preheater exit temp, ID fan load, and O2 concentration — flags efficiency loss 4-8 hours before throughput impact | 1.5-3% specific energy reduction |
| Raw Material Hardness or Grindability Change | Raw mill power consumption increasing with mill differential pressure, while kiln specific energy rises due to coarser raw feed requiring higher burning zone temperature for equivalent free lime | Cross-system correlation model linking raw mill power, kiln energy, and free lime — isolates material-driven energy increase from operational drift | 1-2% specific energy through raw mix adjustment |
| ID Fan and False Air Ingress | ID fan speed increasing to maintain O2 target while fan current rises disproportionately and preheater draft fluctuates — indicating air leakage increasing the gas volume requiring fan work | Transfer entropy analysis between ID fan speed, O2, and preheater draft — quantifies false air percentage and identifies leak location zone | 1-2.5% specific energy reduction after repair |
| Burner Pipe Positioning Drift | Burning zone temperature profile shifting with increased CO at kiln inlet, higher NOx variability, and kiln shell hot spot temperature changes — indicating burner axial or radial position change from thermal expansion or mechanical loosening | Pattern recognition model trained on burner position vs. temperature profile, CO, and NOx signatures — flags position drift before energy impact exceeds 1% | 1-2% specific energy reduction |
| Coating Ring or Build-Up Formation | Kiln drive torque gradually increasing with burning zone pressure fluctuation, shell temperature profile change at ring location, and specific energy rising as the ring restricts gas flow and heat transfer | Time-series pattern recognition on kiln torque, pressure, and shell temperature — identifies ring formation 4-8 hours before energy impact exceeds 2% | 2-4% specific energy recovery after ring removal |
Measured Energy Reduction from AI Root Cause Detection Deployment
The energy savings metrics below represent aggregate results from cement kiln operations that deployed iFactory's AI Root Cause Detection module for 12 months or longer. Results are benchmarked against the 12-month period preceding deployment, normalized for production volume, raw material variation, and ambient conditions.
Expert Perspective — AI Root Cause Detection in Cement Kiln Operations
"The biggest challenge in kiln operations is not the lack of data — it is the overload of data. Our DCS historian stores 120 process variables at one-second resolution, generating more than 10 million data points per day across the kiln line. When specific energy consumption started drifting upward by 2 percent over a week, I had operators spending entire shifts trying to figure out what had changed. They would pull up trend charts for burning zone temperature, NOx, ID fan speed, liter weight — looking for something that looked different — but with 120 variables to check, they were lucky if they found the right one in under an hour. And even when they found a correlated variable, they could not be sure it was causal. AI root cause detection changed this completely. The system analyzes every variable simultaneously and tells the operator: the energy drift is 87 percent likely caused by the combination of a 12-degree burning zone temperature decline and a 4 percent ID fan speed increase that started three days ago. The operator can go directly to the burner and the ID fan instead of spending 45 minutes searching through trend charts. That reduction in investigation time alone improved our operator effectiveness — but the real savings came from correcting root causes earlier, before energy drift accumulated for days before detection."
Conclusion: AI Root Cause Detection Transforms Energy Optimization from Reactive Investigation to Proactive Correction
Cement kiln operators have always understood that energy consumption is the most comprehensive indicator of process health — when the kiln is running optimally, specific energy is at its minimum, and when drift occurs, something has changed in the process that needs correction. The barrier to acting on this understanding has never been a lack of data but the inability to extract causality from the noise of 100-plus correlated process variables. AI-driven root cause detection removes this barrier by analyzing every variable simultaneously, identifying causal relationships rather than correlations, and presenting the operator with ranked root causes and recommended corrections within seconds. The 4 to 10 percent reduction in specific energy consumption that iFactory's platform delivers across cement kiln deployments — validated against fuel bills and power meters — represents savings that compound every day the platform is in operation. For kiln operations teams evaluating whether to invest in AI-driven root cause analysis, the technology is proven, the integration pathway with existing DCS systems is well established, and the energy savings alone deliver payback within 6 to 9 months for most installations.
Frequently Asked Questions
Transform Energy Optimization with AI Root Cause Detection
iFactory's AI Root Cause Detection module delivers 4-10 percent specific energy reduction by identifying the process variables driving energy consumption above target — within seconds instead of hours. On-premise deployment integrates with existing DCS and historian systems. Schedule a live walkthrough to see the platform configured for your kiln line.