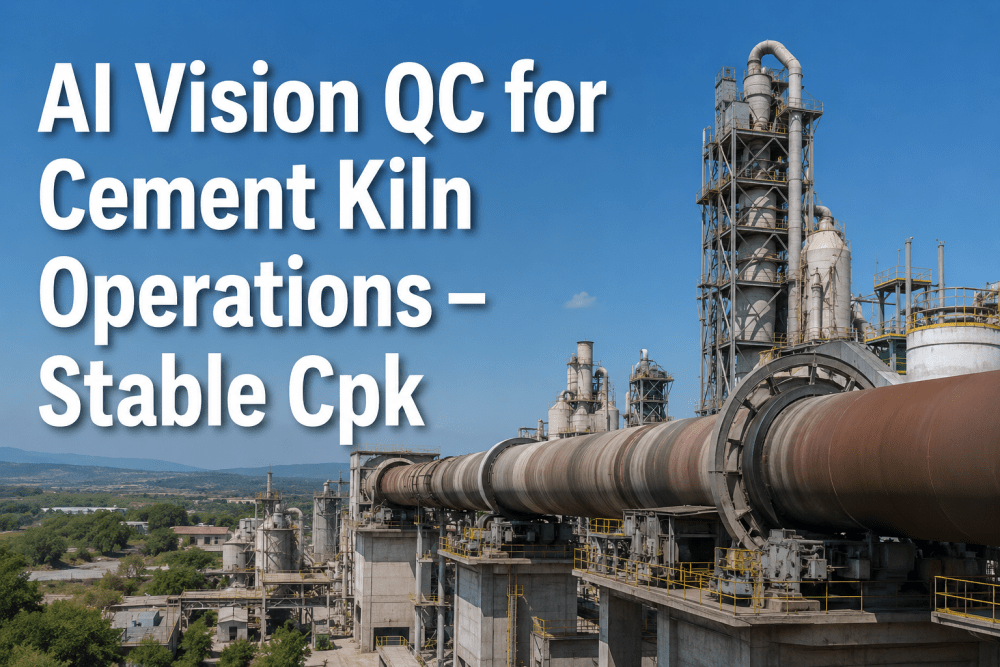
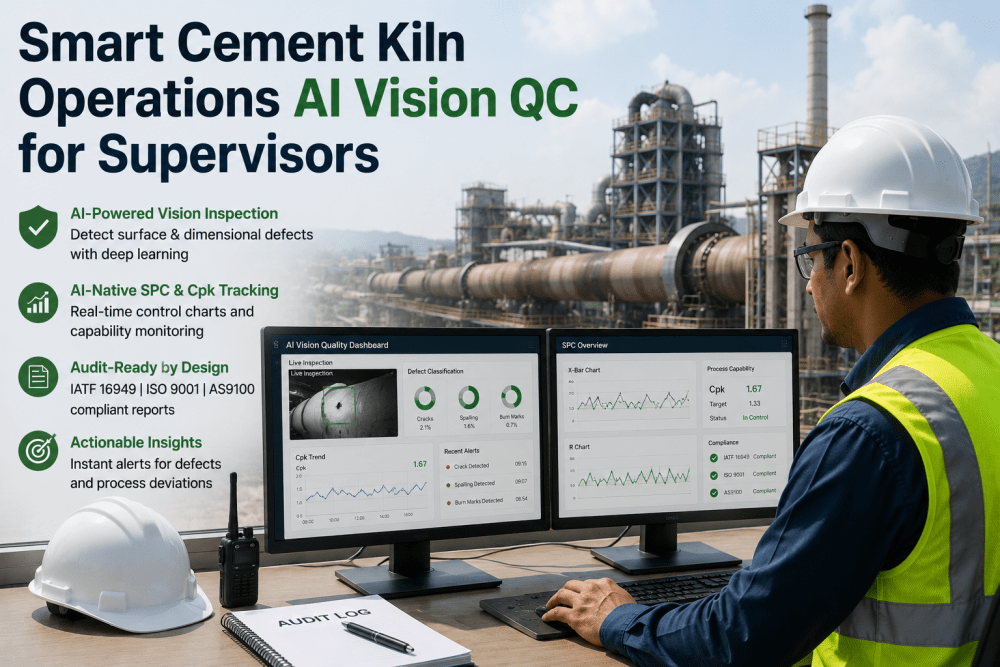
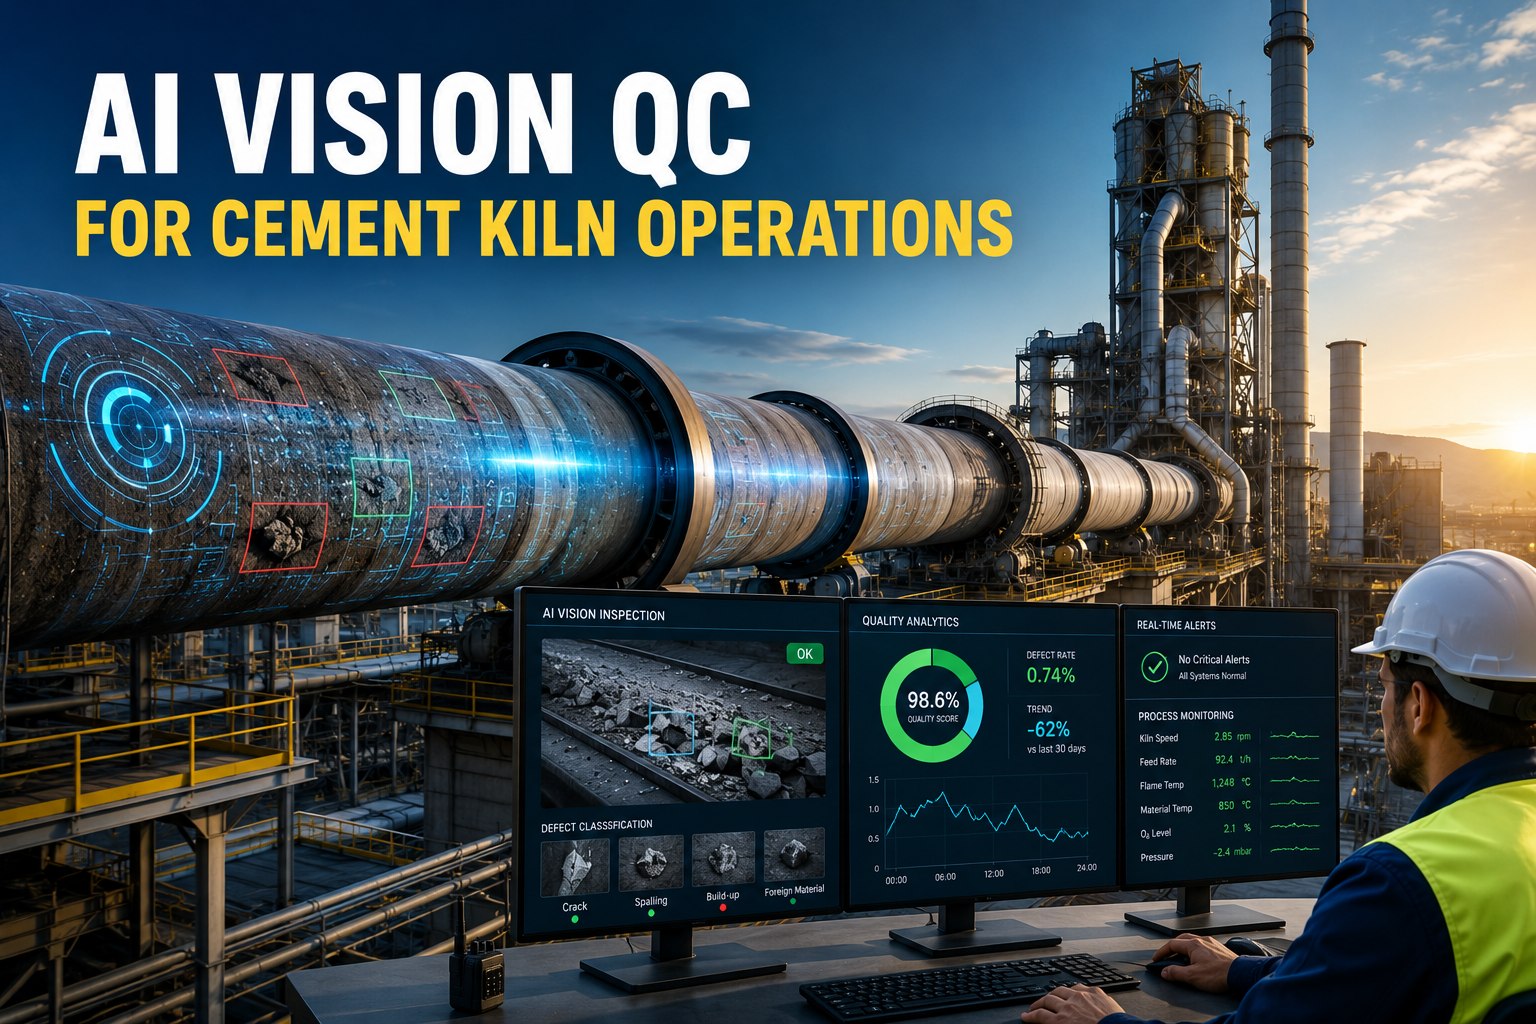
A cement kiln producing 5,000 tons of clinker per day consumes 700 to 900 kilocalories of thermal energy per kilogram of clinker and 50 to 70 kilowatt-hours of electrical energy per ton of cement — making energy the single largest operating cost in cement manufacturing, typically accounting for 30 to 40 percent of total production cost. Quality deviations in the kiln process — free lime outside the 0.8 to 1.5 percent target range, liter weight below 1,350 grams per liter, or C3S content below 60 percent — do not just affect cement performance; they drive up energy consumption by requiring longer residence times, higher burning zone temperatures, and additional grinding energy to correct off-spec clinker. Traditional quality control approaches rely on laboratory sampling every one to two hours and manual visual inspection of clinker and cement samples, creating a 60- to 120-minute gap between when a quality deviation occurs and when it is detected — during which the kiln continues to operate at non-optimal conditions, consuming excess fuel and power. iFactory's AI Vision Quality platform closes this gap by deploying deep-learning machine vision cameras at critical inspection points — clinker discharge, cement mill product stream, and finished cement loading — that detect surface defects, dimensional deviations, and color variations indicating quality shifts within seconds of occurrence, triggering multivariate ML models that correlate visual quality signals with kiln process parameters to recommend energy-optimizing corrective actions. Quality leaders evaluating AI vision for their cement operations can book a demo for a free preliminary Cpk assessment and audit-readiness evaluation against their current quality control processes.
How AI Vision Quality Detection Reduces Energy Consumption in Kiln Operations
The relationship between quality and energy in cement kiln operations is direct and measurable. When clinker quality drifts toward the boundary of specification limits, the kiln operator's typical response is to increase burning zone temperature, extend residence time, or reduce feed rate — all of which increase thermal energy consumption per ton of clinker. When off-spec clinker is produced, it requires additional grinding energy in the cement mill to achieve the target Blaine fineness, and in severe cases it must be blended with higher-quality clinker, further increasing the specific energy consumption per ton of finished cement. The table below maps each quality deviation type to its energy impact, the current detection method, and the AI vision detection capability that reduces detection latency and enables faster, more energy-efficient corrective action.
| Quality Deviation | Energy Impact | Current Detection Method | Detection Latency | AI Vision Detection |
|---|---|---|---|---|
| Free Lime Above 1.5% | Requires 15–25°C higher burning zone temperature to complete CaO reaction, increasing specific thermal energy consumption by 2–4% | Laboratory titration on clinker sample collected at cooler discharge — manual sampling and wet chemistry analysis every 60–120 minutes | 60–120 minutes from sample collection to lab result | Deep-learning vision model trained on clinker microstructure images detects free lime indicator patterns in clinker cross-section at cooler discharge — detection within 60 seconds of clinker exiting the cooler |
| Liter Weight Below 1,350 g/L | Indicates under-burned clinker with lower compressive strength — requires 10–15% higher finish grinding energy to achieve target Blaine fineness, increasing electrical energy consumption by 3–5 kWh per ton | Manual liter weight measurement using a 1-liter container from clinker sampling station — operator collects sample, weighs it, and records result every 60 minutes | 60 minutes from sample collection to recorded result | 3D machine vision camera at clinker belt measures bulk density continuously using volumetric analysis — liter weight estimated every 60 seconds with 97% correlation to laboratory measurement |
| C3S Content Below 58% | Reduces early strength development requiring 5–8% higher cement mill residence time to achieve 28-day strength target, increasing grinding energy consumption | X-ray fluorescence (XRF) analysis on clinker sample — laboratory instrument analysis with sample preparation and reporting every 1–2 hours | 60–90 minutes from sample collection to XRF result | Multispectral vision camera captures clinker surface reflectance characteristics correlated with C3S content — ML model estimates C3S from optical signature within 30 seconds of sample exposure |
| Color and Surface Defects in Cement | Off-color cement and surface texture deviations may indicate false set, flash set, or contamination — requires re-testing, potential re-grinding, or blending with compliant cement, increasing energy consumption by 2–3% overall | Visual inspection by quality control technician — subjective assessment of cement color and texture from mill discharge sample, recorded in log sheet | 30–60 minutes depending on technician availability and shift schedule | HD vision camera at cement mill product stream captures full-belt images every 10 seconds — deep-learning defect detection model identifies color shifts, texture anomalies, and contamination events within 10 seconds of occurrence |
AI Vision Quality Detection Pipeline — From Camera Image to Energy-Saving Corrective Action
The AI Vision Quality platform processes image data through a five-stage pipeline that transforms raw camera frames into ranked, actionable quality alerts with energy-optimized corrective recommendations. Quality leaders who want to see this pipeline demonstrated against their plant's clinker and cement samples can book a demo for a live walkthrough with an iFactory cement vision engineer.
Measured Results from Cement Plant Deployments
The metrics below represent average results from iFactory AI Vision Quality platform deployments across cement kiln and finish mill operations over 12-month validation periods. Individual results vary based on kiln configuration, sensor coverage, quality target tightness, and existing process control maturity.
Quality Leader's Perspective: AI Vision Quality and Energy Optimization
Conclusion: AI Vision Quality Is the Missing Link Between Quality Control and Energy Optimization
Cement quality leaders have historically been held to conflicting objectives — improve quality performance and reduce energy consumption, often without the real-time data needed to optimize both simultaneously. Laboratory sampling provides accurate quality data but with a 60- to 120-minute latency that limits its usefulness for real-time process control. AI vision quality inspection closes this gap by delivering quality detection within seconds, at the same accuracy level as laboratory analysis, with the additional benefit of multivariate process correlation that identifies root causes and recommends energy-optimized corrective actions. The 4 to 10 percent reduction in specific energy consumption that AI vision delivers is not achieved by compromising quality — it is achieved by detecting quality deviations faster, correcting them more precisely, and preventing the energy-wasteful over-correction that occurs when operators lack the real-time quality feedback they need to run the kiln at its optimum point. For quality managers and quality assurance leaders evaluating their next quality improvement investment, AI vision quality inspection offers a rare combination of outcomes: improved process capability indices, reduced energy costs, audit-ready quality documentation, and a platform that bridges the historical gap between quality control and energy management.