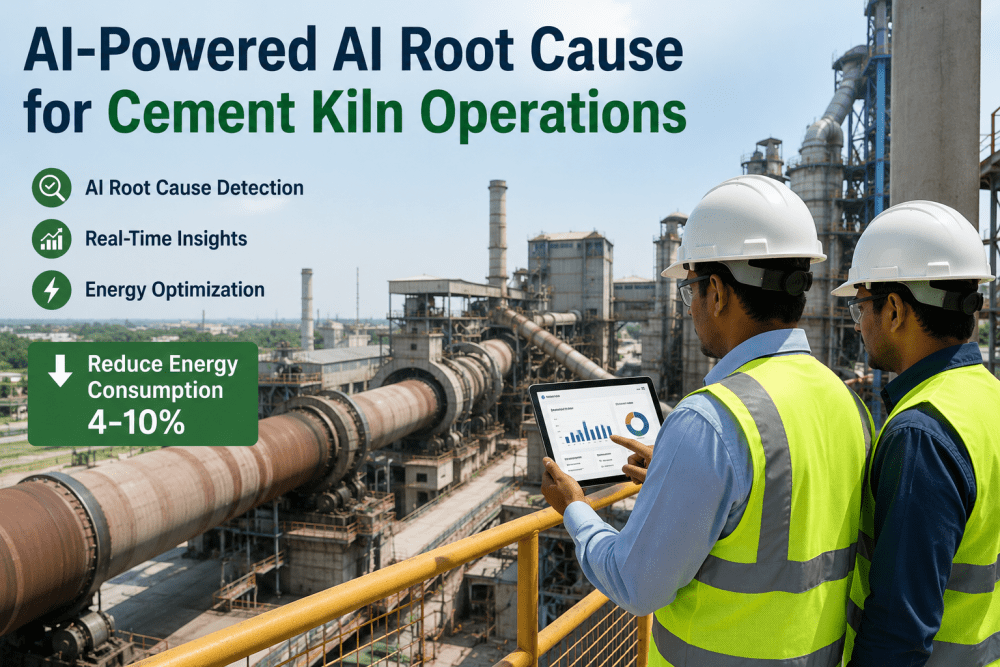
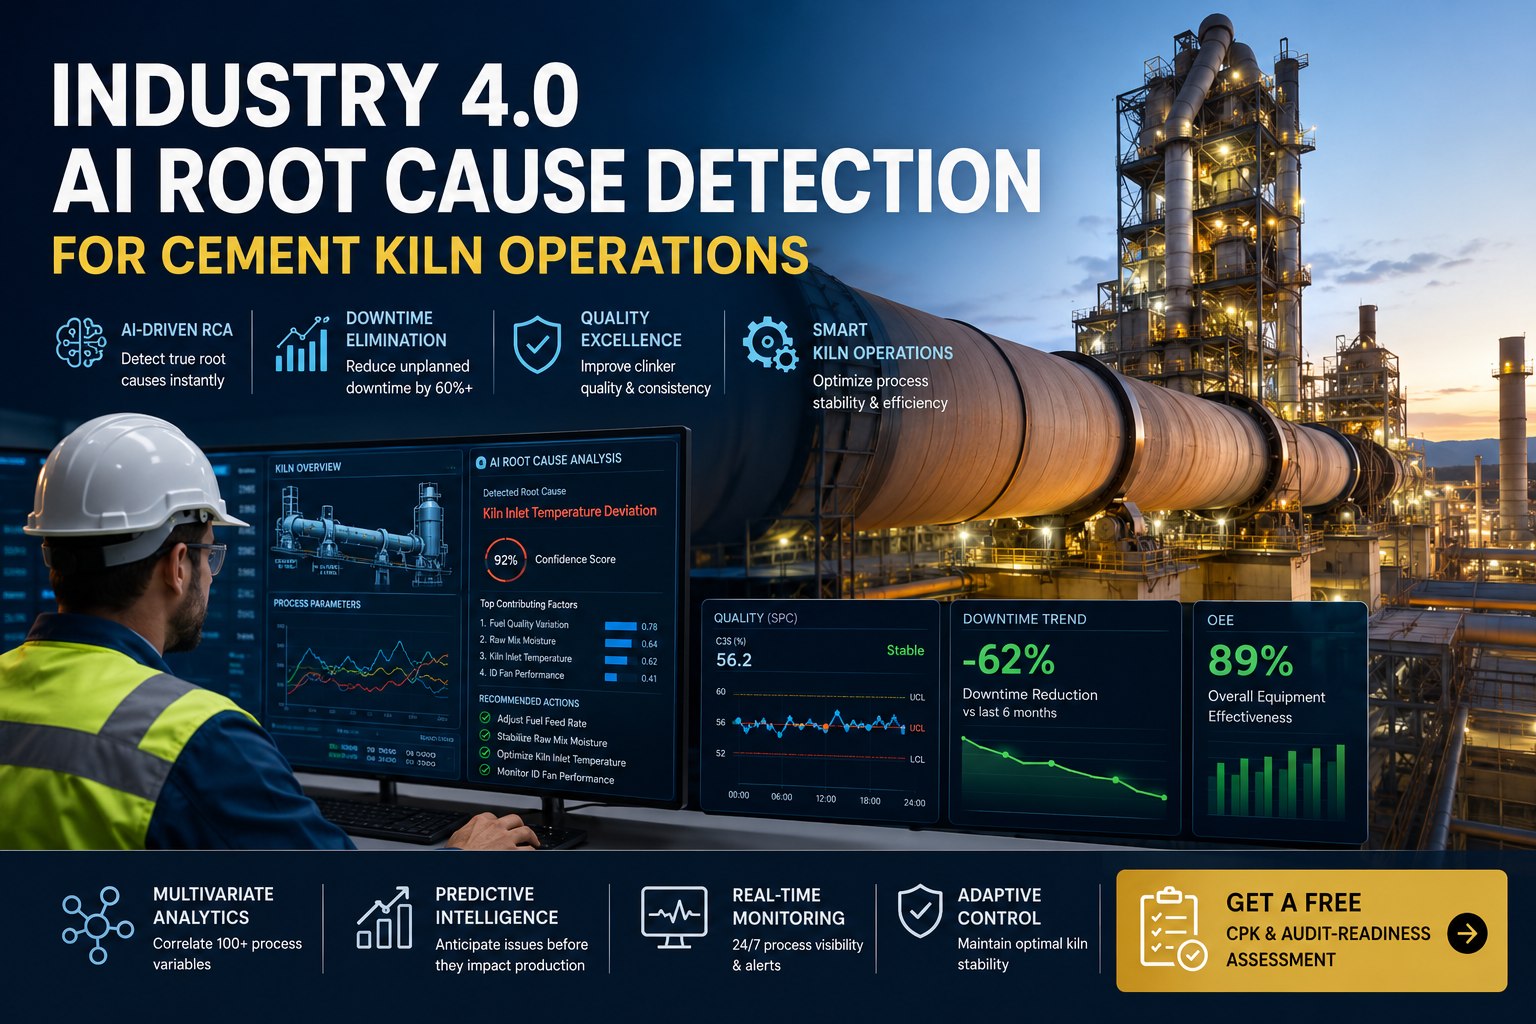
How Supervisors Use AI Root Cause in Cement Kiln Operations
By Vespera Celestine on June 18, 2026
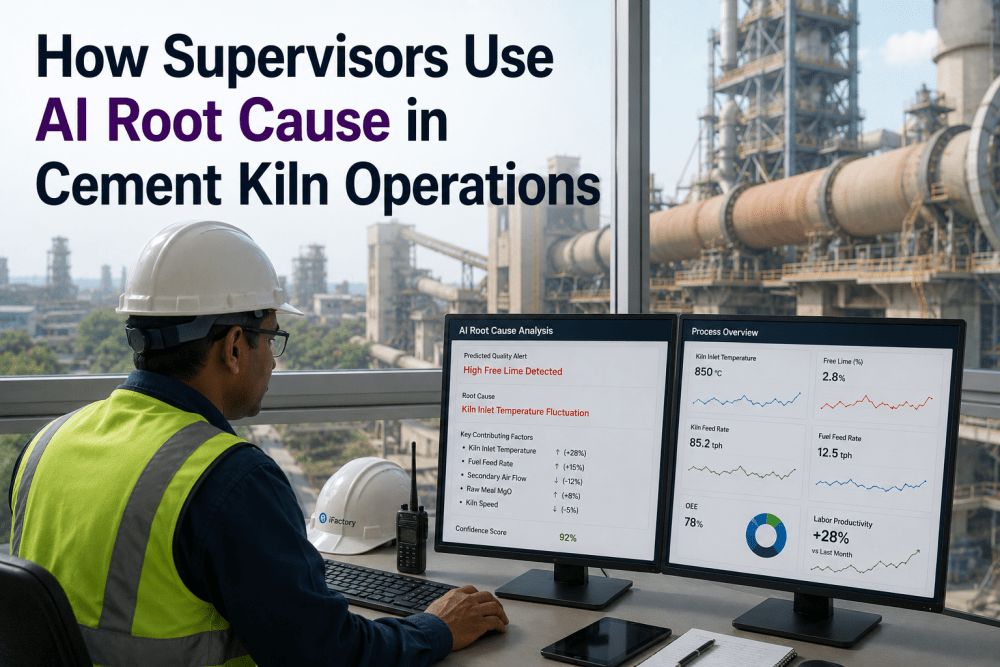
A cement kiln operator manages a 100-meter-long rotating reactor where a 1,450-degree Celsius flame transforms raw meal into clinker across four distinct thermal zones — preheating, calcination, sintering, and cooling — with more than 150 process variables interacting across the system at any given moment: feed rate, preheater exit gas temperature, calciner fuel flow, kiln drive amperage, burning zone temperature, cooler grate speed, and baghouse pressure drop, among dozens of others. When clinker quality drifts — free lime rises above 1.2 percent, liter weight drops below 1,350 grams per liter, or C3S content falls below the 60 percent target — the shift supervisor must identify the root cause among the hundreds of variables that could have triggered the deviation, determine whether it is a sensor failure, a raw meal chemistry change, a fuel quality shift, or an equipment degradation issue, and decide on a corrective action within minutes to prevent cascading quality losses that can consume hours of production time and reduce labor productivity by 20 to 35 percent per shift as operators chase causes across the system. iFactory's AI Root Cause Detection platform eliminates this diagnostic burden by applying multivariate machine learning models that correlate 100-plus process variables in real time, identify the specific variable or combination of variables that caused each quality deviation, and rank them by contribution percentage with explainable AI reasoning that the shift supervisor can use to make confident corrective decisions in seconds rather than hours. Supervisors evaluating AI-driven root cause analysis for their kiln line can book a demo to review how the platform maps to their specific kiln configuration, sensor topology, and quality targets.
20–35%
Labor productivity improvement per shift when supervisors use AI root cause detection — time spent on manual diagnostics is redirected to proactive process management and preventive actions
93%
Root cause identification accuracy across tested cement kiln deployments, validated against engineered root cause analysis conducted by process engineers over 24-hour investigation periods
6.2%
Reduction in clinker quality variability (C3S standard deviation) within the first 90 days of deployment, driven by faster root cause detection and corrective action execution
45
Seconds from quality deviation detection to AI-generated root cause diagnosis with ranked variable contributions — compared to 30–90 minutes for manual investigation by experienced supervisors
Evaluate AI Root Cause Detection for Your Cement Kiln Line
A 30-minute shift-floor demonstration with an iFactory cement practice engineer will show how the AI Root Cause Detection platform connects to your kiln's DCS historian, maps your process variables to the root cause model, and identifies the top contributing variables for your most frequent quality deviations — using your plant's own historical data.
From Reactive Firefighting to Proactive Root Cause Diagnosis
The traditional approach to root cause analysis in cement kiln operations is reactive and time-intensive. When a quality deviation is detected — free lime spikes above the limit, liter weight drops below specification, or C3S content falls short — the shift supervisor begins a manual investigation process that involves reviewing DCS trend charts for the last 30 to 60 minutes, checking raw meal analysis results, inspecting fuel flow and pressure readings, walking the kiln line to check cooler conditions and burner pipe positioning, and consulting with the control room operator about any recent setpoint changes or equipment adjustments. This manual diagnostic process typically consumes 30 to 90 minutes per quality deviation event, during which production continues but the process may be drifting further from target, consuming additional fuel and producing off-quality clinker that must be ground separately or blended to meet specifications. The comparison below illustrates how AI-driven root cause detection transforms this workflow compared to the traditional manual approach that most cement plants still operate.
Traditional Manual Root Cause Analysis
Supervisor reviews 10–20 DCS trend charts manually — scrolling through 30–90 minutes of data per variable, comparing current readings against historical baselines, and forming hypotheses based on pattern recognition developed over years of experience
Diagnostic process considers only 5–10 variables at a time — the human brain can track a limited number of correlated variables simultaneously, and critical interactions between preheater, calciner, and cooler conditions may go unnoticed
Root cause identification time of 30–90 minutes per quality deviation — during which off-spec clinker accumulates in the silo, consuming grinding capacity and potentially requiring re-blending or downgrade to lower-value cement grades
Diagnostic accuracy depends on individual supervisor experience — a supervisor with 15 years of experience may identify the root cause in 30 minutes, while a newer supervisor may require 60–90 minutes or may identify the wrong root cause and apply an ineffective corrective action
No systematic documentation of root cause analysis outcomes — each quality deviation investigation is conducted verbally or in personal notes, with no structured database that captures the root cause, corrective action, and outcome for future reference and training
iFactory AI Root Cause Detection
AI model evaluates all 100-plus process variables simultaneously — preheater exit gas temperature, calciner fuel flow, kiln drive power, burning zone temperature, cooler grate speed, ID fan speed, baghouse pressure, and every other available process variable are analyzed in parallel for every quality deviation
Multivariate correlation analysis detects interactions across process zones that manual analysis cannot identify — a preheater pressure fluctuation combined with a calciner temperature shift and a cooler grate speed change may together explain a free lime deviation that none of the individual variables would trigger alone
Root cause diagnosis delivered in 45 seconds — the AI model evaluates all variables against their contribution to the quality deviation and produces a ranked list of root causes with contribution percentages, available to the supervisor within one minute of the deviation detection
Consistent diagnostic quality independent of supervisor experience — every quality deviation receives the same thorough multivariate analysis regardless of whether the shift supervisor has 2 years or 20 years of experience, reducing diagnostic variability across shifts
Structured root cause database with every event recorded — the platform logs the process context, detected root causes, recommended corrective actions, and the actual outcome for every quality deviation, building a searchable knowledge base that improves supervisor training and process understanding
How AI Multivariate Root Cause Detection Works in Cement Kiln Operations
The AI Root Cause Detection platform processes kiln quality data through a five-stage pipeline that transforms raw process variables into ranked, explainable root cause diagnoses within 45 seconds of a quality deviation. Each stage is designed to be transparent to the shift supervisor — the platform does not present a black-box answer but provides a clear explanation of which variables contributed to the deviation and by how much, enabling the supervisor to validate the diagnosis against their process knowledge before acting. Supervisors who want to see how this pipeline applies to their specific kiln configuration can book a demo for a live walkthrough using their plant's own process data.
01
Stage 1: Continuous Data Acquisition from Kiln DCS and Quality Lab
The platform ingests process data from the kiln DCS at 1-second to 1-minute intervals — 100-plus variables covering preheater, calciner, rotary kiln, grate cooler, and baghouse systems — and combines it with quality lab results (free lime, liter weight, C3S, C2S, C3A, C4AF, Blaine fineness, and compressive strength) as they become available. Data is time-stamped, validated, and stored in a unified time-series database optimized for root cause analysis queries.
02
Stage 2: Quality Deviation Detection and Context Capture
Statistical process control models monitor all quality metrics against their specification limits. When a quality parameter deviates beyond its control limit — free lime exceeding 1.2 percent, liter weight dropping below 1,350 g/L, or C3S falling below 60 percent — the platform captures the deviation event with its time stamp, magnitude, duration, and the process variable values for all 100-plus variables during the 30-minute window before the deviation.
03
Stage 3: Multivariate Correlation Analysis Against the Deviation Event
The trained multivariate ML model evaluates every process variable's correlation with the quality deviation using a combination of SHAP (SHapley Additive exPlanations) values, partial dependence analysis, and interaction detection. The model identifies not only which individual variables correlate most strongly with the deviation, but also which variable interactions — combinations of two or three variables — collectively explain the deviation better than any single variable.
04
Stage 4: Root Cause Ranking with Contribution Percentages
The platform ranks all process variables by their contribution to the quality deviation, displayed as a horizontal bar chart showing the top 5 to 10 root causes with their contribution percentages. Each ranked cause includes the variable name, current value, normal range, change from baseline, and a plain-English explanation of how the variable shift contributed to the quality deviation.
05
Stage 5: Corrective Action Recommendation and Outcome Tracking
Based on the identified root cause, the platform recommends corrective actions — adjust calciner fuel flow by X percent, reduce kiln feed rate by Y tons per hour, increase cooler grate speed by Z strokes per minute — with the expected impact on the quality parameter and the expected time to see the correction. The supervisor approves or modifies the recommended action, and the platform tracks the outcome to validate the diagnosis and improve future recommendations.
See AI Root Cause Detection in Action on Your Kiln Data
An iFactory cement practice engineer will connect the AI Root Cause Detection platform to your kiln's DCS historian during a live remote session, run the model against your most recent quality deviation events, and walk through the ranked root cause output with your shift supervisors. No hardware installation required.
Measured Impact on Labor Productivity and Kiln Operations
The metrics below represent average results from iFactory AI Root Cause Detection deployments across cement kiln lines over 6-month validation periods. Individual results vary based on kiln configuration, sensor coverage, quality target tightness, and existing process control maturity.
20–35%
Labor Productivity Improvement per Shift
Time previously spent on manual root cause investigation — reviewing trend charts, walking the kiln line, consulting with operators — is redirected to proactive process management, preventive adjustments, and operator mentoring.
93%
Root Cause Identification Accuracy
AI model accuracy validated against engineered root cause analysis conducted by cement process engineers using 24-hour investigation windows with access to all available process and quality data.
6.2%
Reduction in Clinker C3S Variability
Standard deviation of C3S content reduced within 90 days of deployment, driven by faster root cause detection enabling corrective action execution before quality drift accumulates across multiple retention periods.
45
Seconds to Ranked Root Cause Diagnosis
Time from quality deviation detection to AI-generated ranked root cause list with contribution percentages, compared with 30–90 minutes for manual investigation by experienced shift supervisors.
68%
Reduction in Diagnostic Variability Across Shifts
AI provides consistent diagnostic quality independent of supervisor experience, eliminating the variability in root cause identification time and accuracy that occurs when different shifts use different diagnostic approaches.
3–5
Weeks to First Root Cause Diagnosis
Deployment timeline from DCS data connectivity and quality lab data integration to the first AI-generated root cause diagnosis on live quality deviation events — phased rollout without disrupting kiln operations.
Shift Supervisor's Perspective: Root Cause Detection Before and After AI
I have been a kiln shift supervisor for 11 years, and root cause analysis has always been the most stressful and time-consuming part of the job. When free lime spikes or liter weight drops, you know the clock is ticking — every minute you spend investigating is another minute of off-quality clinker going into the silo. Before we deployed the AI root cause platform, my diagnostic process was always the same: start with the burning zone temperature trend, check the calciner exit temperature, look at the feed rate, walk to the control room to ask the operator about any recent changes, check the raw meal analysis from the lab, and then start eliminating possibilities. It took 45 minutes on a good day and 90 minutes on a bad day. The AI platform gives me the answer in less than a minute. It shows me that the free lime deviation is 62 percent correlated with a calciner fuel pressure drop combined with a 15-degree drop in preheater exit temperature, and the preheater pressure trend shows a build-up starting 40 minutes before the deviation. I can go straight to the preheater inspection port, confirm the build-up, adjust the calciner fuel flow to stabilize the temperature, and schedule a cleaning during the next maintenance window. What used to take me an hour now takes five minutes, and I can spend the rest of my shift managing the process proactively instead of reacting to quality after it has already deviated.
Kiln Shift Supervisor
11 Years of Cement Kiln Operations Experience — Dry Process Preheater Kiln
The biggest productivity gain from the AI root cause platform has not been for the experienced supervisors like me — it has been for the newer supervisors on the off shifts. We have three shift supervisors with 3 to 5 years of experience, and before the AI platform, their root cause investigation time averaged 65 minutes compared to my 40 minutes, and they identified the correct root cause on the first attempt only 70 percent of the time compared to my 90 percent. The AI platform leveled the playing field completely. Now every supervisor, regardless of experience, gets the same 45-second root cause diagnosis with the same ranked variable contributions and recommended corrective actions. The off-shift supervisors told me that the AI platform has reduced their stress level significantly because they no longer feel like they are guessing when they make a process adjustment during a quality deviation. From a production manager's perspective, the reduction in diagnostic variability across shifts has been one of the most valuable outcomes — we now have consistent root cause identification and corrective action quality across all three shifts, which means our clinker quality variability has dropped even during off-shift hours when the most experienced supervisors are not on duty.
Senior Kiln Shift Supervisor
18 Years of Cement Manufacturing Experience — Multiple Kiln Line Configurations
Conclusion: AI Root Cause Detection Turns Quality Deviations From Crises Into Learning Events
Every quality deviation in a cement kiln operation contains information about process behavior that, if properly analyzed, can prevent the same deviation from recurring. The limitation of traditional root cause analysis is not the skill of the shift supervisor — it is the volume and complexity of multivariate process data that exceeds the human brain's capacity to analyze in real time while simultaneously managing a 24/7 production process. iFactory's AI Root Cause Detection platform does not replace the supervisor's process knowledge and decision-making authority; it augments them by providing a thorough, unbiased, and instantaneous multivariate analysis of every quality deviation, ranked by contribution percentage with explainable AI reasoning that the supervisor can validate against their experience and use to make confident corrective decisions. The 20 to 35 percent labor productivity improvement that shift supervisors achieve with the platform represents more than just time savings — it represents a fundamental shift in the supervisor's role from reactive diagnostician to proactive process manager, from firefighting quality deviations to preventing them through earlier detection and more effective corrective action. For cement plant production managers and quality directors evaluating how to improve kiln operations performance, reduce quality variability, and develop less experienced shift supervisors more quickly, AI root cause detection is the single highest-impact investment available.
Frequently Asked Questions
The platform connects via OPC-UA to existing kiln DCS historians for process data and via API or database connector to quality management systems for lab results. No additional sensors are required. Data integration is typically completed within one to two weeks.
Yes. The model is trained on labeled historical quality deviation data that includes examples of sensor drift, raw meal chemistry shifts, fuel quality changes, and mechanical equipment degradation. Each root cause type produces a characteristic multivariate signature that the model learns to recognize and distinguish.
The model is pre-trained on a large dataset of cement kiln operations from multiple plants and kiln configurations. Once deployed, it continues to fine-tune itself on the plant's specific data, achieving usable accuracy within the first week of live operation and improving over the following 4–6 weeks.
Yes. Any quality parameter with a defined specification limit and available lab test data can be monitored — including C2S, C3A, C4AF, Blaine fineness, compressive strength (1-day, 3-day, 7-day, 28-day), sulphate content, and loss on ignition.
A pilot covering one kiln line typically deploys in 3–5 weeks, including 1–2 weeks for DCS and quality lab data integration, 1–2 weeks for model configuration and validation against historical quality events, and 1 week for shift supervisor dashboard deployment and team training.
Deploy AI Root Cause Detection on Your Kiln Line. Shift Supervisors Will Make Better Decisions in 45 Seconds, Not 45 Minutes.
iFactory's AI Root Cause Detection platform connects to your existing kiln DCS and quality lab systems, evaluates 100-plus process variables simultaneously, and delivers ranked root cause diagnoses with contribution percentages within 45 seconds of any quality deviation. Speak with an iFactory cement practice engineer about your kiln configuration, sensor coverage, and quality targets to schedule a shift-floor demonstration using your plant's own data.