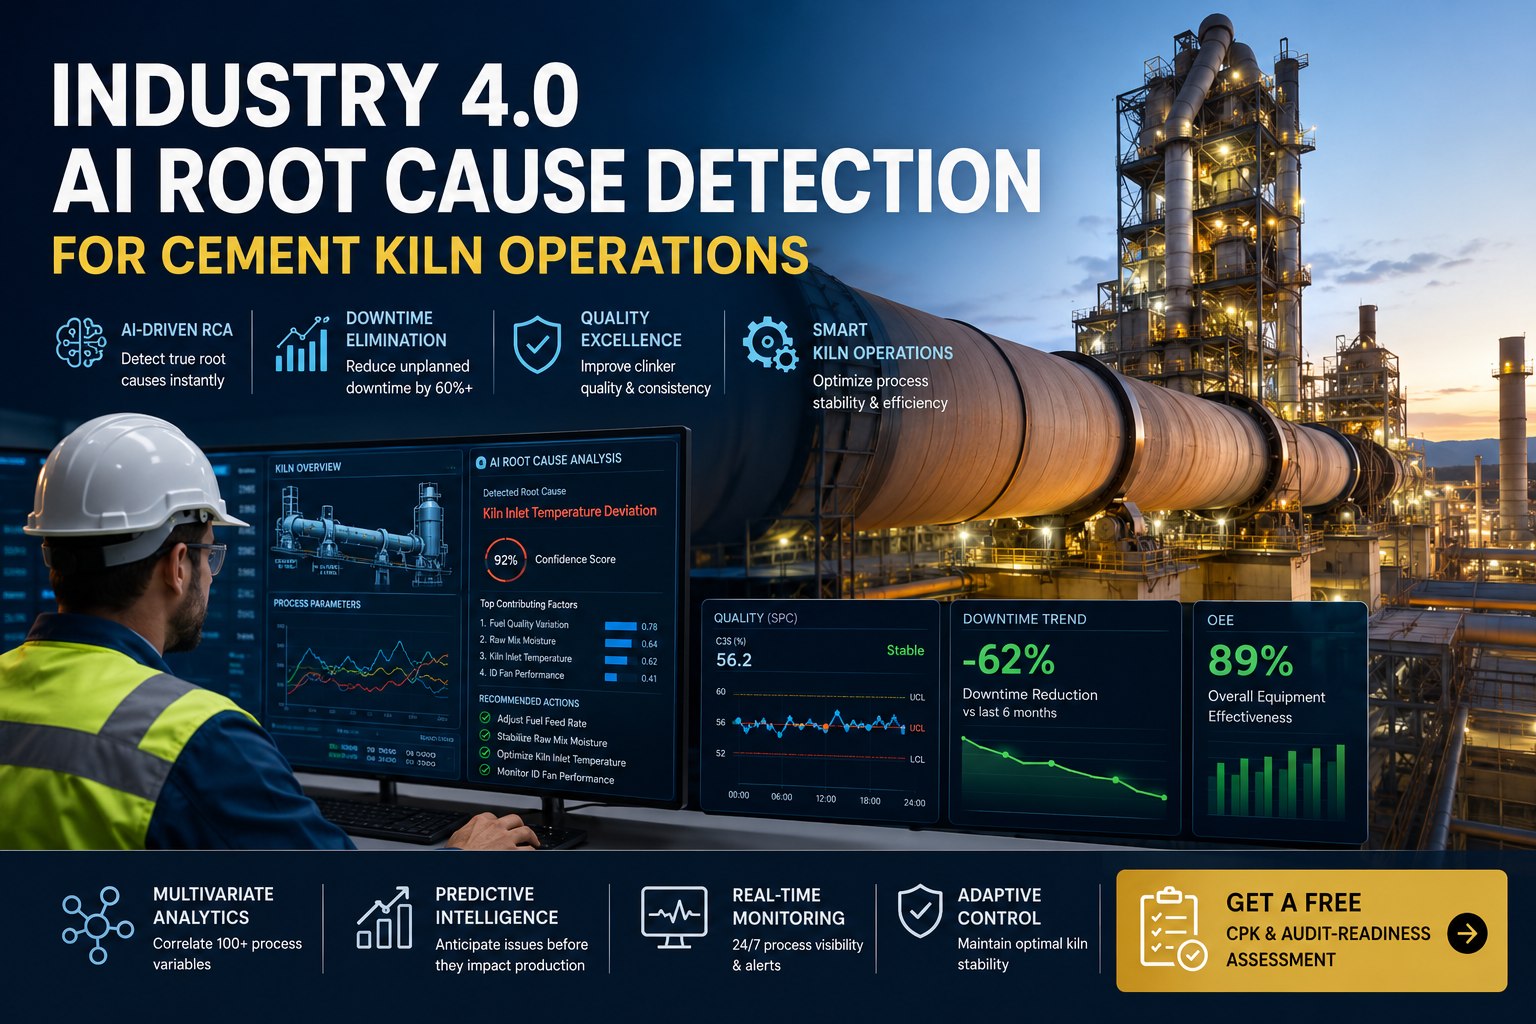
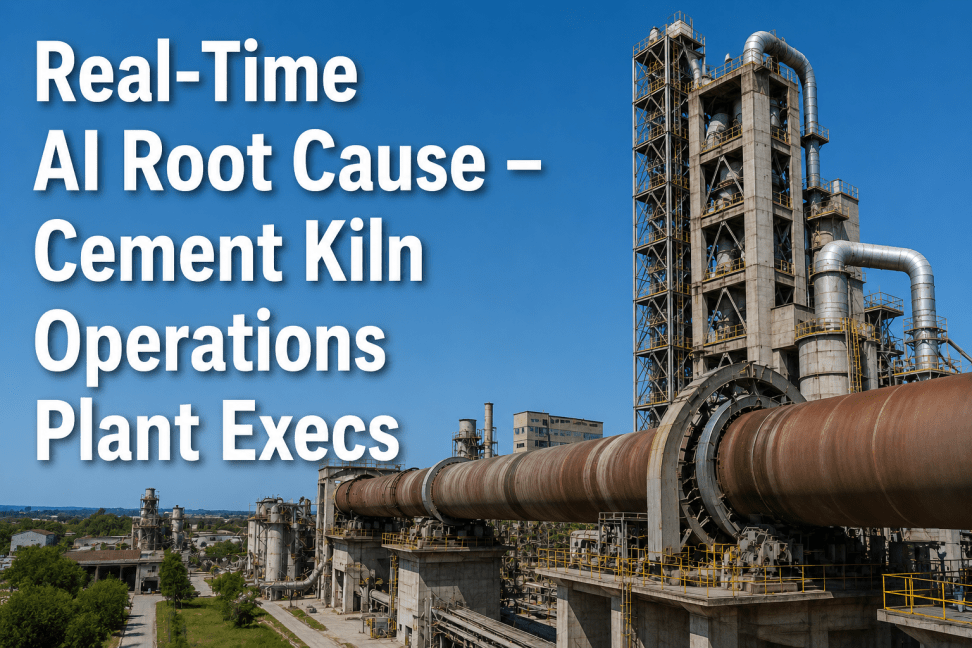
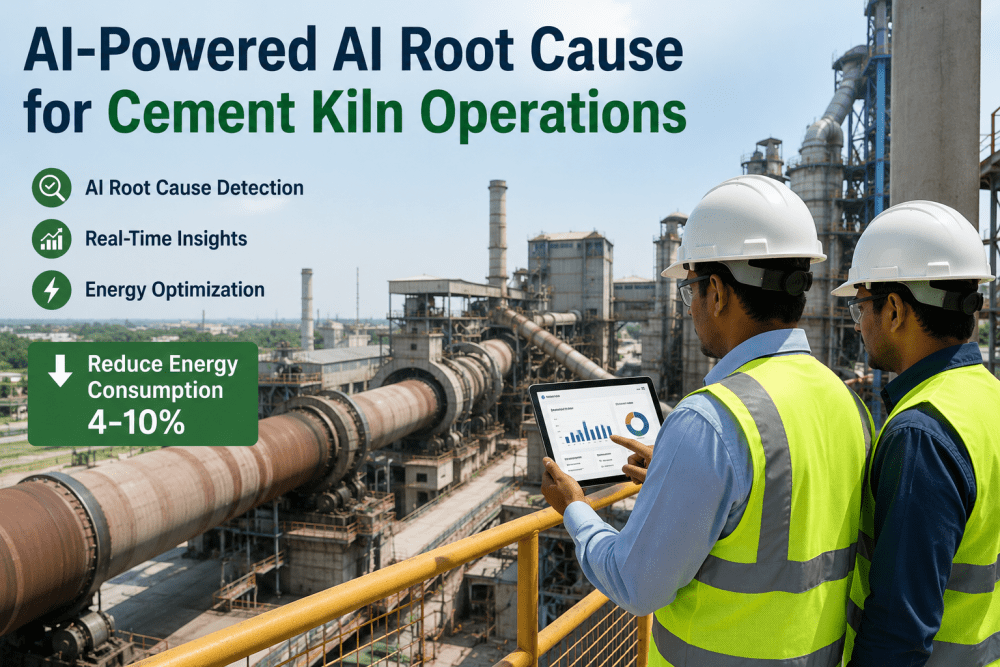
Industry 4.0 AI Root Cause for Cement Kiln Operations
By Riley Quinn on May 18, 2026
By the time the lab confirms a free-lime excursion, 400 tonnes of off-spec clinker are already in the silo. By the time a kiln operator notices the burning zone drifting, fuel is being burned to compensate for a problem that started two hours upstream in the raw mill. And by the time a quality manager finishes the post-mortem, the same root cause has triggered the next deviation. This is the lag economy that traditional cement quality control runs on — and it's exactly what AI root cause detection for cement kiln operations is built to dismantle. Modern multivariate machine learning correlates hundreds of process variables in real time, identifies the upstream signal chain behind every quality excursion, and turns the kiln from a black box into a transparent, predictable process.
The Hidden Cost of Reactive Root Cause Analysis
In a typical cement kiln, every minute of late detection compounds into tonnes of off-spec clinker and emergency fuel spend.
The Deviation Cascade
Raw Mix DriftBurning Zone ShiftHigh Free LimeStrength FailureCustomer Claim
2–4 Hour Lab Lag
The window where damage becomes irreversible
What It Costs Per Hour
$50K–$300K Lost Output30–50 kcal/kg Fuel WasteCpk Collapse
For quality leaders running rotary kilns, the math is brutal. A single hour of kiln deviation can erase a quarter’s worth of efficiency gains. And the diagnostics tools most plants still rely on — periodic XRF samples, 5-Whys workshops, end-of-shift logbooks — were never designed to keep pace with a process that involves more than 100 interdependent variables shifting continuously. This is the gap AI was made for — book a live kiln RCA demo to see it on your own data.
Why Cement Kilns Defeat Traditional Root Cause Methods
Fishbone diagrams and 5-Whys still have a place in maintenance shops, but they break down on the kiln line for a simple reason: clinker quality is a multivariate problem masquerading as a single-number metric. Free lime above 1.5% looks like one defect, but its roots sprawl across raw mix proportioning, fuel calorific drift, preheater stability, burning zone temperature, and cooler quench rate — all interacting non-linearly. Manual RCA picks one path and stops. AI maps the whole tree.
Traditional RCA
Manual & Reactive
Built for single-variable, low-frequency failures
Triggered only after a deviation reaches the lab
Investigates 3–5 variables at a time, sequentially
RCA cycle: hours to days, often unresolved before recurrence
Knowledge stays in operators’ heads — lost at handover
Outcome:Same defects repeat shift after shift
vs
Speed & Scale Gap
AI-Driven RCA
Multivariate & Proactive
Built for continuous, high-dimensional kiln data
Predicts deviations before lab samples leave the kiln
Correlates 100+ variables continuously across the line
RCA cycle: minutes, with ranked probable causes
Every event captured in a permanent failure-pattern library
Outcome:60%+ quality-driven downtime eliminated
Curious how your current RCA cycle stacks up against AI-driven detection? Book a 30-minute kiln intelligence demo and see your own plant’s data on the platform.
The Multivariate Picture: 100+ Variables Behind Every Free-Lime Spike
The reason AI root cause detection works on kilns where Six Sigma sometimes stalls is that it sees the process the way it actually behaves — as a high-dimensional system, not a control chart. A single clinker quality event has signals scattered across raw mix chemistry, kiln aerodynamics, fuel mix, and thermal profile. Mapping them by hand is impossible. Mapping them with machine learning is now standard practice.
1
Raw Mix & Pre-Kiln Inputs
Quarry-face chemistry shifts, weigh feeder ratios, alternative fuel calorific value, raw meal fineness, and homogenization silo behavior. Drift here cascades downstream within minutes.
LSFSMAMMoistureFineness
2
Kiln & Burning Zone
Burning zone temperature, shell temperature profile, kiln drive amps, O&sub2;/CO/NOx, secondary air, flame momentum, and refractory coating stability — the heart of the multivariate correlation engine.
100+process tags correlated every cycle
3
Cooler & Quality Outputs
Cooler quench rate, secondary air temperature, clinker free lime, liter weight, litre-weight stability, and predicted 28-day strength — the outcomes your KPIs live or die by.
Free LimeLiter Wt.C3SCpk
Where it gets powerful: when free lime spikes, AI doesn’t just flag the spike. It traces backward through the time-correlated chain — finds that a quarry shift 90 minutes ago pushed LSF to 1.01, the burning zone never compensated, and a coater-zone temperature dip 40 minutes ago let combustion drift. Three causes, one explanation, one click. That’s the difference.
Turn Your Kiln Data Into a Cpk Engine
iFactory’s AI platform connects to your existing DCS, XRF, gas analyzers, and LIMS — no rip-and-replace — and delivers a live, ranked root cause for every clinker excursion. See how your plant’s data looks on the platform in a live demo.
How AI Root Cause Detection Actually Works on a Live Kiln
The mechanics aren’t mysterious — they’re a disciplined four-step loop running continuously against your historian. The output isn’t a dashboard; it’s a closed corrective action that prevents the next recurrence.
Step 1 — Ingest & Baseline
Stream live data from DCS, SCADA, and LIMS over OPC-UA and MQTT
Unify XRF, gas analyzer, and PSD inputs into one process tag space
Establish steady-state signatures per kiln, per grade, per fuel mix
Calculate rolling Cp, Cpk, Pp, Ppk across critical parameters
Step 2 — Detect & Correlate
Run Western Electric and Nelson rules on every critical-to-quality tag
Apply multivariate models (PCA, PLS, gradient-boosted) for hidden drift
Cross-reference current pattern against historical failure-pattern library
Predict free lime, liter weight, and 28-day strength 30–90 min ahead
Step 3 — Diagnose & Act
Return ranked probable root causes with supporting evidence trails
Push prescriptive setpoint guidance to operator HMI or shift report
Auto-generate CAPA tickets — no manual data re-entry
Log signed corrective action into audit-ready electronic trail
Want to see this loop running on real cement plant data? Schedule a personalized walkthrough and bring your toughest recurring defect to the conversation.
What Quality Leaders Actually Get: The KPI Impact
Numbers from operating cement plants on AI-driven root cause detection are remarkably consistent. The pattern is clear: when detection compresses from hours to minutes and RCA shifts from reactive to predictive, the gains stack across availability, quality, and energy at the same time.
60%+
Quality-driven downtime eliminated
Cement plants running real-time multivariate SPC report 60%+ reduction in stops attributable to quality excursions, with off-spec events caught 30–90 minutes before lab confirmation
31%
Fewer off-spec clinker events
Documented at a mid-sized cement plant deploying iFactory AI MES — quality deviations caught on average 40 minutes before they would have appeared in conventional lab results
30–50
kcal/kg fuel saved per tonne clinker
When over-burning compensation is no longer needed because free lime is predicted live, plants recover the thermal headroom they were burning as insurance against the lab lag
The Quality Leader’s Pre-Deployment Checklist
Before scoping an AI root cause project, work through these four readiness questions. They determine whether your first ninety days produce a verified Cpk lift or another stalled pilot.
Data Coverage
Foundation
Are XRF, gas analyzers, kiln shell scanners, and LIMS already streaming into a historian? AI is only as accurate as the tag space it sees. Gaps here predict pilot failure better than any other variable.
Check:OPC-UA / Modbus / MQTT availability per asset
Missing tags can be filled with retrofit IoT sensors in 1–2 days per asset
Failure History
Training Set
Is the last 18–24 months of quality events, customer complaints, and CAPA records actually digitized? Models trained on your real defect history outperform generic templates by a wide margin.
Check:CAPA, NCR, and shift-log digital availability
Paper logs can be ingested via structured intake during onboarding
Cpk Baseline
Measurable
Do you have a documented Cpk for free lime, LSF, and 28-day strength predictions today? Without a baseline, you can’t prove the lift. With one, ROI is provable in the first quarter.
Check:Rolling Cpk on top 5 critical-to-quality tags
Audit-ready Cpk and Ppk calculations are part of standard SPC tooling
Operator Adoption
Make-or-break
Will CCR operators actually trust the prescriptive guidance? Mobile-first dashboards, plain-language alerts, and explainable AI outputs determine whether the model gets used or ignored.
Check:HMI integration plan and operator training scope
"The hardest problem in cement quality isn’t detecting that something has gone wrong — the lab will tell you that, eventually. The hardest problem is pointing at the right upstream cause fast enough to matter. When you correlate raw mix chemistry, kiln aerodynamics, and burning zone behavior continuously across hundreds of tags, root cause stops being an investigation you start after the failure and becomes a real-time output of the process itself. That’s the inflection point quality leaders should be measuring against in 2026."
— Cement Process Intelligence, Industry 4.0 Best Practice
40%+
of cement plant downtime value tied to kiln events
2–4 hr
typical lag between sampling and lab free-lime result
85–92%
world-class OEE target for integrated cement plants
Conclusion: The Quality Leader’s New Mandate
For decades, cement quality leadership meant managing a lag. You sampled, waited for the lab, debriefed the shift, and hoped the next batch held. AI root cause detection rewrites that job description. The new mandate is real-time process intelligence: every tonne of clinker produced under a model that knows, at every moment, what the free lime will be, why it’s drifting, and what to change. Plants that make this shift are eliminating 60%+ of quality-driven downtime, cutting fuel waste by 30–50 kcal/kg, and walking into audits with electronic Cpk records signed and time-stamped. The technology is mature, the integration paths are proven, and the ROI window is measured in weeks. The remaining question is whether you’ll start with your highest-risk kiln or wait for the next customer claim to force the conversation.
Make Your Next Quarter Your First Predictable One
iFactory deploys over your existing DCS, XRF, and LIMS — first predictive alerts within two weeks of go-live, verified Cpk lift within the first quarter, and a permanent audit trail from day one. Get a free Cpk and audit-readiness assessment built around your kiln’s actual data.
What is AI root cause detection for cement kiln operations?
AI root cause detection for cement kiln operations is the use of multivariate machine learning to continuously correlate 100+ process variables — raw mix chemistry, kiln temperature profile, fuel mix, gas composition, cooler behavior, and clinker quality outputs — in order to identify the upstream cause of any quality excursion in minutes rather than hours. Unlike manual RCA methods that investigate one path at a time after a defect appears, AI-driven detection predicts deviations before lab confirmation, ranks probable root causes with evidence, and pushes prescriptive corrective action directly to the operator HMI and CAPA system.
How does AI eliminate quality-driven downtime in a cement plant?
Three mechanisms compound. First, predictive models for free lime, liter weight, and 28-day strength forecast deviations 30–90 minutes ahead of conventional lab results, so operators correct the kiln before off-spec clinker is produced. Second, multivariate correlation surfaces the actual upstream cause — a quarry-face LSF shift or a coater-zone temperature dip — instead of forcing a reactive guess. Third, every event is logged into a plant-specific failure-pattern library, so the same defect doesn’t recur on the next shift. Plants running this approach report 60%+ reductions in quality-driven downtime and roughly 30% fewer off-spec clinker events within the first year.
Which process variables matter most for clinker quality root cause analysis?
The critical-to-quality set typically includes the chemical moduli LSF, SM, and AM in the raw mix; burning zone temperature and shell temperature profile; kiln drive amperage and torque; O&sub2;, CO, and NOx in the kiln gas; secondary air temperature and cooler quench rate; and free lime, liter weight, and predicted compressive strength as outputs. AI models correlate these continuously with feed rate, fuel calorific value, and homogenization silo behavior to reveal which combinations produce defects. No single variable explains clinker quality — that’s precisely why multivariate ML outperforms single-axis SPC.
Do we need to replace our DCS, SCADA, or LIMS to deploy AI root cause detection?
No. Modern AI platforms are explicitly designed to overlay existing plant automation. iFactory connects to DCS, SCADA, historians, XRF analyzers, gas analyzers, particle size analyzers, and LIMS via standard industrial protocols — OPC-UA, Modbus TCP, MQTT, and REST APIs — consuming data that already exists in your plant. Retrofit IoT sensors fill any coverage gaps, typically installed in 1–2 days per asset without shutdowns. Most mid-size cement plants reach an operational pilot within 4–8 weeks and full deployment within 3–6 months.
How quickly can a quality leader expect measurable Cpk improvement?
First predictive alerts on the highest-risk kiln typically appear within two weeks of sensor and data integration. Measurable Cpk improvement on critical parameters like free lime and predicted 28-day strength usually shows in the first quarter, as the models complete their calibration window (4–12 weeks) and operators begin acting on prescriptive guidance. Documented outcomes in mid-size cement deployments include 31% fewer off-spec clinker events and full ROI within twelve months. Plants with higher historical quality rework costs and unplanned downtime achieve payback faster, often within the first 6–10 weeks of go-live.