Pipeline Leak Detection & Monitoring — AI SCADA-Based Mass Balance & Acoustic Systems

By Johnson on July 2, 2026

pipeline-leak-detection-monitoring-ai-scada-mass-balance

Most pipeline leaks are not found on a control room screen — they are found later, by a landowner who smells product in a ditch or a drone flyover that spots a sheen weeks after the release began. Conventional mass balance systems only flag a leak once it reaches roughly one to two percent of flow rate, which on a large-diameter transmission line can mean thousands of barrels lost before an alarm ever fires. Acoustic sensors, pressure transient analysis, and fiber optic sensing can each catch what mass balance misses on its own, but only when the signals are correlated together instead of watched as separate screens by separate people. EHS managers working under API 1130 and the PHMSA Valve and Rupture Rule are now expected to prove a leak detection program actually performs, not just that it exists in a binder. Many operators start by choosing to book a demo to see how their own SCADA history would score against a combined AI model.

PIPELINE LEAK DETECTION & MONITORING

Catch a Sub-1% Leak Before It Becomes a 10,000-Barrel Release

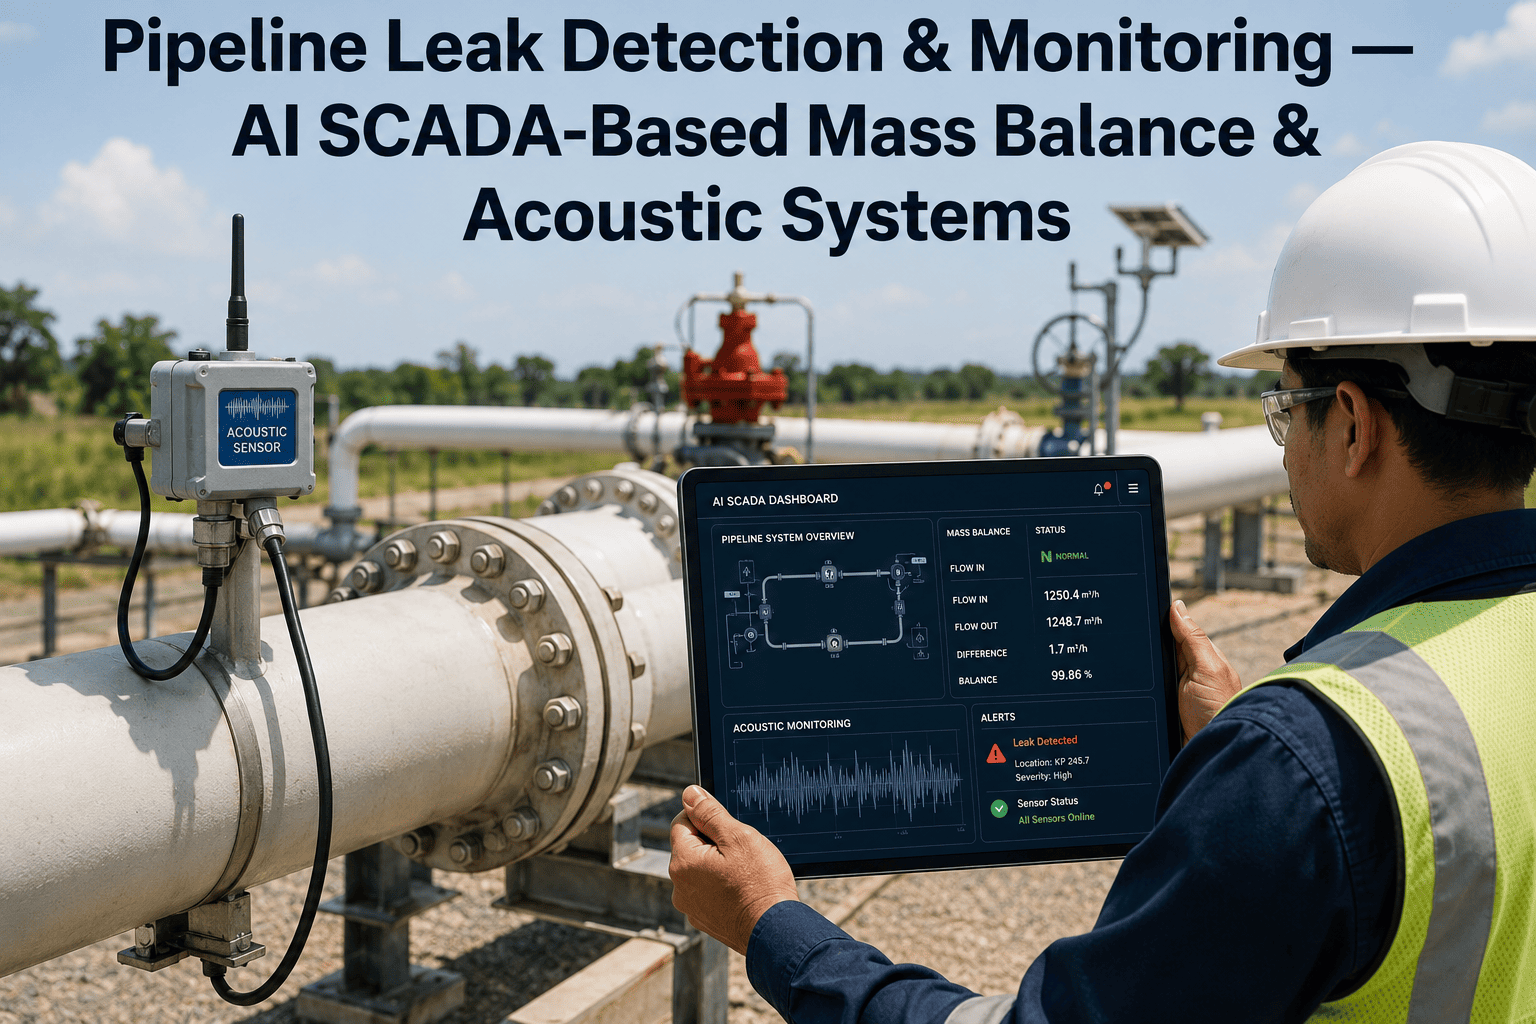
iFactory fuses SCADA mass balance, acoustic leak signatures, and pressure transient analysis into a single AI model that flags real leaks within minutes and clears out the false alarms that make dispatchers stop trusting the system.

<1% of flow
Leak sensitivity achievable with correlated AI detection, versus 1–2% for mass balance alone
2–5 min
Typical time from a confirmed leak event to a validated operator alarm
60–70%
Reduction in nuisance and false-positive alarms through cross-parameter validation
The Coverage Gap

Why Mass Balance Alone Leaves an EHS Manager Exposed

A computational pipeline monitoring system built on mass balance compares what enters a line against what leaves it, correcting for line pack, temperature, and compressibility along the way. It is the backbone of most CPM programs, and it is also the method with the least sensitivity of the group, typically catching leaks only once they reach one to two percent of flow rate. On a high-throughput crude or NGL line, that threshold can hide a meaningful loss for hours or days, particularly during the transient states — pump starts, batch changes, slack line conditions — where mass balance is most prone to both missed leaks and false alarms.

Under 49 CFR 195.452, operators must document a means to detect leaks that has actually been evaluated against the risk to high-consequence areas, not simply installed and left running. When an incident review shows a leak sat below the mass balance threshold for days before discovery, the gap between what was documented and what the system could actually see becomes the finding an inspector writes up.

How Detection Layers Combine

Four Detection Layers, Correlated Into One Signal

No single method covers every leak size, location, and flow condition on its own, which is why API 1130 encourages operators to combine complementary techniques rather than lean on one. iFactory runs these four layers continuously and cross-checks them against each other before anything reaches a dispatcher.

Mass Balance & Line Pack
Continuous inlet-to-outlet volume comparison corrected for line pack, temperature, and compressibility, segmented at 5–20 km intervals for better localization on longer runs.
Acoustic Emission Sensing
Escaping fluid generates pressure waves in roughly the 1–100 kHz range at the leak point, picked up by acoustic sensors and matched against a trained baseline to separate a real leak from pump noise or traffic vibration.
Pressure Point Analysis
Sudden pressure drops or negative pressure waves at intermediate points along the line flag ruptures and larger leaks almost immediately, well ahead of a mass balance threshold being crossed.
Distributed Fiber Optic Sensing
Rayleigh backscatter picks up acoustic disturbance along the entire fiber route for DAS, while Brillouin and Raman backscatter track temperature and strain shifts, giving continuous coverage on right-of-way sections without discrete sensors every few meters.
Method Comparison

Sensitivity and Response Time by Detection Method

Each method trades off sensitivity, cost, and false-alarm risk differently, which is why the right combination depends on line diameter, right-of-way access, and the consequence area the segment runs through.

Method Typical Sensitivity Detection Time Key Limitation
Mass balance / CPM 1–2% of flow rate Minutes to hours Prone to false alarms during transients
Acoustic emission Down to <1% of flow Seconds to minutes Sensitive to ambient noise without correlation
Pressure point analysis Best on ruptures & large leaks Near-instant on ruptures Weaker on small, slow seeps
Distributed fiber (DAS/DTS) High on instrumented sections Seconds to minutes Coverage limited to fiber route
SEE IT ON YOUR OWN LINE

Run Your Last 12 Months of SCADA History Through the Same Model

Most operators already have the flow, pressure, and temperature data needed to answer one question: would iFactory have caught your last reportable incident earlier than it was actually caught?

Regulatory Alignment

Built Around API 1130 and the PHMSA Valve & Rupture Rule

API 1130 is incorporated by reference into 49 CFR 195.134 and 195.444, and it shapes how a CPM system must be designed, evaluated, operated, and tested. The 2022 Valve and Rupture Rule layered on additional obligations around rupture-mitigation valve spacing, pressure monitoring at those valves, and immediate 911 notification once a rupture is suspected. iFactory is built to generate the evidence an EHS manager needs against both.

API 1130 CPM design & performance testing
Continuous logging of detection sensitivity, response time, and false-alarm rate against your documented performance targets
49 CFR 195.452 leak detection evaluation
A defensible record of detection capability per HCA segment, tied to the actual risk analysis on file
Valve & Rupture Rule pressure monitoring
Upstream and downstream pressure trending at rupture-mitigation valves, correlated with pressure point analysis
API 1175 leak detection program management
Alarm response workflows, dispatcher training data, and audit-ready reporting built into the same platform
Field Perspective

Before this, our mass balance system threw a false alarm almost every time we started a pump, so dispatchers had started treating every alert the same way — worth a glance, not a shutdown. Once acoustic and pressure data were correlated with the mass balance number instead of standing alone, the alarm volume dropped and the ones that came through actually meant something. That is the difference between a system that exists on paper and one people trust enough to act on.

Denise R. EHS Manager, Midstream Gathering & Transmission Operator
First 90 Days

What Changes After Correlated Detection Goes Live

The shift most EHS teams describe is not one dramatic catch — it is a steady drop in wasted attention on false alarms alongside a real increase in confidence that a genuine small leak will not sit unnoticed for days.

1–3 wks
Typical Integration via SCADA / OPC-UA
60–70%
Fewer False & Nuisance Alarms
2–5 min
Confirmed-Leak-to-Alarm Time
4–6 mo
Average Time to Positive ROI
FAQ

Pipeline Leak Detection — Frequently Asked Questions

Standard mass balance CPM typically needs a leak to reach roughly one to two percent of flow rate before the imbalance is large enough to clear the noise floor and trigger an alarm. On a large-diameter transmission line running a high daily volume, that threshold alone can represent a meaningful loss before anyone is notified. Adding acoustic emission and pressure point analysis on top of mass balance lowers the practical detection floor well below that one percent mark, because a small leak that mass balance cannot yet distinguish from measurement noise often already has a clear acoustic or pressure signature.
In most cases the flow, pressure, and temperature data already streaming from your SCADA and CPM historian is enough to build the correlated model, so no line shutdown is needed to get started. New acoustic sensors or distributed fiber are sometimes added afterward on specific high-consequence segments to close a coverage gap, but that is a targeted addition rather than a full rebuild. Integration through OPC-UA or a REST API to the existing historian typically completes in one to three weeks without interrupting normal operations.
API 1130 expects an operator to evaluate and document the actual performance of its CPM system, not just confirm that one is installed, and 49 CFR 195.452 asks for that evaluation to be tied to the risk analysis for each HCA segment. iFactory continuously logs detection sensitivity, alarm response time, and false-alarm rate per segment, which gives an EHS manager the evidence an inspector actually asks for during an integrity management review. The platform also tracks upstream and downstream pressure at rupture-mitigation valves, which lines up directly with the pressure monitoring requirement introduced by the Valve and Rupture Rule. A walkthrough of how this maps to your specific segments is available through support or a scheduled demo.
Yes, and this is where most conventional mass-balance-only systems struggle, since a pump start, a batch change, or a slack line condition can all momentarily look like an imbalance on a single channel. iFactory correlates mass balance against acoustic and pressure signatures before escalating anything to a dispatcher, so a transient that would normally trigger a nuisance alarm gets recognized and suppressed automatically. This cross-parameter check is also what drives the meaningful drop in false alarms that most operators notice within the first few weeks of running the combined model.
A typical rollout starts by connecting to the existing SCADA historian and validating flow, pressure, and temperature data quality across each priority segment, usually completing within the first couple of weeks. Baseline models are then built per segment using your own historical operating data, since fouling, elevation profile, and typical transient behavior vary meaningfully even between segments on the same system. Once baselines are validated, correlated alerting and dispatcher workflows go live, with the team available throughout onboarding to tune thresholds against your actual line conditions. You can book a demo to see how this would map onto your own gathering or transmission footprint.
MASS BALANCE · ACOUSTIC · PRESSURE ANALYSIS · FIBER OPTIC

Stop Finding Out About a Leak From a Landowner Instead of a Sensor

iFactory correlates the flow, pressure, and acoustic data your pipeline already produces into one AI-driven leak detection signal — built to catch small leaks early and to hold up under an API 1130 or PHMSA review.


Share This Story, Choose Your Platform!