Induced Draft (ID) fans are the lungs of a cement kiln. Without continuous, high-volume exhaust airflow from these massive rotating machines — often drawing 500,000 to 1,200,000 cubic feet per minute — clinker production stops. Kiln temperature collapses. The entire pyroprocessing line shuts down. An unplanned ID fan failure in a mid-size cement plant costs between $80,000 and $350,000 per day in lost production emergency labor and expedited parts. Yet most cement plants in the U.S. still rely on scheduled vibration checks, manual blade inspections, or alarm-based shutdown thresholds to manage ID fan health — strategies that consistently miss the two to four weeks of warning window that modern edge AI vibration analysis can deliver. This guide covers exactly how AI-powered ID fan imbalance detection works and what the failure modes look like in vibration data, how edge AI processes that data at the machine level, and what the operational and financial case looks like for a mid-size cement plant deploying the technology in 2026.
Edge AI · Predictive Analytics · Rotating Equipment
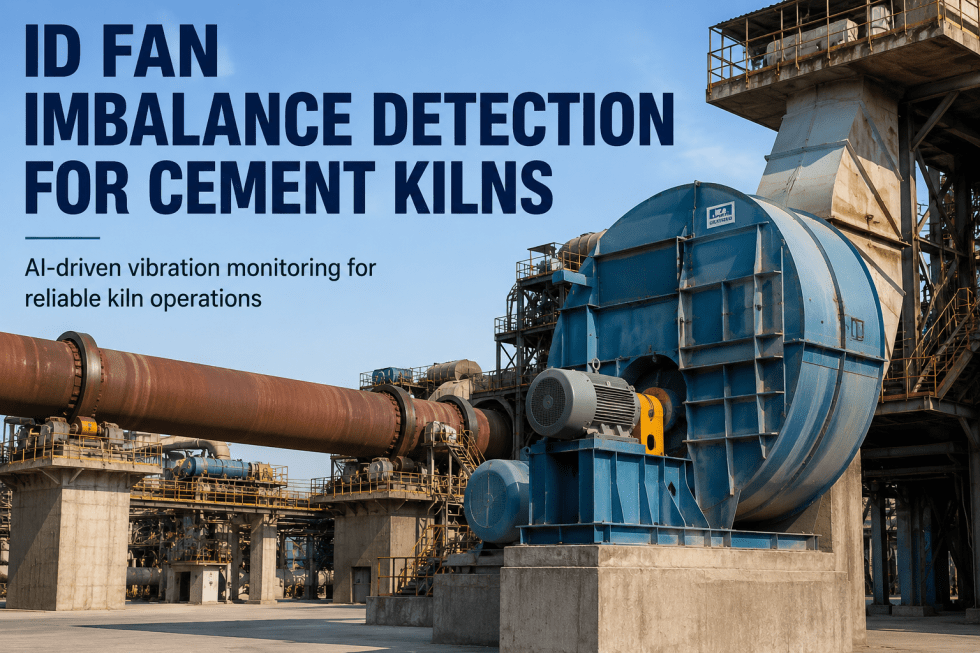
ID Fan Imbalance Detection for Cement Kilns
Real-time vibration analysis at the edge catches ID fan imbalance signatures 2–4 weeks before failure — auto-scheduling cleaning and balancing work orders before the kiln exhaust system trips offline.
Sources: ANSI/ISA-18.2 · ISO 10816-3 · ISO 20816-3 · VDI 3839 · iFactory Plant Deployment Data 2026 · NRMCA Production Reports
Why ID Fan Imbalance Is the Leading Cause of Unplanned Kiln Downtime
Cement kiln ID fans operate in one of the harshest environments in heavy industry. Hot, particulate-laden exhaust gas at temperatures ranging from 250°F to 450°F passes continuously through the fan housing, depositing alkali bypass dust, sulfate compounds, and unburned fuel residue onto the impeller blades. This deposition is rarely uniform. Different blade geometries, local turbulence patterns, and variable raw mix chemistry mean that one blade face accumulates 40 to 80 pounds of material while an adjacent blade accumulates 10 to 15 pounds. That mass differential — invisible from the outside, undetectable by temperature sensors, and not captured by flow meters — creates rotational imbalance that transfers directly into bearing load cycles.
ID Fan Failure Mode Progression — From Imbalance Onset to Catastrophic Failure
ISO 10816-3 · ISO 20816-3 · VDI 3839 Rotating Machinery Diagnostic Standards
Phase 1 · Weeks 1–2
Initial Deposit Accumulation
Blade deposits begin accumulating unevenly. 1× rotational frequency (1X) amplitude rises 15–25% above baseline. No visible symptoms. Standard alarm thresholds not triggered. AI detects spectral shift.
Vibration signal · 1X amplitude increase + phase angle drift
Phase 2 · Weeks 3–4
Progressive Imbalance Development
Mass imbalance reaches 150–300 gram-meters. 1X amplitude 40–70% above baseline. Bearing temperature begins trending up 8–15°F. Sub-harmonic frequencies appear. iFactory auto-generates cleaning work order at this threshold.
Vibration signal · 1X dominant + sub-harmonics + bearing temperature rise
Phase 3 · Week 5–6
Accelerated Bearing Degradation
Imbalance forces exceed bearing design load at speed. Ball pass frequency outer race (BPFO) and ball pass frequency inner race (BPFI) signatures appear in high-frequency spectrum. Lubrication film breakdown accelerates. Manual inspection now confirms visual cracking or spalling.
Vibration signal · BPFO + BPFI peaks + broadband noise floor rise
Phase 4 · Week 7–8
Catastrophic Failure / Emergency Shutdown
Bearing seizure or shaft deflection triggers vibration trip. Kiln exhaust collapses. Emergency shutdown required. Impeller may contact housing. Shaft damage possible. Repair scope escalates from $40K blade cleaning to $180K–$500K bearing, shaft, and housing replacement.
Vibration signal · Trip alarm — all frequencies elevated — broadband floor > 10× baseline
The 4 Primary Failure Modes Edge AI Detects — and What Each Looks Like in Data
ID fan health monitoring is not a single measurement problem. Four distinct failure modes each produce different vibration signatures at different frequency bands, and each requires a different maintenance response. Threshold-based alarm systems — which fire at a fixed vibration amplitude regardless of frequency content — catch only the late-stage presentation of these failure modes. Edge AI models trained on fan-specific vibration libraries can isolate each failure mode individually, weeks earlier, and generate specific work orders matched to the failure type. Schedule a Demo to see how AI detects Failures
Mass Imbalance (Blade Deposit)
The most common ID fan failure mode in cement. Uneven alkali and sulfate deposit accumulation on impeller blades creates static and dynamic imbalance. The vibration signature is highly specific: dominant energy at exactly 1× running speed frequency, with phase angle that remains stable relative to the imbalance location. As deposit mass increases, 1X amplitude grows proportionally. The AI model tracks the ratio of 1X to 2X amplitude — a rising 1X/2X ratio above 3.5 is a high-confidence imbalance indicator regardless of absolute amplitude.
Key Frequency Indicators
1× RPM
Dominant
2× RPM
Low
Sub-harm.
Minimal
Auto Work Order · Scheduled blade cleaning + balance check
1×
Primary frequency signature
2–4 wk
Detection lead time before trip
$8K
Planned cleaning cost (typical)
$180K+
Unplanned failure repair cost
Blade Erosion
Progressive material loss from blade leading and trailing edges due to abrasive particulate impact. Unlike deposit-driven imbalance, erosion produces an asymmetric mass loss that worsens irreversibly without replacement. The vibration signature shows both 1× and 2× elevation, but the ratio inverts over time — 2× catches up to 1× as structural asymmetry develops. High-frequency wideband noise also rises as blade surface roughness increases turbulent airflow. Edge AI tracks erosion separately from deposit imbalance using the frequency ratio trend, triggering a blade inspection work order distinct from a cleaning order.
Key Frequency Indicators
1× RPM
Elevated
2× RPM
Rising
Wideband
High
Auto Work Order · Blade thickness inspection + replacement scheduling
1×+2×
Dual-frequency signature
3–6 wk
Detection lead time before trip
$22K
Planned blade replacement cost
$300K+
Unplanned impeller failure cost
Rolling Element Bearing Fault
Bearing faults develop progressively through four ISO 13373-defined stages from subsurface fatigue through spalling and seizure. Each stage produces characteristic high-frequency fault tones — Ball Pass Frequency Outer Race (BPFO), Ball Pass Frequency Inner Race (BPFI), Ball Spin Frequency (BSF), and Fundamental Train Frequency (FTF) — calculated from bearing geometry and running speed. Edge AI performs high-resolution FFT at 25.6kHz sampling rates required to resolve these tones, which standard PLC analog inputs cannot capture. Early-stage bearing faults are detectable in Stages 1–2, 4–8 weeks before Stage 4 seizure.
Key Frequency Indicators
BPFO
Primary
BPFI
Secondary
BSF
Present
Auto Work Order · Lubrication check + bearing replacement scheduling
4–8 wk
Stage 1–2 detection lead time
25.6kHz
Sampling rate required for detection
$15K
Planned bearing replacement cost
$500K+
Shaft + housing damage repair cost
Structural Resonance
When an ID fan's operating speed passes through or parks near a structural natural frequency of the fan housing, support structure, or connected ductwork, resonance amplifies any underlying imbalance force by a factor of 5 to 20. A fan with acceptable imbalance at 900 RPM may exhibit catastrophic vibration if a speed change brings it to 980 RPM where a structural mode sits. Edge AI performs real-time operating deflection shape (ODS) analysis by cross-correlating vibration sensors on the fan housing, bearing pedestals, and ductwork supports to identify resonance amplification patterns and determine whether the root cause is structural or mechanical.
Key Frequency Indicators
Natural Freq.
Peak
1× RPM
Amplified
Harmonics
Multiple
Auto Work Order · ODS survey + structural stiffening or speed adjustment
5–20×
Resonance amplification factor
Real-time
ODS cross-correlation analysis
$30K
Structural stiffening intervention
$400K+
Resonance-driven housing failure cost
How Edge AI Processes Vibration Data — The Technical Architecture
The diagnostic accuracy of an ID fan monitoring system is determined almost entirely by the compute architecture sitting between the vibration sensor and the maintenance work order. Standard SCADA systems sample vibration at 1–10 Hz — fast enough for process control, not fast enough to resolve bearing fault frequencies that require 25,600 Hz sampling. Standard cloud analytics systems introduce 2–10 second latency that eliminates sub-second fault detection. Edge AI deployed at the fan level solves both problems: high-frequency sampling at the sensor, deterministic inference at the edge, and selective data forwarding to cloud historians.
Edge AI Data Processing Architecture — From Vibration Sensor to Work Order
ICP accelerometers on drive-end and non-drive-end bearings, housing, and duct connection. 25,600 Hz sampling. Temperature, RPM tachometer co-located.
Spec · ISO 13373-1 sensor placement protocol
02
Edge AI Module
NVIDIA Jetson or equivalent. Real-time FFT, envelope analysis, bearing fault frequency matching. AI inference < 100ms. No cloud dependency for detection.
Spec · Sub-100ms inference · 25.6kHz ADC
03
Fault Classification
ML model maps spectral features to fault class: imbalance, erosion, bearing stage 1–4, resonance, misalignment. Confidence score + severity index generated per inference cycle.
iFactory CMMS receives fault classification. Work order auto-generated with fault type, severity, recommended action, parts needed, and priority window. No manual triage required.
Spec · Work order in CMMS within 60 seconds of fault detection
The Financial Case — What Early Detection Is Worth to a Mid-Size Cement Plant
The ROI calculation for ID fan imbalance detection is not complex, but most plants have never done it rigorously. The numbers below are based on typical mid-size U.S. cement plants producing 1.5 to 3 million tons per year, with two to three kiln lines and two to four ID fans per line. Costs and savings are presented conservatively, using NRMCA production data and industry maintenance benchmark surveys from 2024–2026. Book a Demo to Calculate Plant's ROI
System Investment
Edge AI hardware per fan (sensor array + compute module)
Emergency repair cost avoidance (planned vs unplanned)
$40,000 – $160,000
Bearing life extension (20–35% longer service intervals)
$15,000 – $45,000
Cleaning optimization (condition-based vs calendar-based)
$12,000 – $30,000
Conservative Annual Savings
$147,000 – $585,000
4–14 months
Typical payback period
3–8×
5-year ROI range
Year 2+
Software-only cost after hardware recovered
Every Unplanned Kiln Shutdown Costs More Than the Entire Monitoring System
Get a Plant-Specific ROI Estimate for ID Fan Monitoring
We will walk through your kiln line configuration, ID fan specifications, current maintenance cost data, and downtime history to build a site-specific ROI model — not a generic estimate. Most mid-size plants see payback in under 12 months.
ID fan imbalance detection is one of the highest-ROI predictive maintenance applications in cement manufacturing — not because the technology is exotic, but because the failure consequences are so severe and the warning window is so accessible. Edge AI processing at 25,600 Hz sampling rates can consistently detect mass imbalance, blade erosion, bearing fault development, and resonance conditions 2 to 8 weeks before they escalate to kiln shutdown events. The combination of early fault detection, automated work order generation matched to specific failure types, and condition-based maintenance scheduling replaces calendar-based guesswork with engineering data — and typically delivers payback in 4 to 14 months for a mid-size U.S. cement plant operating 2 to 4 kiln ID fans. Plants building or upgrading kiln lines in 2026 have the opportunity to specify ID fan monitoring as a day-one capability rather than a retrofit — with edge AI architecture designed into the ISA-95 OT layer from the start, not bolted on after commissioning. The 20-year operating life of a cement kiln makes that architectural decision one of the most durable cost and reliability choices available at the design stage.
Frequently Asked Questions
Standard vibration monitoring systems — including most PLC analog input modules and SCADA-connected transmitters — sample vibration at 1 to 10 Hz. That sampling rate is adequate for process control but cannot resolve the high-frequency bearing fault tones (BPFO, BPFI, BSF) that require 25,600 Hz or higher sampling to detect. Edge AI systems deploy dedicated high-frequency data acquisition hardware at the sensor, perform real-time FFT and envelope analysis at the edge compute module, and run trained ML models to classify fault type with confidence scoring. The output is not a raw vibration level but a specific fault classification — mass imbalance, blade erosion, bearing stage, or resonance — with an associated maintenance recommendation auto-pushed to CMMS. That is the operational difference: from a number on a dashboard to a work order in a technician's queue.
A complete ID fan monitoring installation per ISO 13373-1 placement protocol typically uses 4 to 6 ICP triaxial accelerometers: drive-end bearing horizontal, drive-end bearing vertical, drive-end bearing axial, non-drive-end bearing horizontal, non-drive-end bearing vertical, and optionally a housing measurement point on the fan volute. A tachometer (keyphasor) is also installed for exact RPM and phase reference. For resonance detection, additional sensors on the fan support structure and duct connections improve operating deflection shape analysis. The minimum viable installation for imbalance detection alone is 2 sensors — one per bearing in the dominant vibration plane — but full fault classification across all 4 failure modes requires the complete 4 to 6 sensor array.
Yes. iFactory's edge AI architecture is designed to operate within existing ISA-95 network structures without requiring infrastructure changes to the core DCS or SCADA layer. The edge compute module sits at ISA-95 Level 1 to 2, communicating upward via OPC-UA or MQTT to the historian and CMMS at Level 3 — using existing OT VLAN paths. CMMS integration supports REST API, MQTT, and direct database connector for SAP PM, IBM Maximo, Infor EAM, and other major platforms. The integration scope is a standard 4 to 6 week workstream. A full IT/OT architecture overhaul is not a prerequisite. The most common integration constraint is firewall rules between OT and IT zones, which is resolved with a network assessment in week 1 of the deployment checklist.
False positive management is built into the system at two levels. First, the AI model requires a confidence threshold above 85% sustained over a configurable time window (default 4 hours) before generating a work order — single-cycle anomalies do not trigger. Second, work orders generated by iFactory are flagged as AI-recommended and require a one-click technician acknowledgment before moving to active status, giving maintenance supervisors a review gate. False positives detected during the 7-day shadow-run period are used to refine threshold calibration before full go-live. Post-commissioning false positive rates below 5% are standard for well-baselined installations. When false positives do occur, the feedback loop — technician marking a work order as closed with no fault found — is automatically used to improve model accuracy for that specific machine.
For a two-kiln plant with four ID fans, the total year-1 investment including hardware, installation, CMMS integration, and software licensing typically ranges from $165,000 to $260,000 depending on sensor count per fan, existing network infrastructure readiness, and CMMS integration complexity. Hardware and installation are one-time costs recovered in year 1 or 2. From year 2 onward, the ongoing cost is software licensing at $6,000 to $12,000 per fan per year — typically $24,000 to $48,000 annually for four fans. Conservative annual savings from avoided unplanned downtime and optimized maintenance scheduling range from $147,000 to $585,000 depending on plant production rate and historical unplanned event frequency. We build site-specific ROI models for every prospective customer before contract — contact iFactory support or book a demo session to receive a plant-specific analysis.
The Next Unplanned ID Fan Failure Is Predictable — and Preventable
Deploy Edge AI ID Fan Monitoring. Stop Reacting. Start Predicting.
Whether you are running one kiln or five, managing aging ID fans on a legacy DCS, or specifying equipment for a new greenfield line, iFactory will build a deployment plan matched to your specific fan specs, network architecture, and CMMS — and show you the ROI math before you commit a dollar.